MP MTF LiquidityMP MTF Liquidity
Multi-Timeframe Liquidity Levels – Automatic High/Low Tracking
This indicator automatically tracks and draws liquidity levels (recent highs and lows) from up to 6 custom timeframes directly on your chart. It’s designed for advanced traders who want to visualize important swing points and liquidity pools across multiple timeframes—ideal for Smart Money Concepts (SMC), ICT, and price action trading.
Key Features:
Multi-Timeframe Support:
Select up to 6 different timeframes (ex: 1H, 4H, Daily, Weekly, etc.), each with separate color and visibility controls.
Real Liquidity (No Repaint):
Levels are only drawn from fully closed bars on each timeframe—no lines from currently forming candles, ensuring accuracy and no forward-looking bias.
Automatic Detection:
Highs and lows are detected automatically. Levels that get swept (price breaks through) are converted to dashed lines for easy visual distinction.
Customizable:
Choose line colors for highs/lows and set the maximum number of active levels per timeframe to keep charts clean.
Extended Lines:
All levels are extended to the right, helping you see how current price interacts with past liquidity.
How It Works:
On every new bar of your chosen higher timeframe(s), the indicator records the high and low of the previous (just-closed) candle.
These levels are extended as rays until price sweeps (crosses) them.
When a level is swept, it is redrawn as a dashed line to highlight liquidity grabs or stop hunts.
No lines are drawn for the “live” bar—only confirmed, closed levels are displayed.
Who is this for?
SMC, ICT, and price action traders seeking high-confidence liquidity zones.
Intraday, swing, and multi-timeframe traders who want an automated, visual edge.
Anyone wanting to avoid repainting or “fake” levels from unfinished candles.
Tip:
Combine this indicator with your favorite order block, fair value gap (FVG), or market structure tools for even greater context and confluence.
Disclaimer:
No indicator guarantees profits. Always use with proper risk management and in conjunction with your trading plan.
스크립트에서 "fvg"에 대해 찾기

Checklist Dashboard Table# Checklist Dashboard Table – ICT/SMC Trading Helper
Overview
The “Checklist Dashboard Table” is a TradingView indicator designed to help traders structure, organize, and validate their market analyses following the ICT/SMC (Inner Circle Trader / Smart Money Concepts) methodology. It provides a visual and interactive checklist directly on your chart, ensuring you never miss a crucial step in your decision-making process.
Key Features
- Visual Checklist : All your trading criteria are displayed as color-coded checkboxes (green for validated, red for not validated), making your analysis process both clear and efficient.
- Clear Separation Between Analysis and Confirmations :
- Analysis : Reminders for your routine, such as timeframe selection (M3 to H4), trend analysis via RSI, and identification of key zones (Midnight Open, SSL/BSL, Asian High/Low).
- Confirmations : Six customizable criteria to check off as you validate your setup (clear trend, OB + FVG, OTE zone, Premium/Discount, R/R > 1:2, CBDR/Midnight).
- Personal Notes Section : Keep your trade entries, observations, or comments in a dedicated field in the indicator’s settings. Your notes are displayed right in the checklist for quick reference and journaling.
- Elegant and Compact Display : The table is styled for readability and can be positioned anywhere on your chart.
- Quick Customization : Instantly update any criterion or your personal notes via the script settings.
How to Use
1. Add the indicator to your chart.
2. Review the “Analysis” section as your pre-trade routine reminder.
3. Check off the “Confirmations” criteria as you validate your entry strategy.
4. Write your trade notes or comments in the provided notes section.
5. Use the checklist to reinforce discipline and repeatability in your trading.
Why Use This Checklist?
- Prevents you from skipping important steps in your analysis.
- Reinforces trading discipline and consistency.
- Allows you to document and review your trade decisions for ongoing improvement.
Who Is It For?
Perfect for ICT/SMC traders, but also valuable for anyone looking to organize and systematize their trading process.
Happy trading!

Ralph Indicator - ZaraTrust Smart MoneyThe Ralph Indicator – ZaraTrust Smart Money is a powerful yet simple Smart Money Concepts (SMC) based tool designed for traders who want to trade like institutions. It auto-detects high-probability Buy/Sell zones, Support/Resistance levels, and Demand/Supply areas on the chart — giving you clear, visual, and actionable signals without the clutter.
⸻
🔍 Key Features:
✅ Smart Money Structure
• Uses pivot-based logic to identify potential structure points
• Helps you understand market flow (e.g., BOS, CHoCH simplified logic)
✅ Automatic Support & Resistance
• Plots major levels based on significant highs and lows
• Helps catch key reversal or breakout zones
✅ Demand & Supply Zones
• Visually shows areas where price may react strongly
• Based on smart pivot detection from recent swings
✅ Buy/Sell Trade Signals
• Highlights buy when price breaks resistance (possible bullish shift)
• Highlights sell when price breaks support (possible bearish shift)
✅ Clean & Easy UI
• Toggle features on/off from settings panel
• Labels and shapes are plotted clearly on the chart for instant reading
⸻
🛠️ Recommended Use:
• Use on 15min to 4H timeframe for intraday or swing trading
• Combine with price action (e.g., confirmation candles, liquidity grab)
• Works best when paired with institutional logic (OBs, FVG, liquidity)
⸻
⚠️ Disclaimer:
This indicator is a tool, not a signal service.
It does not guarantee 98% accuracy, but it’s designed to highlight smart money zones and high-probability areas. Always do your own risk management and backtest before using on a live account.

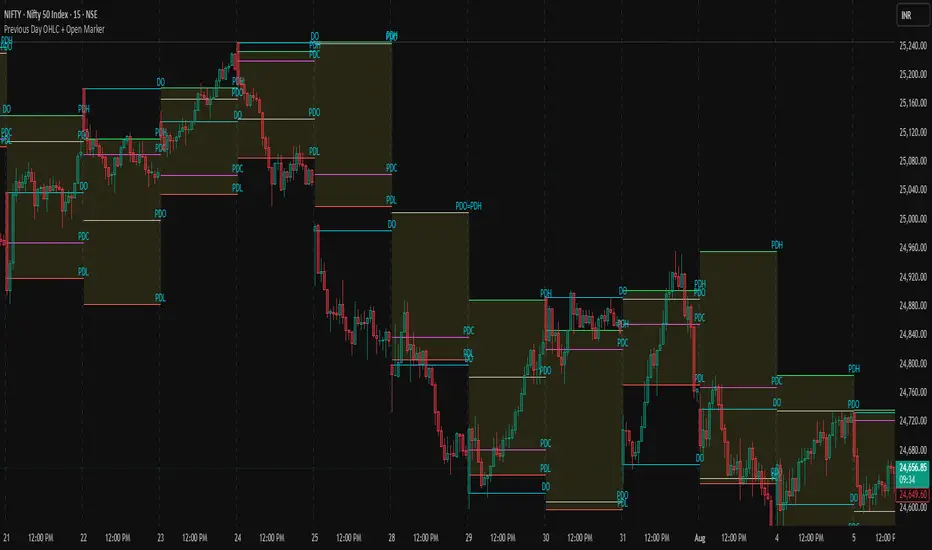
Previous Day OHLC + Open MarkerPrevious Day OHLC + Open Marker
This indicator is designed to help traders quickly identify the most important price levels from the previous trading session and today’s open. It provides a clean and configurable overlay of the previous day’s OHLC (Open, High, Low, Close) along with the current day's opening price, making it easy to spot price reactions, liquidity sweeps, and confluence zones.
📌 Key Features
✅ Previous Day OHLC Lines
Plots horizontal lines for High (H), Low (L), Open (O), and Close (C) from the previous session
Each line is independently toggleable
Fully customizable in color, transparency, and thickness
✅ Today's Session Open (DO)
Marks the current day's opening price
Helps identify directional bias, trend/momentum shifts, or mean-reversion points
✅ Minimalist Labels for Clarity
Text-only labels like H, L, O, C, and DO — no bulky label boxes
Color-matched to each line for visual simplicity
Optional display to keep charts clean
✅ Session-Based Highlight Zone
Optionally highlights the area between the previous day’s High and Low with a shaded box
Useful for identifying the day’s value area or range breakouts
✅ Smart Alerts
Receive alerts when price crosses any of the levels: PDH, PDL, PDO, PDC, or Today’s Open
Helps you catch key interactions without watching the chart constantly
🧠 Ideal For
Intraday traders using VWAP, order blocks, or liquidity concepts
Swing traders who want to see how current price relates to prior structure
Scalpers looking for clean levels to enter fades, reversals, or breakouts
Anyone applying institutional trading concepts (PDH/PDL sweeps, FVGs, BPRs, etc.)
⚙️ Customization Options
Toggle each level (H/L/O/C/DO) individually
Show or hide labels and highlight zone
Customize color, line thickness, and transparency
Clean layout — no line extensions across the entire chart
🧼 Design Philosophy
This script was created for clarity, speed, and minimalism. It avoids clutter while preserving all the crucial context price action traders need. Labels are informative but unobtrusive, and alerts help automate level tracking.
🛠 Built with Pine Script v5
🔔 Alerts Included
📊 Optimized for both intraday and swing trading
📦 Lightweight and modular by design
Fair Value Gap Profiles [AlgoAlpha]🟠 OVERVIEW
This script draws and manages Fair Value Gap (FVG) zones by detecting unfilled gaps in price action and then augmenting them with intra-gap volume profiles from a lower timeframe. It is designed to help traders find potential areas where price may return to fill liquidity voids, and to provide extra detail about volume distribution inside each gap to assess strength and likely mitigation. The script automatically tracks each gap, updates its state over time, and can show which gaps are still unfilled or have been mitigated.
🟠 CONCEPTS
A Fair Value Gap is a zone between candles where no trades occurred, often seen as an inefficiency that price later revisits. The script checks each bar to see if a bullish (low above 2-bars-ago high) or bearish (high below 2-bars-ago low) gap has formed, and measures whether the gap’s size exceeds a threshold defined by a volatility-adjusted multiplier of past gap widths (to only detect significantly large gaps). Once a qualified gap is found, it gets recorded and visualized with a box that can stretch forward in time until filled. To add more context, a mini volume profile is built from a lower timeframe’s price and volume data, showing how volume is distributed inside the gap. The lowest-volume subzone is also highlighted using a sliding window scan method to visualise the true gap (area with least trading activity)
🟠 FEATURES
Visual gap boxes that appear automatically when bullish or bearish fair value gaps are detected on the chart.
Color-coded zones showing bullish gaps in one color and bearish gaps in another so you can easily see which side the gap favors.
Volume profile histograms plotted inside each gap using data from a lower timeframe, helping you see where volume concentrated inside the gap area.
Highlight of the lowest-volume subzone within each gap so you can spot areas price may target when filling the gap.
Dynamic extension of the gap boxes across the chart until price comes back and fills them, marking them as mitigated.
Customizable colors and transparency settings for gap boxes, profiles, and low-volume highlights to match your chart style.
Alerts that notify you when a new gap is created or when price fills an existing gap.
🟠 USAGE
This indicator helps you find and track unfilled price gaps that often act as magnets for price to revisit. You can use it to spot areas where liquidity may rest and plan entries or exits around these zones.
The colored gap boxes show you exactly where a fair value gap starts and ends, so you can anticipate potential pullbacks or continuations when price approaches them.
The intra-gap volume profile lets you gauge whether the gap was created on strong or thin participation, which can help judge how likely it is to be filled. The highlighted lowest-volume subzone shows where price might accelerate once inside the gap.
Traders often look for entries when price returns to a gap, aiming for a reaction or reversal in that area. You can also combine the mitigation alerts with your trade management to track when gaps have been closed and adjust your bias accordingly. Overall, the tool gives a clear visual reference for imbalance zones that can help structure trades around supply and demand dynamics.

Rifle UnifiedThis script is designed for use on 30-second charts of Dow Jones-related symbols (YM, MYM, US30). It provides automated buy and sell signals using a combination of price action, RSI (Relative Strength Index), and volume analysis. The script is intended for both live trading signals and backtesting, with configurable risk management and debugging features.
Core Functionality
1. Signal Generation Logic
Trigger: The algorithm looks for a sharp price move (drop or rise) of a user-defined threshold (default: 80 points) within a specified lookback window (default: 20 minutes).
Levels: It monitors for price drops below specific numerical levels ending in 23, 43, or 73 (e.g., 42223, 42273).
RSI Condition: When price falls below one of these levels and the RSI is below 30, the setup is considered active.
Buy Signal: A buy is triggered if, after setup:
Price rises back above the level,
The RSI rate of change (ROC) indicates exhaustion of the drop,
The current bar shows positive momentum.
2. Trade Management
Stop Loss & Take Profit: Configurable fixed or trailing stop loss and take profit levels are plotted and managed automatically.
Exit Signals: The script signals exit based on price action relative to these risk management levels.
3. Filters & Enhancements
Parabolic Move Filter: Prevents entries during extreme price moves.
Dead Cat Bounce Filter: Avoids false signals after sharp reversals.
Volume Filter: Optionally requires volume conditions for trade entries (especially for shorts).
Multiple Confirmation Layers : Includes checks for 5-minute RSI, momentum, and price retracement.
User Inputs & Customization
Trade Direction: Toggle between LONG and SHORT signal generation.
Trigger Settings: Adjust thresholds for price moves, lookback windows, RSI ROC, and volume requirements.
Trade Settings: Set take profit, stop loss, and trailing stop behavior.
Debug & Visualization: Enable or disable various plots, labels, and debug tables for in-depth analysis.
Backtesting: Integrated backtester with summary and detailed statistics tables.
Technical Features
Uses External Libraries: Relies on RifleShooterLib for core logic and BackTestLib for backtesting and statistics.
Multi-timeframe Analysis: Incorporates both 30-second and 5-minute RSI calculations.
Chart Annotations: Plots entry/exit points, risk levels, and debug information directly on the chart.
Alert Conditions: Built-in alert triggers for key events (initial move, stall, entry).
Intended Use
Markets: Dow Jones symbols (YM, MYM, US30, or US30 CFD).
Timeframe: 30-second chart.
Purpose: Automated signal generation for discretionary or algorithmic trading, with robust risk management and backtesting support.
Notable Customization & Extension Points
Momentum Calculation: Plans to replace the current momentum measure with "sqz momentum".
Displacement Logic: Future update to use "FVG concept" for displacement.
High-Contrast RSI: Optional visual enhancements for RSI extremes.
Time-based Stop: Consideration for adding a time-based stop mechanism.
This script is highly modular, with extensive user controls, and is suitable for both live trading and historical analysis of Dow Jones index movements

cd_cisd_market_CxHi Traders,
Overview:
Many traders follow market structure to identify the market direction and seek trade opportunities in line with the trend.
However, markings derived from user-defined inputs can create different structures, depending on personal choices. For instance, choosing a pivot distance of 3 instead of 2 alters the structure, even though the chart remains the same. Ideally, the structure should remain consistent.
"Change in State Delivery" ( CISD ) is a widely accepted concept among traders and is considered a significant indicator of market direction based on the gain/loss of CISD levels.
In this indicator, CISD is selected as the primary criterion for marking market structure, eliminating the influence of user-dependent variations.
Here is a summary of the key logic and rules applied:
• When the price forms a new high/low, that level is only considered a pivot if a CISD has occurred.
• A bullish CISD is always followed by a bearish CISD, and vice versa.
• Pivot points form the internal structure.
• The internal structure is used to interpret the swing structure.
• Probabilities are derived from internal structure patterns.
________________________________________
Details:
How is CISD determined?
As is commonly known:
• When price makes a new high, the opening level of the first candle in the consecutive bullish candle sequence is marked.
• When price makes a new low, the opening of the first candle in the consecutive bearish sequence is marked.
• If there’s only one candle in the sequence, its opening level is used.
In a bullish market, losing a bearish CISD level (i.e., a close below it) or in a bearish market, gaining a bullish CISD level (i.e., a close above it) is interpreted as a potential shift in buyer-seller dominance and a possible market reversal.
________________________________________
How are internal (pivot) levels determined?
• When price closes below a bearish CISD level, the highest candle's high becomes a pivot high (PH).
• When price closes above a bullish CISD level, the lowest candle's low becomes a pivot low (PL).
• If the new PH is above the previous PH, it’s labeled as HH (Higher High); otherwise, LH (Lower High).
• If the new PL is below the previous PL, it’s labeled as LL (Lower Low); otherwise, HL (Higher Low).
________________________________________
Internal Market Structure:
• A series of HHs indicates a bullish internal structure.
• A series of LLs indicates a bearish internal structure.
________________________________________
Swing (Main) Market Structure:
Using internal pivots and previous swing levels, the main market structure is derived.
• A new swing high (SH) requires the price to move above the previous SH.
• A new swing low (SL) requires the price to move below the previous SL.
________________________________________
Probability Calculation:
Pivot levels forming the internal structure are coded as five-element sequences.
There are 64 possible combinations of such sequences made from consecutive PH and PL values.
Each pattern’s frequency from its starting candle is tracked.
To make it more understandable:
For example, after the four-sequence “HH, LL, LH,HL”, either HH or LH might follow.
The table shows the statistical likelihood of both possible outcomes for the most recent four-element sequence on the chart.
________________________________________
How reliable is it?
To assess reliability, results are calculated from the beginning using:
Success Rate (Suc. Rt) = Number of Correct Predictions / Total Predictions
This value is added to the table for reference.
It’s important to note that no statistical outcome guarantees certainty—every result offers a different interpretation. What truly matters is to avoid getting stopped out 😊.
________________________________________
Menu Options:
Show/hide preferences and color selections can be customized via the indicator menu.
________________________________________
What’s Coming in Future Versions?
Features such as FVG (Fair Value Gaps) between swing levels, volume imbalances, order blocks / mitigation blocks, Fibonacci levels, and relevant trade suggestions will be added.
________________________________________
This is a BETA version that I believe will help simplify your market reading. I’d be happy to hear your feedback and suggestions.
Cheerful Trading!

Trend Blend
Trend blend is my new indicator. I use it to identify my bias when trading and filter out fake setups that are going in the wrong direction.
Trend blend utilises the 9 EMA (Red), 21 EMA (Black), and if you trade futures or Bitcoin, you can also use the VWAP (Blue).
There is also a table at the top right that displays the chart time frame bias
I prefer to use the 1-hour time frame for bias and execute the trades on 5-minute charts, mainly, and sometimes on the 1-minute for a smaller stoploss.
Here's an example of the trade I took during the London session on XAU/USD
1 hour bias was Bearish
Price broke out of the range
I waited for the London session to open, where I ended up taking a short on the 5-minute time frame as we broke out of the pre-London range
Entry was at the Fair Value Gap (5-minute bias was also Bearish as price traded into the FVG)
Stoploss was at the last high
Take Profit was the next major support level
Another set that I like to trade with the Trend blend is when price is trending bullish and price trades inside the 9 and 21 EMA, and there is a bullish candle closer above the 9 EMA with Stoploss below the low of the bullish candle and Take profit between 1-2 Risk to Reward
Same when there's a bearish trend, I wait for price to trade inside the 9 and 21 EMA, and I'll take sells when a bearish candle closes below the 9 EMA.
This setup works best in strong trends, or it can be used to enter a trade on a pullback or to scale into an existing trade.

Adjustable Vertical LinesThe script provides an indicator which will plot lines - 15 min, 30 min and 60 min. You can customize the time intervals and go to as low as one minute, but I found the 15-minute and 30-minute intervals works best for me when trying to find setups, and the lower time-frame intervals, is just pointless to use if you're not scalping on the seconds timeframe.
You can customize inputs for the line style. Line thickness, colour, etc.
I've seen this work using the OBR theory and applying it to the one-minute candle then looking for other confluences like order blocks, or breakers, FVGs, BOS/CHoC for further confirmation for scalping. It's important to backtest though and see for yourself.
Thanks for the boost.

BVB dominance bars
Hello everyone, this is my first indicator. these candles shows you who's in control. I like to think its some what close to heikin ashi candles as it shows you the Trend but doesn't average it out. also shows you when there is indecision. please read the instructions on how it works. its not a stand alone strategy. but adds value to your own strategy.
📖 How It Works
The BvB Dominance Bars indicator is a visual tool that colors candles based on market control—whether bulls or bears are in charge. It uses a custom metric comparing the price's relationship to a smoothed moving average (EMA), then normalizes that difference over time to express relative bullish or bearish pressure.
Here’s the breakdown:
Bulls vs Bears Logic:
A short-term EMA (default: 14-period) is used to establish a midpoint reference.
Bull Pressure is calculated as how far the high is above this EMA.
Bear Pressure is how far the low is below this EMA.
These are normalized over a lookback period (default: 120 bars) to produce percentile scores (0–100) for both bulls and bears.
Dominance & Color Coding:
The indicator compares normalized bull and bear scores.
Candles are color-coded based on:
Bright Lime: Strong Bull Dominance (with high confidence)
Soft Lime/Yellow: Moderate Bull Control
Bright Red: Strong Bear Dominance
Soft Red/Yellow: Moderate Bear Control
Gray: Neutral/Low conviction
Optional Live Label:
A small floating label shows who has control: “Bull Control,” “Bear Control,” or “Neutral.”
🧠 How to Use It (Example Strategy)
The BvB Dominance Bars indicator is not a standalone buy/sell signal but a market sentiment overlay. It’s most effective when combined with your own strategy, like price action or trend-following tools.
Here’s an example use case:
🧪 Reversal Confirmation Strategy
Objective: Catch high-probability reversals during key kill zones or supply/demand levels.
Setup:
Mark your key support/resistance zones using your standard method (e.g., FVGs, liquidity sweeps, or ICT PD arrays).
Wait for price to reach one of these zones.
Watch candle colors from the BvB Dominance Bars:
If you expect a bullish reversal, wait for a transition from red/gray candles to lime green or bright lime (bullish dominance taking over).
If you expect a bearish reversal, look for a change from green/gray to red or bright red.
Entry Filter:
Only enter if the dominant color holds for 2+ candles.
Avoid trades when candles are gray or yellow (indecision/neutral).
Exit Option:
Exit if dominance shifts against you (e.g., from lime to red), or use structure-based stops.
⚙️ Settings You Can Adjust:
BvB Period: Controls how fast EMA responds.
Bars Back: Determines how long the normalization looks back.
Thresholds: Influence how strong the dominance must be to change candle color.
✅ Best Used When:
You already have a bias and just want a confirmation of sentiment.
You're trading intraday and want a feel for shifting momentum without relying on noisy indicators.
You want a clean, color-coded overlay to help filter out fakeouts and indecision.

SMC ICT – Simplified Daily Trend & Reversal AnalyzerThis Pine Script provides a simplified approach to analyzing daily trends and potential reversals using concepts inspired by Smart Money Concepts (SMC) and ICT (Inner Circle Trader).
What It Does:
• Detects daily uptrend and downtrend conditions by comparing the current daily high/low to the previous day’s values.
• Highlights potential bullish or bearish reversal zones when price behavior suggests a shift in sentiment.
• Automatically draws dashed lines for the previous day's high and low.
• Labels these high/low levels for quick visual reference.
How to Use:
Apply this indicator to any timeframe chart. Use the plotted trend markers to assess daily direction and potential reversal signals. The dashed lines (previous high/low) can be used as reference points for liquidity zones or break/retest entries.
User Interface:
The indicator displays labels and shapes in English. This script is intended for educational and trading workflow enhancement purposes.
Note:
This is an open-source tool designed for clarity and basic SMC/ICT application. It is best used in combination with other confluences like FVGs, order blocks, and liquidity sweeps.

The ICT Ultimate Grid | MarketMaverisk GroupThe ICT Ultimate Grid | MarketMaverisk Group
This script is a fully customizable checklist based on ICT (Inner Circle Trader) concepts. It helps traders validate entry conditions across three timeframes:
LTP (Long-Term), ITP (Intermediate-Term), and STP (Short-Term).
⸻
✅ Purpose & Utility:
Instead of generating simple buy/sell signals, this tool assists traders in making structured, confirmation-based decisions. It presents a visual checklist with 11 customizable columns—each can be individually toggled for each timeframe and displays ✅ or ❌ confirmation status.
⸻
🧠 Confirmation Structure:
The checklist covers the following core elements from the ICT methodology:
• ERL⇔IRL and IRL⇔ERL (presented as special confirmations below the table)
• DOL – Drow On liqudity Level
• PD – permium or discuant
• SMT – Smart Money Trap / Inter-market Divergence
• CSD – Change in State of dlivery
• MSS – Market Structure Shift
• MMXM – Market maker (buy or sell) model
• FVG – Fair Value Gap
• OB – Order Block
• BRK.B – breker Block
Each item can be enabled or disabled for LTP, ITP, and STP individually.
⸻
📊 Visual Design:
• Clean, compact table displayed in the top-right corner of the chart.
• Clear color scheme (✅ Green = Confirmed, ❌ Red = Not Confirmed, Grey = Hidden/Disabled).
• Timeframes are stacked row-wise (LTP, ITP, STP).
• Inputs allow fine-grained control over what elements are shown in each timeframe.
• Additional rows are used to confirm:
• HTF Key Level
• Direction: Reversal ↩️ or Continuation 🔂
• Bias: Bullish 🔼 or Bearish 🔽
⸻
📈 Use Case:
This tool is ideal for traders who follow:
• ICT-based trading approaches
• Market structure + Liquidity analysis
• Day trading, scalping, or swing setups
• Confirmation-based entries after higher-timeframe alignment
⸻
⚙️ Recommended Timeframe Settings:
• LTP = D1 or 4H
• ITP = 1H or 15min
• STP = 5min or 3min or 1min
• Session time: Best used between 02:00 and 05:00 on london killzone & 08:00 and 12:00 on New york killzone in New York timezone (UTC -5)
(you can customize this in strategy version)
⸻
🛠 Technical Note:
This version is an indicator and does not generate signals or alerts by itself. For full automation, a strategy version is also available upon request.
⸻
Let me know if you’d like me to also write a “strategy description” or help you prepare the public chart layout 📊 to make your publish clean and attractivE

CRT Finder (WanHakimFX)📈 Liquidity Grab Indicator with MTF Confluence & Alerts
🔍 Overview:
The Liquidity Grab Indicator is designed to detect precise moments when price sweeps liquidity — either by wicking below recent lows (bullish LQH) or above recent highs (bearish LQL) — followed by a clear rejection. It combines this logic with multi-timeframe confirmation and trend filters, making it a powerful tool for identifying high-probability reversal setups.
⚙️ How It Works:
✅ Liquidity Sweep Logic (LQH / LQL)
Bullish (LQH):
Current candle wicks below the previous low
Closes above the previous candle body
Confirms potential bullish reversal
Bearish (LQL):
Current candle wicks above the previous high
Closes below the previous candle body
Confirms potential bearish reversal
✅ Additional Conditions:
Must occur during London or New York sessions.
Requires trend confluence:
LQH = Price must be above SMMA 60/100/200
LQL = Price must be below SMMA 60/100/200
🧠 Multi-Timeframe Confluence:
The indicator scans for LQH/LQL sweeps across:
Daily
4H
1H
30M
15M
If a sweep occurs on any of these timeframes, an alert is triggered and a triangle marker appears on the chart for real-time visual confluence.
📊 Visual Features:
Green/Red labels for active timeframe sweeps.
Dotted wick lines to show liquidity zones from the previous candle.
Colored triangle markers for MTF sweep alerts.
🛠 Strategy Usage:
This indicator is best used as a trigger tool in a confluence-based strategy:
Use higher-timeframe MTF LQH/LQL markers for directional bias.
Wait for matching sweep on your entry timeframe (e.g., M1/M5).
Enter on confirmation candle or break of structure.
Target imbalances, FVGs, or previous highs/lows.
Risk-managed entries using sweep candle's high/low as stop.
📢 Alerts:
✅ Bullish Sweep (LQH) on any timeframe
✅ Bearish Sweep (LQL) on any timeframe

[TTM] ICT Sessions & Ranges🌟 Overview 🌟
The ICT Sessions & Ranges Indicator helps traders identify key intraday price levels by marking custom session highs/lows and opening ranges.
It helps traders spot potential liquidity grabs, reversals, and breakout zones by tracking price behavior around these key areas
🌟 Session Highs & Lows – Liquidity Zones 🌟
Session highs and lows often attract price due to stop orders resting above or below them. These levels are frequently targeted during high-volatility moves.
🔹 Asia Session
- Usually ranges in low volatility.
- Highs/lows often get swept during early London.
- Price may raid these levels, then reverse.
🔹 London Session
- First major volatility of the day.
- Highs/lows often tested or swept in New York.
- Commonly forms the day’s true high or low.
🌟 Opening Range Concepts 🌟
The Opening Range is the first 15, 30, or 60 minutes of a session (e.g., New York).
The high (ORH) and low (ORL) define the market’s initial balance and key reaction levels.
🔹 Breakout Trade
- Price breaks ORH/ORL with momentum.
- Signals directional intent.
- Traders enter on the breakout, with stops inside the range.
🔹 Liquidity Raid
- Price briefly breaks ORH/ORL to trigger stops.
- Reverses after the sweep.
- Look for structure shift and entry near FVG or OB.
🌟 Customizable Settings 🌟
The indicator includes 3 configurable ranges , each with:
Start & End Time – Set any custom time window.
Display Type – Choose Box (highlight range) or Lines (mark high/low).
Color Settings – Set custom colors for boxes and lines.
🌟 Default Settings 🌟
Range 1 : 19:00–00:00 (Asia Session)
Range 2 : 01:45–05:15 (London Session)
Range 3 : 09:30–10:00 (NY Opening Range – 30m)

Change in State of Delivery (CISD) [SB Instant]🧠 Modified by SB | Core Logic by LuxAlgo
🔗 Licensed under CC BY-NC-SA 4.0
Change in State of Delivery (CISD) is a concept rooted in observing shifts in order flow behavior, designed to detect the first signs of trend exhaustion and potential reversal. This model tracks when the current delivery (trend) structure — bullish or bearish — is violated by an opposing force, signaling a potential change in market intent.
In simple terms:
A Bullish CISD is triggered when sellers fail to maintain control, and buyers break above a delivery line.
A Bearish CISD is triggered when buyers fail, and sellers break below a delivery line.
This version uses real-time logic, triggering alerts immediately on break, rather than waiting for candle-close confirmation — giving faster, actionable signals to precision-driven traders.
⚙️ Core Features
Detection Modes
Classic: Traditional swing-based structural break detection
Liquidity Sweep: Logic incorporating wick sweeps (liquidity grabs)
Custom Parameters
Swing Length: Number of candles used to identify swing points
Minimum CISD Duration: Minimum length required for valid delivery phase
Maximum Swing Validity: How long the structure remains valid for potential breaks
Visual Options
Label and line styling options
Solid line = Initial break of delivery structure
Dashed line = Continuation break in the same trend direction
This allows you to visually differentiate a new reversal vs. a continuation of the existing trend.
🚨 Built-in Alerts
Bullish CISD Detected (Instant)
Bearish CISD Detected (Instant)
These alerts fire immediately when structure is broken, offering early confirmation for aggressive or reactive trade setups.
🔔 IMPORTANT:
If an alert triggers but the delivery line is not present, wait for the price to form the CISD label again and manually mark the price level using a horizontal ray. This ensures you are trading from a clearly defined structure.
🕒 Recommended Timeframes
✅ Use 30-Minute or 4-Hour charts to identify high-confidence CISD zones
🎯 Then drop to the 1-Minute or 5-Minute chart for precise entry execution
This top-down approach aligns higher timeframe narrative with lower timeframe entry triggers, increasing your edge in both timing and context.
🧠 How to Use CISD Effectively
Bullish Scenario:
Watch for breaks above bearish delivery structures, especially if confirmed with:
Fair Value Gaps (FVG)
The Strat 2-2 reversal
MSS (Market Structure Shift)
Bearish Scenario:
Look for breaks below bullish delivery setups in alignment with:
BOS (Break of Structure)
The Strat 3-1-2
Bearish liquidity sweeps
Key Tip:
Solid line = Initial CISD (new shift)
Dashed line = Continuation of current trend
This visual distinction helps you determine when a market is shifting vs. extending.
📎 Disclaimer
This tool is provided for educational purposes only and is not intended as financial advice. Always backtest, paper trade, and manage risk responsibly.
📚 Credits
Original CISD framework developed by LuxAlgo
Real-time execution logic, alert enhancements, and intraday utility designed by SB (SamB)

Whale Psychology Insights
### 🧠 Whale Psychology Insights – Unmasking Smart Money Moves
**Understand the mind games behind every candle.**
This advanced indicator is designed to reveal the psychological warfare played by whales and market manipulators in the crypto space. Stop trading blind—start trading with the insights of the smart money.
#### 🔍 What It Does:
- **Liquidity Zone Detection** – Automatically identifies key **swing highs/lows** where stop hunts are likely.
- **Volume Spike Alerts** – Spot **suspicious activity** where big players enter or exit.
- **Order Block Zones** – Highlights **bullish/bearish engulfing patterns** used by institutions.
- **Fair Value Gaps (FVG)** – Marks price inefficiencies where price may return.
- **Fakeout Detection** – Finds **manipulative wicks** designed to trap retail traders.
#### 💡 Use Cases:
- Avoid getting stopped out by **liquidity grabs**
- Enter after the **whales have made their move**
- Identify **high-probability reversal zones**
- Trade **with smart money**, not against it
Perfect for scalpers, intraday traders, and swing traders looking to understand *why* price moves—not just *where*.
> 🧠 **Trade the psychology, not just the chart.**

ICT SMC Liquidity Grabs and OBsICT SMC Liquidity Grabs + Order Blocks + Fibonacci OTE Levels
A High-Probability Entry Engine for Smart Money Concept Traders
This script combines three powerful Smart Money Concepts (SMC) into a single tool: Liquidity Grabs, Order Block Zones, and Fibonacci OTE Levels, allowing traders to identify institutional entry models with clean, rule-based visual signals.
It’s designed to simplify SMC trading by highlighting confluence zones where price is likely to reverse or continue — with clear visual zones, entry arrows, and take profit projections.
🔍 What This Script Does:
Detects Liquidity Grabs
Identifies when price sweeps above/below the highest high or lowest low within a user-defined lookback period and closes back inside.
Plots orange labels on the chart to signal potential liquidity events (LG-H / LG-L).
Plots Order Blocks After Liquidity Grabs
After a liquidity grab, the script looks for displacement candles (strong bullish or bearish moves) and draws highlighted OB zones extending several bars to the right.
These zones represent potential institutional footprints for price reversals.
Draws Fibonacci OTE Levels (Optimal Trade Entry)
Uses recent swing high and low pivots to automatically calculate OTE zones (default: 62% and 75% retracement levels).
Draws these retracement zones for both bullish and bearish setups.
Marks Valid OTE Entry Zones
Buy/Sell zones only trigger when:
A liquidity grab occurs,
Price enters the OTE zone,
And a strong confirming candle is present.
Plots green/red arrows for valid buy/sell OTE entries.
Auto-Draws Take Profit Zones
TP1 = Previous swing high/low
TP2 = Risk-based R-multiplied extension (e.g., 1.5R — customizable)
Alerts
Triggers alerts when valid buy or sell OTE setups are detected.
⚙️ Customization Features:
Toggle each feature: Liquidity Grabs, Order Blocks, Fibonacci OTE levels
Set Fibonacci retracement percentages (e.g., 0.62 / 0.75)
Adjust lookback window for liquidity detection
Customize the take-profit multiplier (R-based)
Full control over visuals: colors, labels, and lines
💡 How to Use:
Use this script to scan for high-confluence trade setups based on Smart Money principles.
Combine with session timing (e.g., New York open), major swing structure, or Kill Zone windows for maximum edge.
Look for arrows inside OB zones or OTE levels following liquidity sweeps for cleaner entries.
🔗 Works Best With:
✅ First FVG — Opening Range Fair Value Gap Detector: Identify early inefficiencies to set the narrative for the day.
✅ Liquidity Levels — Smart Swing Lows: Spot key structural lows that can fuel stop hunts and reversals.
✅ ICT Turtle Soup — Liquidity Reversal: Add a classic reversal pattern to your toolkit to catch fakeouts cleanly.
Together, these tools build a complete Smart Money ecosystem for entry precision, risk management, and price behavior forecasting.

Liquidity Levels (Smart Swing Lows)Liquidity Levels — Smart Swing Low Detection
Efficient Liquidity Sweep Visualization for Smart Money Traders
This script automatically identifies and plots liquidity-rich swing lows based on pivot logic, filters them to remove redundant levels, and overlays daily highs/lows for added context — giving Smart Money Concept (SMC) traders a clean, actionable map of liquidity.
It’s designed to be minimal yet powerful: perfect for spotting potential liquidity grabs, mitigation zones, and sweep targets with zero chart clutter.
🔍 What This Script Does:
Detects Smart Swing Lows
Uses fixed pivot detection (left = 3, right = customizable) to identify structurally significant swing lows.
Filters out swing lows that are too close together using a percentage-based spacing threshold to reduce noise.
Mitigation Cleanup Logic
Tracks whether recent price action breaches past swing lows.
If breached, the swing level is automatically removed, keeping only relevant, unmitigated liquidity levels on your chart.
Plots Daily Highs and Lows
Each new trading day, horizontal rays mark the prior day’s high and low — useful for identifying resting liquidity and possible sweep zones.
Labeling and Style Customization
Optional labels for swing lows.
Full control over label size, color, and visibility to match any chart aesthetic.
Timeframe Filtering
Runs exclusively on 5m, 10m, and 15m charts to ensure optimal reliability and signal clarity.
⚙️ Customization Features:
Pivot sensitivity (Right side control)
Minimum distance between swing lows (in %)
Label visibility, size, and color
Line width and colors for both swing levels and daily highs/lows
Mitigation cleanup lookback length
💡 How to Use:
Add the script to a qualifying intraday chart (5–15m).
Use the swing low levels to monitor liquidity-rich zones.
Combine with your personal strategy to identify liquidity grabs, potential reversal zones, or entry points following a sweep.
Let the built-in cleanup logic remove any already-mitigated levels so you can focus on active targets.
🚀 What Makes It Unique:
This isn’t just another pivot plotter — it’s a smart, self-cleaning SMC tool designed for modern liquidity-based trading strategies.
A must-have for traders using concepts like liquidity grabs, mitigation blocks, or sweep-to-reverse trade models.
🔗 Best used in combination with:
✅ First FVG — Opening Range Fair Value Gap Detector: Pinpoint the day’s first imbalance zone for intraday setups.
✅ ICT SMC Liquidity Grabs + OB + Fibonacci OTE Levels: Confluence-based entries powered by liquidity logic, order blocks, and premium/discount zones.
Used together, these scripts form a complete Smart Money toolkit — helping you build high-probability setups with confidence, clarity, and clean charts.

Climax Volume FilterThis script helps filter out volume spikes caused by sudden market events (e.g. CPI, FOMC), which can distort volume-based analysis.
It identifies and optionally smooths or excludes high “climax” candles to provide a clearer view of natural volume trends during pullbacks and consolidations.
Use it to:
• Avoid misreading volume during news events
• Improve your reading of exhaustion vs. continuation
• Support better entry timing during flag or FVG setups
Wick Sweep EntriesWick Sweep Entry designed by Finweal Finance (Indicator Originator : Prajyot Mahajan) :
This Indicator is specially designed for Nifty, Sensex and Banknifty Options Buying. This works well on Expiry Days.
Setup Timeframe : 5m and 1m.
Entry Criteria :
For Long/CE :
Wait for Sweep of 5m Candle Low with next 5m Candle but you do not wait for the next 5 minute candle to close, you enter directly whenever any 1 minute candle of next 5minute candle to close above the low of previous 5m Candle.
For Short/PE :
Wait for Sweep of 5m Candle High with next 5m Candle but you do not wait for the next 5 minute candle to close, you enter directly whenever any 1 minute candle of next 5minute candle to close below the High of previous 5m Candle.
Key notes :
1. As this is the Scalping High Frequency Strategy, it is to be used for scalping purpose only. You might have losses too so to avoid the noise in the market, i suggest you to use this strategy in the first 45 minutes to 1 hour of Indian Markets as this is a volatility Strategy.
2. Although Nifty and Banknifty are independent indices, they still show some reactions with each other, so if you spot a long entry on BNF and Short Entry on nifty then you will avoid taking the trade, you will take the trade only if there is a tandem activity or At least the other index is not showing opposite signal.
3. If target is not hit and you spot another entry, you will avoid taking the new entry.
The Indicator will automatically spot/plot the entry signal, all you need to do is enter as soon as 1minute candle closes either below prior 5 minute candle High for Short/PE or closes above 5minute low for Long/CE.
For Targets :
You Can Target recent minor pull back, FVG, or Order blocks.
Remember : This is a scalping strategy so don't hold trade for more than 4/5 1minute Candles

Consecutive CandlesSummary
This indicator helps visualize short-term momentum by automatically drawing boxes around sequences of consecutive same-colored candles (bullish or bearish). It's designed to quickly highlight periods of sustained buying or selling pressure directly on your chart.
How it Works
Consecutive Candle Detection: The script monitors the chart bar by bar, tracking consecutive candles where close > open (bullish) or close < open (bearish).
Box Drawing: When a sequence of same-colored candles reaches a user-defined minimum length (default is 3) and this sequence is then broken by an opposite-colored candle or a doji, a box is drawn.
Box Boundaries:
The top of the box is set to the highest high price reached during the sequence.
The bottom of the box is set to the lowest low price reached during the sequence.
The left edge of the box aligns with the start time of the first candle in the sequence.
The right edge of the box aligns with the end time of the last candle in the sequence.
Stability: Uses xloc = xloc.bar_time to ensure boxes remain accurately anchored to the price bars when zooming or panning the chart.
Real-time Extension: For active sequences meeting the minimum length on the latest developing bar, the box is optionally extended to the right.
Features
Automatically identifies and boxes sequences of 3 or more (customizable) consecutive bullish candles.
Automatically identifies and boxes sequences of 3 or more (customizable) consecutive bearish candles.
Extends box in real-time for active qualifying sequences.
Customizable minimum candle count (>= 2).
Customizable colors for bullish/bearish boxes and borders.
Settings
You can customize the indicator via the Settings menu (gear icon):
Minimum Consecutive Candles: Define how many candles in a row are needed to draw a box (Default: 3).
Bullish Box Color: Set the fill color for boxes around bullish sequences.
Bearish Box Color: Set the fill color for boxes around bearish sequences.
Box Border Color: Set the color for the border of all boxes.
Potential Use Cases
Momentum Identification: Quickly spot periods of strong, uninterrupted buying or selling.
Exhaustion/Reversal Signals: Very long sequences might indicate potential exhaustion, setting up reversal opportunities.
Consolidation Breakouts: A box forming after a period of tight consolidation can highlight the range just before a potential breakout.
Confirmation: Use the boxes as confirmation for entries or exits based on momentum shifts.
Disclaimer: This indicator provides visual aids based on price action. It should not be used as a standalone trading system. Always use indicators in conjunction with your own analysis and risk management rules.

Engulfing Sweeps - Milana TradesEngulfing Sweeps
The Engulfing Sweeps Candle is a candlestick pattern that:
1)Takes liquidity from the previous candle’s high or low.
2)Fully engulfs previous candles upon closing.
3)Indicates strong buying or selling pressure.
4)Helps determine the bias of the next candle.
Logic Behind Engulfing Sweeps
If you analyze this candle on a lower timeframe, you’ll often see popular models like PO3 (Power of Three) or AMD (Accumulation – Manipulation – Distribution).
Once the candle closes, the goal is to enter a position on the retracement of the distribution phase.
How to Use Engulfing Sweeps?
Recommended Timeframes:
4H, Daily, Weekly – these levels hold significant liquidity.
Personally, I prefer 4H, as it provides a solid view of mid-term market moves.
Step1 - Identify Engulfing Sweep Candle
Step 2-Switch to a lower timeframe (15m or 5m).And you task identify optimal trade entry
Look for an entry pattern based on:
FVG (Fair Value Gap)
OB (Order Block)
FIB levels (0/0.25/0.5/ 0.75/ 1)
Wait for confirmation and take the trade.
Automating with TradingView Alerts
To avoid missing the pattern, you can set up alerts using a custom script. Once the pattern forms, TradingView will notify you so you can analyze the chart and take action. This approch helps me be more freedom

CandelaCharts - Liquidity Key Zones (LKZ)📝 Overview
The Liquidity Key Zones indicator displays the previous high and low levels for daily, weekly, monthly, quarterly, and yearly timeframes. These levels serve as crucial price zones for trading any market or instrument. They are also high-probability reaction zones, ideal for trading using straightforward confirmation patterns.
Each of these levels plays a significant role in determining whether the market continues its momentum or reverses its bias. I like to think of these levels as dual magnets—they simultaneously attract and repel price. You might wonder how having opposing views can be useful. The key is to remain neutral about direction and establish your own rules to identify when these zones are likely to attract or repel price. I have my own set of rules, and you can develop yours.
📦 Features
MTF
Styling
⚙️ Settings
Day: Shows previous day levels
Week: Shows previous week levels
Month: Shows previous month levels
Quarter: Shows previous quarter levels
Year: Shows previous year levels
Show Average: Shows previous level average price
Show Open: Shows previous level open price
⚡️ Showcase
Daily
Weekly
Monthly
Quarterly
Yearly
Average
Open
📒 Usage
When the price breaks through a significant level, such as a daily, weekly, or monthly high or low, it often signals a potential reversal in market direction. This occurs because these levels represent key areas of support or resistance, where traders anticipate heightened activity, including profit-taking, stop-loss orders, or new positions being initiated.
Once the price breaches these levels, it may trigger a sharp reaction as market participants adjust their strategies, leading to a reversal. Monitoring price action and volume around these levels can provide valuable confirmation of such reversals.
Another effective approach to utilizing these pivot points is by incorporating them into a structured trading strategy, such as the X Model, which leverages multiple timeframes and technical tools to refine trade entries and exits.
X Model conditions:
(D1) Previous Day High (ERL)
(H1) Bullish FVG/IFVG/OB (IRL)
(m15) MSS / SMT
Only Short Above 00:00
By combining these elements, the X Model offers a comprehensive framework for leveraging pivot levels effectively, emphasizing confluence between liquidity zones, time-based rules, and multi-timeframe analysis to enhance trading accuracy and consistency.
🚨 Alerts
This script provides alert options for all signals.
Bearish Signal
A bearish signal is generated when the price breaks below the previous low level.
Bullish Signal
A bullish signal is generated when the price breaks above the previous low level.
⚠️ Disclaimer
Trading involves significant risk, and many participants may incur losses. The content on this site is not intended as financial advice and should not be interpreted as such. Decisions to buy, sell, hold, or trade securities, commodities, or other financial instruments carry inherent risks and are best made with guidance from qualified financial professionals. Past performance is not indicative of future results.
