Position Size CalculatorThe provided Pine Script is a custom indicator titled "Position Size Calculator" designed to assist traders in calculating the appropriate size of a trading position based on predefined risk parameters. This script is intended to be overlaid on a trading chart, as indicated by `overlay=true`, allowing traders to visualize and adjust their risk and position size directly within the context of their trading strategy.
What It Does:
The core functionality of this script revolves around calculating the position size a trader should take based on three input parameters:
**Risk in USD (`Risk`)**: This represents the amount of money the trader is willing to risk on a single trade.
**Entry Price (`EntryPrice`)**: The price at which the trader plans to enter the market.
**Stop Loss (`StopLoss`)**: The price at which the trader plans to exit the market should the trade move against them, effectively limiting their loss.
The script calculates the position size using a function named `calculatePositionSize`, which performs the following steps:
It first calculates the `expectedLoss` by taking 90% (`0.9`) of the input risk. This implies that the script factors in a safety margin, assuming traders are willing to risk up to 90% of their stated risk amount per trade.
It then calculates the position size based on the distance between the Entry Price and the Stop Loss. This calculation adjusts based on whether the Entry Price is higher or lower than the Stop Loss, ensuring that the position size fits the risk profile regardless of trade direction.
The function returns several values: `risk`, `entryPrice`, `stopLoss`, `expectedLoss`, and `size`, which are then plotted on the chart.
How It Does It:
**Expected Loss Calculation**: By reducing the risk by 10% before calculating position size, the script provides a buffer to account for slippage or to ensure the trader does not fully utilize their risk budget on a single trade.
**Position Size Calculation**: The script calculates position size by dividing the adjusted risk (`expectedLoss`) by the price difference between the Entry Price and Stop Loss. This gives a quantitative measure of how many units of the asset can be bought or sold while staying within the risk parameters.
What Traders Can Use It For:
Traders can use this Position Size Calculator for several purposes:
- **Risk Management**: By determining the appropriate position size, traders can ensure that they do not overexpose themselves to market risk on a single trade.
- **Trade Planning**: Before entering a trade, the script allows traders to visualize their risk, entry, and exit points, helping them to make more informed decisions.
- **Consistency**: Using a standardized method for calculating position size helps traders maintain consistency in their trading approach, a key aspect of successful trading strategies.
- **Efficiency**: Automating the calculation of position size saves time and reduces the likelihood of manual calculation errors.
Overall, this Pine Script indicator is a practical tool for traders looking to implement strict risk management rules within their trading strategies, ensuring that each trade is sized appropriately according to their risk tolerance and market conditions.
스크립트에서 "entry"에 대해 찾기

Magnetic Zones v1.1 BetaMagnetic Zones v1.1 Beta
This is one of the most powerful and effective indicator which I personally use for Intraday.
It works well for trending stocks and trending days.
What are the Zones?
The zones are basically Retracement and Reversal Zones. The price will take a halt at this zones. So it will be easy to take an entry.
How to use?
Labels:
Pivot = P
Major Zones = R1, R2, R3, S1, S2, S3
Minor Zones = R0.5, R1.5, R2.5, S0.5, S1.5, S2.5
Previous Day High & Low = PDH, PDL
Breakout:
Opens between Previous Day High or Low and R1 or S1 Zone and taking retracement at the zone can result in a breakout.
Entry Time:
No Entry: 0 to 15min. Wait for the early Algo rush to settle down. Just go through the shortlisted stocks or top gainers and top losers.
Risky Entry: 15min to 30min. It is the right or early time to participate in the beginning of a rally. But, recommended only for experienced, disciplined and planned traders.
Moderate Risk: 30min to 45min
Safe Entry: After 45min to 1hr
Stock Selection Tip:
Use Expanded Floor Pivots to spot Narrow Range stocks.
Entry Tip:
Use Opening Range Breakout (15, 30, 45 or 1hr) to spot false shoot ups.
Entry:
After the retracement on or closer to the zones.
If the retracement happens in between spaces of the zones expect next retracement at the next in between space. Imagine the levels accordingly.
Retracement is the right time to make an entry with minimum stoploss.
Stoploss:
Just below the longest candle which touches the zone.
Target:
If it is a trending stock the price will move easily from one major zone to another major zone.
If the zones are wider on a particular day use the minor zones as target.
Consider the historical support and resistance, highs and lows to confirm the entry or exit.
Indicator Features:
Inclusion of 2nd and 3rd zones: Helpful to identify the target zone and to participation in a major rally.
Clean and cluster free look
Shows only required zones
Hide historical levels
Previous day High and Low levels
Multi time-frame
Caution:
Don't solely depend on this indicator. Always use this with other analyzing tools or methods for more confirmation.
Acknowledgement:
Thanking the original formulators.
Note:
The indicator is under testing. Any errors, updates and additions will be updated in the final version.
Even though there many are other indicators similar to this in TradingView, this indicator is customized for precision, inclusion of extended levels and designed for a squeeze free chart and visual appeal.
Explore, improvise and formulate new methods with your personal experience and ideas.

RunRox - Pairs Strategy🧬 Pairs Strategy is a new indicator by RunRox included in our premium subscription.
It is a specialized tool for trading pairs, built around working with two correlated instruments at the same time.
The indicator is designed specifically for pair trading logic: it helps track the relationship between two assets, identify statistical deviations, and generate signals for opening and managing long/short combinations on both legs of the pair.
Below in this description I will go through the core functions of the indicator and the main concepts behind the strategy so you can clearly understand how to apply it in your trading.
📌 CONCEPT
The core idea of pair trading is to find and trade correlated instruments that usually move in a similar way.
When these two assets temporarily diverge from each other, a trading opportunity appears.
In such moments, the relatively overvalued asset is sold (short leg), and the relatively undervalued asset is bought (long leg).
When the spread between them narrows and both instruments revert back toward their typical relationship (mean), the position is closed and the trader captures the profit from this convergence.
In practice, one leg of the pair can end up in a loss while the other generates a larger profit.
Due to the difference in performance between the two assets, the combined result of the pair trade can still be positive.
✅ KEY FEATURES:
2 deviation types (Z-Score and S-Score)
Invert signals mode
Hedge Coefficient (position size balancing between both legs)
6 hedge modes
Entries based on Score or RSI
Extra entries based on Score or Spread
Stop Loss
Take Profit
RSI Filter
RSI Pivot Mode
Built-in Backtester Strategy
Lower Timeframe Backtester Strategy
Live trade panel for current position
Equity curve chart
21 performance metrics in the backtester
2 alert types
*And many more fine-tuning options for pair trading
🔗 SCORE
Score is the core deviation metric between the two assets in the pair.
For example, if you are trading ETHUSDT/BTCUSDT, the indicator analyzes the relationship ETH/BTC, and when one leg temporarily diverges from the other, this difference is reflected in the Score value.
In other words, Score shows how much the current spread between the two instruments deviates from its typical state and is used as the main signal source for pair entries and exits.
In the screenshot above you can see how Score looks in our indicator.
Depending on how large the difference is between the two assets, the Score value can move in a range from −N to +N
When Score is in the −N zone, this is a 🟢 long zone for the first asset and a short zone for the second.
Using the ETH/BTC example: when Score is deeply negative, you open a long on ETH and a short on BTC at the same time, then close both legs when Score returns back to the 0 zone (balance between the two assets).
When Score is in the +N zone, this is a 🔴 short zone for the first asset and a long zone for the second.
In the same ETH/BTC example: when Score is strongly positive, you short ETH and long BTC, and again close both positions when Score comes back to the neutral 0 zone.
☯️ Z/S SCORE
Inside the indicator we added two different formulas for calculating the spread between the two legs of the pair: Z-Score and S-Score.
These approaches measure deviation in different ways and can produce slightly different signals depending on the chosen pair and its behavior.
This allows you to switch between Z-Score and S-Score and choose the method that gives more stable and cleaner signals for your specific instruments.
As you can see in the screenshot above, we used the same pair but applied different Score types to measure the spread and deviation from the norm.
🟣 Z-Score – generated 9 entry signals .
It reacts to price fluctuations more smoothly and usually stays within a range of approximately −8 to +8 .
🟠 S-Score – generated 5 entry signals .
It reacts to price changes more aggressively and produces wider deviations, often reaching −15 to +15 .
This gives traders the choice between a more sensitive but smoother model (Z-Score) and a more selective, stronger-deviation model (S-Score)
⁉️ HOW DOES THE STRATEGY WORK
Here is a basic example of how you can trade this pair trading strategy using our indicator and its signals.
In the classic approach the trade consists of one initial entry and several scale-ins (averaging) if the spread continues to move against the position.
The first entry is opened when Score reaches a standard deviation of −2 or +2.
If price does not revert to the mean and moves further against the position so that Score expands to −3 or +3, the strategy performs the first scale-in.
If Score extends to −4 or +4, a second scale-in is added.
If the spread grows even more and Score reaches −5 or +5, a third scale-in is executed.
In our indicator the number of averaging steps can be up to 4 scale-ins .
After that the position waits until Score returns back to the 0 level , where the whole pair position is closed.
This is the standard model of classical pair trading.
However there are many variations:
using Stop Loss and Take Profit,
exiting earlier or later than the 0 zone,
scaling in not by Score but by Spread, since Score is not linear while Spread is linear,
entering when RSI on both tickers shows opposite extremes, for example RSI 20 on one asset and RSI 80 on the other, and so on.
The number of possible trading styles for this strategy is very large.
We designed the indicator to cover as many of these variations as possible and added flexible tools so you can build your own pair trading logic on top of it.
Below is an example of a classic pair trade with two entries: one main entry and one extra entry (scale-in) .
The pair SUIUSDT / PENGUUSDT shows a high correlation, and on one of the trades the sequence looked like this:
A −2 Score deviation occurred into the long zone and triggered the Main Entry .
🔹 Main Entry
Long SUIUSDT – Margin: 5,000 USD, Entry price: 1.5708
Short PENGUUSDT – Margin: 5,000 USD, Entry price: 0.011793
Price then moved further against the position, Score went deeper into deviation, and the strategy added one extra entry.
🔸 Extra Entry
Long SUIUSDT – Margin: 5,000 USD, Entry price: 1.5938
Short PENGUUSDT – Margin: 5,000 USD, Entry price: 0.012173
The trade was closed when Score reverted back toward the 0 zone (mean reversion of the spread):
❎ Exit
SUIUSDT P&L: −403.34 USD, Exit price: 1.5184
PENGUUSDT P&L: +743.73 USD, Exit price: 0.011089
✅ Total P&L: +340.39 USD
With a total margin of 10,000 USD used per side (20,000 USD combined), this trade yielded around +1.7% on the deployed margin.
On different assets the size and speed of the spread movement will vary, but the principle remains the same.
This is just one example to illustrate how the strategy works in practice using simplified theoretical balances.
⚙️ MAIN SETTINGS
After explaining how the strategy works, we can move to the indicator settings and their logic.
The first block is Main Settings, which controls how the pair is built, how the spread is calculated, and how the backtest is performed.
The core idea of the indicator is to backtest historical data, generate entry signals, show open-position parameters, and provide all necessary metrics for both discretionary and algorithmic trading.
This is a complete framework for analyzing a pair of assets and building a trading system around them. Below I will go through the main parameters one by one.
🔹 Exclude Dates
Allows you to exclude abnormal periods in the pair’s history to remove outlier trades from the backtest.
This is useful when the market experienced extreme news events, listing spikes, or other non-typical situations that distort statistics.
🔹 Pair
Here you select the second asset for your pair.
For example, if your main chart is BTCUSDT, in this field you choose a correlated asset such as ETHUSDT, and the working pair becomes BTCUSDT / ETHUSDT.
The indicator then calculates spread, Score, and all related metrics based on this asset combination.
🔹 Lower Timeframe
This is a special mode for backtesting on a lower timeframe while using a higher timeframe chart to extend the history limit.
For example, if your TradingView plan provides only 5,000 bars of history on the current timeframe, you can switch your chart to a higher timeframe and select a lower timeframe in this setting.
The indicator will then reconstruct the pair logic using up to 99,000 bars of lower timeframe data for backtesting.
This allows you to test the pair on a much longer historical period and find more stable combinations of assets.
🔹 Method
Here you choose which deviation model you want to use: Z-Score or S-Score.
Both methods calculate spread deviation but use different formulas, which can give different signal behavior depending on the pair.
Examples of these two methods are shown earlier in this description.
🔹 Period
This parameter defines how many bars are used to calculate the average deviation for the pair.
If you set Period = 300, the indicator looks back 300 bars and calculates the typical spread deviation over that window.
For example, if the average deviation over 300 bars is around 1%, then a move to 2% or more will push Z/S Score closer to its boundary levels, since such a deviation is considered abnormal for that lookback period.
A larger Period means that only bigger deviations will be treated as anomalies.
A smaller Period makes the model more sensitive and treats smaller deviations as anomalies.
This allows you to tune how aggressive or conservative your pair trading signals should be.
🔹 Invert
This setting is used for negatively correlated pairs.
Some instruments have a positive correlation in the range from +0.8 to +1.0 (strong positive correlation), while others show a negative correlation from −0.8 to −1.0, meaning they usually move in opposite directions.
A classic example is the pair EURUSD and DXY.
As shown in the screenshot above, these instruments often have strong negative correlation due to macro factors and typically move in opposite directions: when EURUSD is rising, DXY is falling, and vice versa.
Such pairs can also be traded with our indicator.
To do this, we use the Invert option, which effectively flips one of the assets (as shown in the screenshot below). After inversion, both instruments are brought to a “same-direction” behavior from the model’s point of view.
From there, you trade the pair in the same way as a positively correlated one:
you open both legs in the same direction (both long or both short) depending on the spread and Score, and then wait for the spread between the inverted pair to converge back toward its mean.
🔀 HEDGE COEFFICIENT
The next block of settings is related to the hedge coefficient.
This defines how much margin is allocated to each leg of the pair.
The classic approach in pair trading is to split the position equally between both assets.
For example, if you allocate 100 USD to a trade , the standard model would open 50 USD long on one asset and 50 USD short on the other.
This works well for pairs with similar volatility , such as BTCUSDT / ETHUSDT
However, if you use a pair like BTCUSDT / DOGEUSDT , the volatility of these assets is very different.
They can still be correlated, but their amplitude is not the same. While Bitcoin might move 2% , Dogecoin can move 10% over the same period.
Because of that, for pairs with strongly different volatility, we can use a hedge coefficient and, for example, enter with 30 USD on one leg and 70 USD on the other, taking the volatility difference into account.
This is the main idea behind the Hedge Coefficient section and its primary use.
The indicator includes 6 methods of calculating the coefficient:
Cumulative RMA
Beta OLS
Beta TLS
Beta EMA
RMA Range
RMA Delta
Each method uses a different formula to compute the hedge coefficient and to size the position based on different metrics of the assets.
We leave it to the trader to decide which algorithm works best for their specific pair and style.
Below are the settings inside this section:
🔹 Method
When Auto Hedge is enabled, you can select which method to use from the list above.
The chosen method will automatically calculate the hedge coefficient between the two legs.
🔹 Hedge Coefficient
This is the manual hedge ratio per trade when Auto Hedge is disabled.
By default it is set to 1, which means the position is opened 50/50 between the two assets.
🔹 Min Allowed Hedge Coef.
This is the minimum allowed hedge coefficient.
By default it is 0.2, which means the model will not go below a 20% / 80% split between the legs.
🔹 MA Length
For methods that use moving averages (for example Beta EMA), this parameter sets the period used to calculate the hedge coefficient.
🛠️ STRATEGY SETTINGS
The next important block is Strategy Settings .
Here you define the core parameters used for backtesting: trading commission, position size, entry / exit logic, Stop Loss, Take Profit, and other rules that describe how you want the strategy to operate.
Below are all parameters with a detailed explanation.
🔸 Commission %
In this field you set your broker’s fee percentage per trade .
The indicator automatically calculates the correct commission for each leg of every trade. You only need to input the real commission rate that your broker charges for volume. No additional manual calculations are required.
🔸 Main Entry Mode
There are two options for the main entry:
Score - This is the primary entry method based on Z/S Score.
When Score reaches the deviation level defined in the settings below, the strategy opens the first position.
For example, if you set “Entry at 2 deviations”, the trade will be opened when Score hits ±2.
RSI Only - Alternative entry method based on RSI divergence between the two assets.
The exact RSI levels are defined in the RSI settings section below.
For example, if you set the entry threshold at 30, then when one asset has RSI below 30 and the second one has RSI above 70, the first entry will be triggered.
🔸 Extra Entries Mode
This defines how scale-ins (averaging) are executed. There are two modes:
Score - Works the same way as the main entry, but for additional entries.
For example, the main entry can be at 2 deviations, the first scale-in at 3, the second at 4, etc.
Spread - This mode uses the Spread (difference between the two assets) starting from the main entry moment.
As the spread continues to widen, the strategy can add extra entries based on spread growth rather than Score.
Since Score is a non-linear metric and Spread is linear, in some configurations averaging by Spread can produce better results than averaging by Score. This is pair- and strategy-dependent. 🔸 Entry parameters
Deviation / Spread threshold
Entry size
Main Entry – first field (deviation / spread), second field (position size)
Entry 2 – first field (deviation / spread), second field (position size)
Entry 3 – first field (deviation / spread), second field (position size)
Entry 4 – first field (deviation / spread), second field (position size)
This allows you to define up to four scaling steps with different triggers and different sizing.
🔸 Exit Level
This parameter defines at what Score level you want to exit the trade.
By default it is 0, which means the backtester closes the position when Score returns to the neutral (0) zone.
You can also use positive or negative values. Example:
Assume your main entry is configured at a 3 deviation.
You can exit at the 0 level, or you can set Exit Level = 2.
If your initial entry was at −3, the position will be closed when Score reaches +2.
If your initial entry was at +3, the position will be closed when Score reaches −2.
This approach can increase the profit per trade due to a larger captured spread, but it may also increase the holding time of the position.
🔸 Stop Loss
Here you define the maximum loss per trade in PnL units.
If a trade reaches the negative PnL value specified in this field and the Stop Loss option is enabled, the indicator will close the trade at a loss.
The Cooldown parameter sets a pause after a losing trade:
the strategy will wait a specified number of bars before opening the next trade.
🔸 Take Profit
Works similar to Stop Loss but for profit targets.
You set the desired PnL value you want to reach.
The trade will be closed when either the Take Profit target is hit or when Score reaches the exit level defined in the settings, whichever occurs first (depending on your configuration).
🔸 Show Qty in currency
When enabled, trade size is displayed in currency (USD) instead of token quantity.
This is useful for quickly understanding position size in monetary terms.
You will see this in the Current Trade panel, which is described later.
🔸 Size Rounding
Controls how many decimal places are used when rounding position size (from 0 to 10 digits after the decimal).
This is also used for the Current Trade panel so you can adjust how detailed or compact the size display should be.
📊 RSI FILTERS
This section is used for additional trade filtering.
RSI can be used in two ways:
as a primary entry signal,
or as an extra filter for entries based on Z/S Score.
If in the Strategy Settings the Main Entry Mode is set to RSI, then RSI becomes the main trigger for opening a position.
In this case a trade is opened when the RSI of the two assets reaches opposite zones.
Example:
If the threshold is set to 30, then:
when one asset has RSI below 30, and
the second asset has RSI above 70 (100 − 30),
the strategy opens the first entry.
All extra entries after that will be executed either by Spread or by Z/S Score, depending on your Extra Entries Mode.
Below are the parameters in this block:
RSI Length – standard RSI period setting.
RSI Pivot Mode – when enabled, RSI is used as an additional filter together with Z/S Score. The indicator looks for a reversal pattern on RSI (pivot behavior). If RSI forms a reversal structure, the trade is allowed to open. If not, the signal is skipped until a proper RSI pivot is formed.
Entry RSI Filter – here you define the RSI thresholds used for RSI-based entries. These are the same boundary levels described in the example above.
Overall, this section helps filter out lower-quality trades using additional RSI conditions or lets you build RSI-only entry logic based on extreme levels.
🎨 MAIN CHART STYLING
This section controls the visual appearance of trades on the main chart.
You can customize how the second asset line is drawn, as well as the icons for entries, scale-ins, and exits, including their size and style.
▫️ Price Line
This is the line that shows the price of the second asset and the relative difference between the two instruments.
You can adjust the line thickness and color to make it more readable on your chart.
▫️ Adjust Price Line by Hedge Coefficient
When this option is enabled, the second asset’s line is normalized by the hedge coefficient.
If you turn it off, the hedge coefficient will not be applied to the second asset’s line, and it will be displayed in raw form.
▫️ Entry Label
Here you can customize how the entry markers look:
choose the color, icon style, and size of the label that marks each trade entry and scale-in on the chart.
▫️ Exit Label
Similarly, you can define the color, icon style, and size of the label used for exits.
This helps visually separate entries and exits and makes it easier to read the trade history directly from the chart.
🎯 INDICATOR PANEL
This section controls the settings of the indicator panel, which works like an oscillator and allows you to visualize multiple metrics in one place.
You can flexibly enable, style, and scale each parameter.
🔹 Score
Displays the main deviation metric between the two assets.
You can customize the color and line thickness of the Score plot.
🔹 Spread
Shows the spread between the two assets.
It starts calculating from the moment the trade is opened.
You can adjust its color and thickness for better visibility.
🔹 Total Profit
Displays the cumulative profit for this pair and strategy as a line that grows (or falls) over time.
Color, opacity, and line thickness can be customized.
🔹 Unrealized PNL
Once a trade is opened, this line shows the current PnL of the active position.
It also lets you see historical drawdowns on the pair.
Color and thickness can be adjusted.
🔹 Released PNL
Shows the realized PnL of each closed trade as bars.
Useful for quickly evaluating the result of every individual trade in the backtest.
🔹 Correlation
Plots the correlation coefficient between the two assets as a graph, so you can visually track how stable or unstable the relationship between them is over time.
🔹 Hedge Coefficient
Shows the hedge coefficient as a line, which helps understand how the model is rebalancing exposure between the two legs depending on their behavior.
For each metric there is also a 📎 Stretch option.
Stretch allows you to compress or expand the scale of a specific line to visually align metrics with different ranges on the same panel and make the chart easier to read.
📈 PROFIT CHART
Since TradingView does not natively support proper backtesting for pair trading, this indicator includes its own profit curve for the pair.
You can visually see how the strategy performed over historical data: whether there were deep drawdowns, abnormal profit spikes, or stable equity growth over time. This makes it much easier to evaluate the quality of the pair and the strategy on history.
In the settings of this section you can flexibly customize how the profit chart is displayed:
labels, position of the panel, padding, and other visual details.
Everything depends on your personal preferences, so we give full control over styling:
you can adjust the look of the profit chart to match your layout or completely hide it from the chart if you do not need it.
📌 CURRENT TRADE
This section controls the current trade table.
When there is an active trade on the chart, the panel displays all key information for the open position:
direction for each ticker (long or short),
required position size for each leg,
entry price for both assets,
and real-time PnL for each leg separately,
so you always have a clear view of the current situation.
The main thing you can do with this table is customize its appearance:
you can change the size, position on the chart, background and text colors, as well as separate coloring for positive / negative PnL and different colors for long and short positions.
📅 BACKTEST RESULTS
The next key block is Backtest Results.
This results table with detailed metrics gives you an extended view of how the pair and strategy perform: win rate, profit factor, long/short breakdown, and more than 20 additional stats that help you evaluate the potential of your setup.
⚠️ First of all, it is important to note ⚠️
past performance does not guarantee future results.
Every trader must keep this in mind and factor these risks into their strategy.
The table shows metrics in three cuts:
All Entries
Main Entries
Extra Entries (scale-ins)
Core metrics:
Profit – total profit for each entry type.
Winrate – win rate for this pair.
Profit Factor – ratio of gross profit to gross loss for the strategy.
Trades – number of trades in the backtest.
Wins – number of winning trades.
Losses – number of losing trades.
Long Profit – profit generated by long positions.
Short Profit – profit generated by short positions.
Longs – total number of long trades.
Shorts – total number of short trades.
Avg. Time – average time spent in a trade.
Additional metrics for a deeper evaluation of the pair:
Correlation – current correlation between the two assets in the pair.
Bars Processed – number of bars used in the analysis.
Max Drawdown – maximum historical drawdown of the strategy.
Biggest Loss – the largest single losing trade in the backtest.
Recommended Hedge – recommended hedge coefficient based on historical behavior.
Max Spread – maximum positive spread observed in history.
Min Spread – maximum negative spread observed in history.
Avg. Max Spread – average of positive extreme spread values (above 0).
Avg. Min Spread – average of negative extreme spread values (below 0).
Avg Positive Spread – average positive spread across all trades (only values above 0).
Avg Negative Spread – average negative spread across all trades (only values below 0).
Current Spread – current spread between the assets when a trade is open.
These metrics together allow you to quickly assess how stable the pair is, how the risk/return profile looks, and whether the strategy parameters are suitable for live trading. You can fully customize this results table to fit your workflow:
hide metrics you don’t need, change colors, opacity, and other visual styles, and reorder the focus of the stats according to your trading style.
This way the backtest block can show only the metrics that matter to you most and remain clean and readable during analysis.
📣 ALERTS
The next section is dedicated to alerts.
Here you can configure all signals you need, both for manual trading and for full automation of this pair trading strategy. This block is designed to cover most practical use cases. The indicator supports two alert modes:
Single Alert – one universal custom alert for all events.
Two Alerts – separate alerts for each ticker so you can receive different messages per asset.
Available alert events:
Main Entry – when the main entry is triggered.
Entry 2 – when the first scale-in is executed.
Entry 3 – when the second scale-in is executed.
Entry 4 – when the third scale-in is executed.
Exit Alert – when the position is closed.
StopLoss Alert – when Stop Loss is hit.
TakeProfit Alert – when Take Profit is hit.
All alerts are fully customizable and support a set of placeholders for building structured messages or JSON payloads.
🔹1 Alert Type
List of supported placeholders: {{event}} – trigger name ('Entry 1', 'Exit').
{{dir_1}} – 'Long' or 'Short' for the main ticker.
{{dir_2}} – 'Long' or 'Short' for the other ticker.
{{action_1}} – 'Buy', 'Sell' or 'Close' for the main ticker.
{{action_2}} – 'Buy', 'Sell' or 'Close' for the other ticker.
{{price_1}} – price for the main ticker.
{{price_2}} – price for the other ticker.
{{qty_1}} – order size for the main ticker.
{{qty_2}} – order size for the other ticker.
{{ticker_1}} – main ticker (e.g. 'BTCUSD').
{{ticker_2}} – other ticker (e.g. 'ETHUSD').
{{time}} – candle open time in UTC.
{{timenow}} – signal time in UTC.
🔹2 Alert Type
List of supported placeholders: {{event}} – trigger name ('Entry 1', 'Exit', 'SL', 'TP').
{{action}} – 'Buy', 'Sell' or 'Close'.
{{price}} – order price.
{{qty}} – order size.
{{ticker}} – ticker (e.g. 'BTCUSD').
{{time}} – candle open time in UTC.
{{timenow}} – signal time in UTC. You can use these placeholders to build any JSON structure or custom alert text required by your trading bot, exchange API, or automation service.
In this post I’ve explained how the indicator works, the core concept behind this pair trading strategy, and shown practical examples of trades together with a detailed breakdown of each unique feature inside the tool.
We have invested a lot of work into building this indicator and we truly hope it will help you trade pair strategies more efficiently and more profitably by giving you structured, strategy-specific information that is difficult to obtain in any other way.
⚠️ Please also remember that past performance does not guarantee future results.
Always evaluate the risks, the robustness of your setup, and your own risk tolerance before entering any position, and make independent, well-considered decisions when using this or any other strategy.

Impulse Reactor RSI-SMA Trend Indicator [ApexLegion]Impulse Reactor RSI-SMA Trend Indicator
Introduction and Theoretical Background
Design Rationale
Standard indicators frequently generate binary 'BUY' or 'SELL' signals without accounting for the broader market context. This often results in erratic "Flip-Flop" behavior, where signals are triggered indiscriminately regardless of the prevailing volatility regime.
Impulse Reactor was engineered to address this limitation by unifying two critical requirements: Quantitative Rigor and Execution Flexibility.
The Solution
Composite Analytical Framework This script is not a simple visual overlay of existing indicators. It is an algorithmic synthesis designed to function as a unified decision-making engine. The primary objective was to implement rigorous quantitative analysis (Volatility Normalization, Structural Filtering) directly within an alert-enabled framework. This architecture is designed to process signals through strict, multi-factor validation protocols before generating real-time notifications, allowing users to focus on structurally validated setups without manual monitoring.
How It Works
This is not a simple visual mashup. It utilizes a cross-validation algorithm where the Trend Structure acts as a gatekeeper for Momentum signals:
Logic over Lag: Unlike simple moving average crossovers, this script uses a 15-layer Gradient Ribbon to detect "Laminar Flow." If the ribbon is knotted (Compression), the system mathematically suppresses all signals.
Volatility Normalization: The core calculation adapts to ATR (Average True Range). This means the indicator automatically expands in volatile markets and contracts in quiet ones, maintaining accuracy without constant manual tweaking.
Adaptive Signal Thresholding: It incorporates an 'Anti-Greed' algorithm (Dynamic Thresholding) that automatically adjusts entry criteria based on trend duration. This logic aims to mitigate the risk of entering positions during periods of statistical trend exhaustion.
Why Use It?
Market State Decoding: The gradient Ribbon visualizes the underlying trend phase in real-time.
◦ Cyan/Blue Flow: Strong Bullish Trend (Laminar Flow).
◦ Magenta/Pink Flow: Strong Bearish Trend.
◦ Compressed/Knotted: When the ribbon lines are tightly squeezed or overlapping, it signals Consolidation. The system filters signals here to avoid chop.
Noise Reduction: The goal is not to catch every pivot, but to isolate high-confidence setups. The logic explicitly filters out minor fluctuations to help maintain position alignment with the broader trend.
⚖️ Chapter 1: System Architecture
Introduction: Composite Analytical Framework
System Overview
Impulse Reactor serves as a comprehensive technical analysis engine designed to synthesize three distinct market dimensions—Momentum, Volatility, and Trend Structure—into a unified decision-making framework. Unlike traditional methods that analyze these metrics in isolation, this system functions as a central processing unit that integrates disparate data streams to construct a coherent model of market behavior.
Operational Objective
The primary objective is to transition from single-dimensional signal generation to a multi-factor assessment model. By fusing data from the Impulse Core (Volatility), Gradient Oscillator (Momentum), and Structural Baseline (Trend), the system aims to filter out stochastic noise and identify high-probability trade setups grounded in quantitative confluence.
Market Microstructure Analysis: Limitations of Conventional Models
Extensive backtesting and quantitative analysis have identified three critical inefficiencies in standard oscillator-based strategies:
• Bounded Oscillator Limitations (The "Oscillation Trap"): Traditional indicators such as RSI or Stochastics are mathematically constrained between fixed values (0 to 100). In strong trending environments, these metrics often saturate in "overbought" or "oversold" zones. Consequently, traders relying on static thresholds frequently exit structurally valid positions prematurely or initiate counter-trend trades against prevailing momentum, resulting in suboptimal performance.
• Quantitative Blindness to Quality: Standard moving averages and trend indicators often fail to distinguish the qualitative nature of price movement. They treat low-volume drift and high-velocity expansion identically. This inability to account for "Volatility Quality" leads to delayed responsiveness during critical market events.
• Fractal Dissonance (Timeframe Disconnect): Financial markets exhibit fractal characteristics where trends on lower timeframes may contradict higher timeframe structures. Manual integration of multi-timeframe analysis increases cognitive load and susceptibility to human error, often resulting in conflicting biases at the point of execution.
Core Design Principles
To mitigate the aforementioned systemic inefficiencies, Impulse Reactor employs a modular architecture governed by three foundational principles:
Principle A:
Volatility Precursor Analysis Market mechanics demonstrate that volatility expansion often functions as a leading indicator for directional price movement. The system is engineered to detect "Volatility Deviation" — specifically, the divergence between short-term and long-term volatility baselines—prior to its manifestation in price action. This allows for entry timing aligned with the expansion phase of market volatility.
Principle B:
Momentum Density Visualization The system replaces singular momentum lines with a "Momentum Density" model utilizing a 15-layer Simple Moving Average (SMA) Ribbon.
• Concept: This visualization represents the aggregate strength and consistency of the trend.
• Application: A fully aligned and expanded ribbon indicates a robust trend structure ("Laminar Flow") capable of withstanding minor counter-trend noise, whereas a compressed ribbon signals consolidation or structural weakness.
Principle C:
Adaptive Confluence Protocols Signal validity is strictly governed by a multi-dimensional confluence logic. The system suppresses signal generation unless there is synchronized confirmation across all three analytical vectors:
1. Volatility: Confirmed expansion via the Impulse Core.
2. Momentum: Directional alignment via the Hybrid Oscillator.
3. Structure: Trend validation via the Baseline. This strict filtering mechanism significantly reduces false positives in non-trending (choppy) environments while maintaining sensitivity to genuine breakouts.
🔍 Chapter 2: Core Modules & Algorithmic Logic
Module A: Impulse Core (Normalized Volatility Deviation)
Operational Logic The Impulse Core functions as a volatility-normalized momentum gauge rather than a standard oscillator. It is designed to identify "Volatility Contraction" (Squeeze) and "Volatility Expansion" phases by quantifying the divergence between short-term and long-term volatility states.
Volatility Z-Score Normalization
The formula implements a custom normalization algorithm. Unlike standard oscillators that rely on absolute price changes, this logic calculates the Z-Score of the Volatility Spread.
◦ Numerator: (atr_f - atr_s) captures the raw momentum of volatility expansion.
◦ Denominator: (std_f + 1e-6) standardizes this value against historical variance.
◦ Result: This allows the indicator scales consistently across assets (e.g., Bitcoin vs. Euro) without manual recalibration.
f_impulse() =>
atr_f = ta.atr(fastLen) // Fast Volatility Baseline
atr_s = ta.atr(slowLen) // Slow Volatility Baseline
std_f = ta.stdev(atr_f, devLen) // Volatility Standard Deviation
(atr_f - atr_s) / (std_f + 1e-6) // Normalized Differential Calculation
Algorithmic Framework
• Differential Calculation: The system computes the spread between a Fast Volatility Baseline (ATR-10) and a Slow Volatility Baseline (ATR-30).
• Normalization Protocol: To standardize consistency across diverse asset classes (e.g., Forex vs. Crypto), the raw differential is divided by the standard deviation of the volatility itself over a 30-period lookback.
• Signal Generation:
◦ Contraction (Squeeze): When the Fast ATR compresses below the Slow ATR, it registers a potential volatility buildup phase.
◦ Expansion (Release): A rapid divergence of the Fast ATR above the Slow ATR signals a confirmed volatility expansion, validating the strength of the move.
Module B: Gradient Oscillator (RSI-SMA Hybrid)
Design Rationale To mitigate the "noise" and "false reversal" signals common in single-line oscillators (like standard RSI), this module utilizes a 15-Layer Gradient Ribbon to visualize momentum density and persistence.
Technical Architecture
• Ribbon Array: The system generates 15 sequential Simple Moving Averages (SMA) applied to a volatility-adjusted RSI source. The length of each layer increases incrementally.
• State Analysis:
Momentum Alignment (Laminar Flow): When all 15 layers are expanded and parallel, it indicates a robust trend where buying/selling pressure is distributed evenly across multiple timeframes. This state helps filter out premature "overbought/oversold" signals.
• Consolidation (Compression): When the distance between the fastest layer (Layer 1) and the slowest layer (Layer 15) approaches zero or the layers intersect, the system identifies a "Non-Tradable Zone," preventing entries during choppy market conditions.
// Laminar Flow Validation
f_validate_trend() =>
// Calculate spread between Ribbon layers
ribbon_spread = ta.stdev(ribbon_array, 15)
// Only allow signals if Ribbon is expanded (Laminar Flow)
is_flowing = ribbon_spread > min_expansion_threshold
// If compressed (Knotted), force signal to false
is_flowing ? signal : na
Module C: Adaptive Signal Filtering (Behavioral Bias Mitigation)
This subsystem, operating as an algorithmic "Anti-Greed" Mechanism, addresses the statistical tendency for signal degradation following prolonged trends.
Dynamic Threshold Adjustment
• Win Streak Detection: The algorithm internally tracks the outcome of closed trade cycles.
• Sensitivity Multiplier: Upon detecting consecutive successful signals in the same direction, a Penalty_Factor is applied to the entry logic.
• Operational Impact: This effectively raises the Required_Slope threshold for subsequent signals. For example, after three consecutive bullish signals, the system requires a 30% steeper trend angle to validate a fourth entry. This enforces stricter discipline during extended trends to reduce the probability of entering at the point of trend exhaustion.
Anti-Greed Logic: Dynamic Threshold Calculation
f_adjust_threshold(base_slope, win_streak) =>
// Adds a 10% penalty to the difficulty for every consecutive win
penalty_factor = 0.10
risk_scaler = 1 + (win_streak * penalty_factor)
// Returns the new, harder-to-reach threshold
base_slope * risk_scaler
Module D: Trend Baseline (Triple-Smoothed Structure)
The Trend Baseline serves as the structural filter for all signals. It employs a Triple-Smoothed Hybrid Algorithm designed to balance lag reduction with noise filtration.
Smoothing Stages
1. Volatility Banding: Utilizes a SuperTrend-based calculation to establish the upper and lower boundaries of price action.
2. Weighted Filter: Applies a Weighted Moving Average (WMA) to prioritize recent price data.
3. Exponential Smoothing: A final Exponential Moving Average (EMA) pass is applied to create a seamless baseline curve.
Functionality
This "Heavy" baseline resists minor intraday volatility spikes while remaining responsive to sustained structural shifts. A signal is only considered valid if the price action maintains structural integrity relative to this baseline
🚦 Chapter 3: Risk Management & Exit Protocols
Quantitative Risk Management (TP/SL & Trailing)
Foundational Architecture: Volatility-Adjusted Geometry Unlike strategies relying on static nominal values, Impulse Reactor establishes dynamic risk boundaries derived from quantitative volatility metrics. This design aligns trade invalidation levels mathematically with the current market regime.
• ATR-Based Dynamic Bracketing:
The protocol calculates Stop-Loss and Take-Profit levels by applying Fibonacci coefficients (Default: 0.786 for SL / 1.618 for TP) to the Average True Range (ATR).
◦ High Volatility Environments: The risk bands automatically expand to accommodate wider variance, preventing premature exits caused by standard market noise.
◦ Low Volatility Environments: The bands contract to tighten risk parameters, thereby dynamically adjusting the Risk-to-Reward (R:R) geometry.
• Close-Validation Protocol ("Soft Stop"):
Institutional algorithms frequently execute liquidity sweeps—driving prices briefly below key support levels to accumulate inventory.
◦ Mechanism: When the "Soft Stop" feature is enabled, the system filters out intraday volatility spikes. The stop-loss is conditional; execution is triggered only if the candle closes beyond the invalidation threshold.
◦ Strategic Advantage: This logic distinguishes between momentary price wicks and genuine structural breakdowns, preserving positions during transient volatility.
• Step-Function Trailing Mechanism:
To protect unrealized PnL while allowing for normal price breathing, a two-phase trailing methodology is employed:
◦ Phase 1 (Activation): The trailing function remains dormant until the price advances by a pre-defined percentage threshold.
◦ Phase 2 (Dynamic Floor): Once armed, the stop level creates a moving floor, adjusting relative to price action while maintaining a volatility-based (ATR) buffer to systematically protect unrealized PnL.
• Algorithmic Exit Protocols (Dynamic Liquidity Analysis)
◦ Rationale: Inefficiencies of Static Targets Static "Take Profit" levels often result in suboptimal exits. They compel traders to close positions based on arbitrary figures rather than evolving market structure, potentially capping upside during significant trends or retaining positions while the underlying trend structure deteriorates.
◦ Solution: Structural Integrity Assessment The system utilizes a Dynamic Liquidity Engine to continuously audit the validity of the position. Instead of targeting a specific price point, the algorithm evaluates whether the trend remains statistically robust.
Multi-Factor Exit Logic (The Tri-Vector System)
The Smart Exit protocol executes only when specific algorithmic invalidation criteria are met:
• 1. Momentum Exhaustion (Confluence Decay): The system monitors a 168-hour rolling average of the Confluence Score. A significant deviation below this historical baseline indicates momentum exhaustion, signaling that the driving force behind the trend has dissipated prior to a price reversal. This enables preemptive exits before a potential drawdown.
• 2. Statistical Over-Extension (Mean Reversion): Utilizing the core volatility logic, the system identifies instances where price deviates beyond 2.0 standard deviations from the mean. While the trend may be technically bullish, this statistical anomaly suggests a high probability of mean reversion (elastic snap-back), triggering a defensive exit to capitalize on peak valuation.
• 3. Oscillator Rejection (Immediate Pivot): To manage sudden V-shaped volatility, the system monitors RSI pivots. If a sharp "Pivot High" or divergence is detected, the protocol triggers an immediate "Peak Exit," bypassing standard trend filters to secure liquidity during high-velocity reversals.
🎨 Chapter 4: Visualization Guide
Gradient Oscillator Ribbon
The 15-layer SMA ribbon visualized via plot(r1...r15) represents the "Momentum Density" of the market.
• Visuals:
◦ Cyan/Blue Ribbon: Indicates Bullish Momentum.
◦ Pink/Magenta Ribbon: Indicates Bearish Momentum.
• Interpretation:
◦ Laminar Flow: When the ribbon expands widely and flows in parallel, it signifies a robust trend where momentum is distributed evenly across timeframes. This is the ideal state for trend-following.
◦ Compression (Consolidation): If the ribbon becomes narrow, twisted, or knotted, it indicates a "Non-Tradable Zone" where the market lacks a unified direction. Traders are advised to wait for clarity.
◦ Over-Extension: If the top layer crosses the Overbought (85) or Oversold (15) lines, it visually warns of potential market overheating.
Trend Baseline
The thick, color-changing line plotted via plot(baseline) represents the Structural Backbone of the market.
• Visuals: Changes color based on the trend direction (Blue for Bullish, Pink for Bearish).
• Interpretation:
Structural Filter: Long positions are statistically favored only when price action sustains above this baseline, while short positions are favored below it.
Dynamic Support/Resistance: The baseline acts as a dynamic support level during uptrends and resistance during downtrends.
Entry Signals & Labels
Text labels ("Long Entry", "Short Entry") appear when the system detects high-probability setups grounded in quantitative confluence.
• Visuals: Labeled signals appear above/below specific candles.
• Interpretation:
These signals represent moments where Volatility (Expansion), Momentum (Alignment), and Structure (Trend) are synchronized.
Smart Exit: Labels such as "Smart Exit" or "Peak Exit" appear when the system detects momentum exhaustion or structural decay, prompting a defensive exit to preserve capital.
Dynamic TP/SL Boxes
The semi-transparent colored zones drawn via fill() represent the risk management geometry.
• Visuals: Colored boxes extending from the entry point to the Take Profit (TP) and Stop Loss (SL) levels.
• Function:
Volatility-Adjusted Geometry: Unlike static price targets, these boxes expand during high volatility (to prevent wicks from stopping you out) and contract during low volatility (to optimize Risk-to-Reward ratios).
SAR + MACD Glow
Small glowing shapes appearing above or below candles.
• Visuals: Triangle or circle glows near the price bars.
• Interpretation:
This visual indicates a secondary confirmation where Parabolic SAR and MACD align with the main trend direction. It serves as an additional confluence factor to increase confidence in the trade setup.
Support/Resistance Table
A small table located at the bottom-right of the chart.
• Function: Automatically identifies and displays recent Pivot Highs (Resistance) and Pivot Lows (Support).
• Interpretation: These levels can be used as potential targets for Take Profit or invalidation points for manual Stop Loss adjustments.
🖥️ Chapter 5: Dashboard & Operational Guide
Integrated Analytics Panel (Dashboard Overview)
To facilitate rapid decision-making without manual calculation, the system aggregates critical market dimensions into a unified "Heads-Up Display" (HUD). This panel monitors real-time metrics across multiple timeframes and analytical vectors.
A. Intermediate Structure (12H Trend)
• Function: Anchors the intraday analysis to the broader market structure using a 12-hour rolling window.
• Interpretation:
◦ Bullish (> +0.5%): Indicates a positive structural bias. Long setups align with the macro flow.
◦ Bearish (< -0.5%): Indicates structural weakness. Short setups are statistically favored.
◦ Neutral: Represents a ranging environment where the Confluence Score becomes the primary weighting factor.
B. Composite Confluence Score (Signal Confidence)
• Definition: A probability metric derived from the synchronization of Volatility (Impulse Core), Momentum (Ribbon), and Trend (Baseline).
• Grading Scale:
Strong Buy/Sell (> 7.0 / < 3.0): Indicates full alignment across all three vectors. Represents a "Prime Setup" eligible for standard position sizing.
Buy/Sell (5.0–7.0 / 3.0–5.0): Indicates a valid trend but with moderate volatility confirmation.
Neutral: Signals conflicting data (e.g., Bullish Momentum vs. Bearish Structure). Trading is not recommended ("No-Trade Zone").
C. Statistical Deviation Status (Mean Reversion)
• Logic: Utilizes Bollinger Band deviation principles to quantify how far price has stretched from the statistical mean (20 SMA).
• Alert States:
Over-Extended (> 2.0 SD): Warning that price is statistically likely to revert to the mean (Elastic Snap-back), even if the trend remains technically valid. New entries are discouraged in this zone.
Normal: Price is within standard distribution limits, suitable for trend-following entries.
D. Volatility Regime Classification
• Metric: Compares current ATR against a 100-period historical baseline to categorize the market state.
• Regimes:
Low Volatility (Lvl < 1.0): Market Compression. Often precedes volatility expansion events.
Mid Volatility (Lvl 1.0 - 1.5): Standard operating environment.
High Volatility (Lvl > 1.5): Elevated market stress. Risk parameters should be adjusted (e.g., reduced position size) to account for increased variance.
E. Performance Telemetry
• Function: Displays the historical reliability of the Trend Baseline for the current asset and timeframe.
• Operational Threshold: If the displayed Win Rate falls below 40%, it suggests the current market behavior is incoherent (choppy) and does not respect trend logic. In such cases, switching assets or timeframes is recommended.
Operational Protocols & Signal Decoding
Visual Interpretation Standards
• Laminar Flow (Trade Confirmation): A valid trend is visually confirmed when the 15-layer SMA Ribbon is fully expanded and parallel. This indicates distributed momentum across timeframes.
• Consolidation (No-Trade): If the ribbon appears twisted, knotted, or compressed, the market lacks a unified directional vector.
• Baseline Interaction: The Triple-Smoothed Baseline acts as a dynamic support/resistance filter. Long positions remain valid only while price sustains above this structure.
System Calibration (Settings)
• Adaptive Signal Filtering (Prev. Anti-Greed): Enabled by default. This logic automatically raises the required trend slope threshold following consecutive wins to mitigate behavioral bias.
• Impulse Sensitivity: Controls the reactivity of the Volatility Core. Higher settings capture faster moves but may introduce more noise.
⚙️ Chapter 6: System Configuration & Alert Guide
This section provides a complete breakdown of every adjustable setting within Impulse Reactor to assist you in tailoring the engine to your specific needs.
🌐 LANGUAGE SETTINGS (Localization)
◦ Select Language (Default: English):
Function: Instantly translates all chart labels, dashboard texts into your preferred language.
Supported: English, Korean, Chinese, Spanish
⚡ IMPULSE CORE SETTINGS (Volatility Engine)
◦ Deviation Lookback (Default: 30): The period used to calculate the standard deviation of volatility.
Role: Sets the baseline for normalizing momentum. Higher values make the core smoother but slower to react.
◦ Fast Pulse Length (Default: 10): The short-term ATR period.
Role: Detects rapid volatility expansion.
◦ Slow Pulse Length (Default: 30): The long-term ATR baseline.
Role: Establishes the background volatility level. The core signal is derived from the divergence between Fast and Slow pulses.
🎯 TP/SL SETTINGS (Risk Management)
◦ SL/TP Fibonacci (Default: 0.786 / 1.618): Selects the Fibonacci ratio used for risk calculation.
◦ SL/TP Multiplier (Default: 1.5 / 2): Applies a multiplier to the ATR-based bands.
Role: Expands or contracts the Take Profit and Stop Loss boxes. Increase these values for higher volatility assets (like Altcoins) to avoid premature stop-outs.
◦ ATR Length (Default: 14): The lookback period for calculating the Average True Range used in risk geometry.
◦ Use Soft Stop (Close Basis):
Role: If enabled, Stop Loss alerts only trigger if a candle closes beyond the invalidation level. This prevents being stopped out by wick manipulations.
🔊 RIBBON SETTINGS (Momentum Visualization)
◦ Show SMA Ribbon: Toggles the visibility of the 15-layer gradient ribbon.
◦ Ribbon Line Count (Default: 15): The number of SMA lines in the ribbon array.
◦ Ribbon Start Length (Default: 2) & Step (Default: 1): Defines the spread of the ribbon.
Role: Controls the "thickness" of the momentum density visualization. A wider step creates a broader ribbon, useful for higher timeframes.
📎 DISPLAY OPTIONS
◦ Show Entry Lines / TP/SL Box / Position Labels / S/R Levels / Dashboard: Toggles individual visual elements on the chart to reduce clutter.
◦ Show SAR+MACD Glow: Enables the secondary confirmation shapes (triangles/circles) above/below candles.
📈 TREND BASELINE (Structural Filter)
◦ Supertrend Factor (Default: 12) & ATR Period (Default: 90): Controls the sensitivity of the underlying Supertrend algorithm used for the baseline calculation.
◦ WMA Length (40) & EMA Length (14): The smoothing periods for the Triple-Smoothed Baseline.
◦ Min Trend Duration (Default: 10): The minimum number of bars the trend must be established before a signal is considered valid.
🧠 SMART EXIT (Dynamic Liquidity)
◦ Use Smart Exit: Enables the momentum exhaustion logic.
◦ Exit Threshold Score (Default: 3): The sensitivity level for triggering a Smart Exit. Lower values trigger earlier exits.
◦ Average Period (168) & Min Hold Bars (5): Defines the rolling window for momentum decay analysis and the minimum duration a trade must be held before Smart Exit logic activates.
🛡️ TRAILING STOP (Step)
◦ Use Trailing Stop: Activates the step-function trailing mechanism.
◦ Step 1 Activation % (0.5) & Offset % (0.5): The price must move 0.5% in your favor to arm the first trail level, which sets a stop 0.5% behind price.
◦ Step 2 Activation % (1) & Offset % (0.2): Once price moves 1%, the trail tightens to 0.2%, securing the position.
🌀 SAR & MACD SETTINGS (Secondary Confirmation)
◦ SAR Start/Increment/Max: Standard Parabolic SAR parameters.
◦ SAR Score Scaling (ATR): Adjusts how much weight the SAR signal has in the overall confluence score.
◦ MACD Fast/Slow/Signal: Standard MACD parameters used for the "Glow" signals.
🔄 ANTI-GREED LOGIC (Behavioral Bias)
◦ Strict Entry after Win: Enables the negative feedback loop.
◦ Strict Multiplier (Default: 1.1): Increases the entry difficulty by 10% after each win.
Role: Prevents overtrading and entering at the top of an extended trend.
🌍 HTF FILTER (Multi-Timeframe)
◦ Use Auto-Adaptive HTF Filter: Automatically selects a higher timeframe (e.g., 1H -> 4H) to filter signals.
◦ Bypass HTF on Steep Trigger: Allows an entry even against the HTF trend if the local momentum slope is exceptionally steep (catch powerful reversals).
📉 RSI PEAK & CHOPPINESS
◦ RSI Peak Exit (Instant): Triggers an immediate exit if a sharp RSI pivot (V-shape) is detected.
◦ Choppiness Filter: Suppresses signals if the Choppiness Index is above the threshold (Default: 60), indicating a flat market.
📐 SLOPE TRIGGER LOGIC
◦ Force Entry on Steep Slope: Overrides other filters if the price angle is extremely vertical (high velocity).
◦ Slope Sensitivity (1.5): The angle required to trigger this override.
⛔ FLAT MARKET FILTER (ADX & ATR)
◦ Use ADX Filter: Blocks signals if ADX is below the threshold (Default: 20), indicating no trend.
◦ Use ATR Flat Filter: Blocks signals if volatility drops below a critical level (dead market).
🔔 Alert Configuration Guide
Impulse Reactor is designed with a comprehensive suite of alert conditions, allowing you to automate your trading or receive real-time notifications for specific market events.
How to Set Up:
Click the "Alert" (Clock) icon in the TradingView toolbar.
Select "Impulse Reactor " from the Condition dropdown.
Choose one of the specific trigger conditions below:
🚀 Entry Signals (Trend Initiation)
Long Entry:
Trigger: Fires when a confirmed Bullish Setup is detected (Momentum + Volatility + Structure align).
Usage: Use this to enter new Long positions.
Short Entry:
Trigger: Fires when a confirmed Bearish Setup is detected.
Usage: Use this to enter new Short positions.
🎯 Profit Taking (Target Levels)
Long TP:
Trigger: Fires when price hits the calculated Take Profit level for a Long trade.
Usage: Automate partial or full profit taking.
Short TP:
Trigger: Fires when price hits the calculated Take Profit level for a Short trade.
Usage: Automate partial or full profit taking.
🛡️ Defensive Exits (Risk Management)
Smart Exit:
Trigger: Fires when the system detects momentum decay or statistical exhaustion (even if the trend hasn't fully reversed).
Usage: Recommended for tightening stops or closing positions early to preserve gains.
Overbought / Oversold:
Trigger: Fires when the ribbon extends into extreme zones.
Usage: Warning signal to prepare for a potential reversal or pullback.
💡 Secondary Confirmation (Confluence)
SAR+MACD Bullish:
Trigger: Fires when Parabolic SAR and MACD align bullishly with the main trend.
Usage: Ideal for Pyramiding (adding to an existing winning position).
SAR+MACD Bearish:
Trigger: Fires when Parabolic SAR and MACD align bearishly.
Usage: Ideal for adding to short positions.
⚠️ Chapter 7: Conclusion & Risk Disclosure
Methodological Synthesis
Impulse Reactor represents a shift from reactive price tracking to proactive energy analysis. By decomposing market activity into its atomic components — Volatility, Momentum, and Structure — and reconstructing them into a coherent decision model, the system aims to provide a quantitative framework for market engagement. It is designed not to predict the future, but to identify high-probability conditions where kinetic energy and trend structure align.
Disclaimer & Risk Warnings
◦ Educational Purpose Only
This indicator, including all associated code, documentation, and visual outputs, is provided strictly for educational and informational purposes. It does not constitute financial advice, investment recommendations, or a solicitation to buy or sell any financial instruments.
◦ No Guarantee of Performance
Past performance is not indicative of future results. All metrics displayed on the dashboard (including "Win Rate" and "P&L") are theoretical calculations based on historical data. These figures do not account for real-world trading factors such as slippage, liquidity gaps, spread costs, or broker commissions.
◦ High-Risk Warning
Trading cryptocurrencies, futures, and leveraged financial products involves a substantial risk of loss. The use of leverage can amplify both gains and losses. Users acknowledge that they are solely responsible for their trading decisions and should conduct independent due diligence before executing any trades.
◦ Software Limitations
The software is provided "as is" without warranty. Users should be aware that market data feeds on analysis platforms may experience latency or outages, which can affect signal generation accuracy.

FCPO MASTER v6 – Sideway + Breakout + OB + FVG (TUPLE SAFE)TL;DR cepat
1. Gunakan M5 untuk entry & OB/FVG confirmation.
2. Gunakan M15 untuk confirm trend/false breakout.
3. Gunakan H1 untuk bias arah (overall market).
4. Entry hanya bila signal + OB/FVG/candle rejection (script buatkan).
5. SL 5–8 tick, TP 10–25 tick ikut setup (sideway vs breakout).
6. Follow checklist setiap trade — jangan lompat.
________________________________________
Setup awal (1–2 min)
1. Pasang script FCPO Sideway MASTER – OB + Imbalance + Confirmation di TradingView.
2. Timeframes: buka M5, M15, H1 (susun 3 chart atau 1 chart multi-timeframe).
3. Input default: ATR14, Breakout Buffer 5 tick, RangeLen 20, ADX14, TP12, SL8. (Kau boleh tweak nanti).
4. Aktifkan alerts pada BUY Confirm / SELL Confirm / Sideway Buy / Sideway Sell.
________________________________________
Step-by-step trading process
1) Mulakan dengan H1 — tentukan bias HTF
• Lihat H1 untuk jawapan: Trend Up / Down / Sideway.
• Rule ringkas:
o ADX H1 > 20 + price above H1 EMA → bias Bull
o ADX H1 > 20 + price below H1 EMA → bias Bear
o ADX H1 < 20 → market HTF sideway (no strong bias)
Kenapa: H1 bagi kau idea “kalau breakout pada M5, patut follow atau tolak”.
________________________________________
2) Pergi ke M15 — confirm trend & valid breakout
• M15 kena setuju dengan idea breakout.
o Untuk strong breakout: M15 kena tunjuk candle close di atas/bawah range + volume naik.
o Kalau M5 breakout tapi M15 tak setuju (M15 masih sideway) → treat as fakeout. Jangan masuk.
________________________________________
3) M5 — cari entry & confirmation (OB/FVG + candle)
• M5 adalah tempat kau buat keputusan masuk.
• Tunggu script keluarkan Sideway Buy/Sell atau Breakout Buy/Sell.
• CONFIRM entry mesti ada sekurang-kurangnya 1 dari:
o Bull/Bear Order Block searah signal (script detect).
o FVG / Imbalance zone dipenuhi & price retest.
o Candle rejection (pinbar / bearish/bullish engulfing) pada zone.
Jika tiada confirmation → no trade.
________________________________________
4) Checklist sebelum tekan Buy/Sell (MUST)
• H1 bias tidak melawan trade (prefer sama arah).
• M15 confirm breakout / trend or neutral.
• Script keluarkan signal (sideway or breakout).
• OB or FVG atau candle rejection ada.
• ATR kenaikan jika breakout (untuk breakout trade).
• Volume spike jika breakout.
• Risk:SL <= 2% akaun (position sizing).
Kalau semua ticked → boleh entry.
________________________________________
5) Setting SL / TP & position sizing
• Sideway (scalp): SL = 5–8 tick, TP = 8–12 tick.
• Breakout (trend): SL = 8–12 tick, TP = 15–25+ tick (trail later).
• Position sizing: Risk per trade 1–2%.
o Lot size = (Account Risk RM × 1 tick value) / (SL ticks × tickValue) — (kalau kau gunakan fixed tick value, adjust ikut lot).
(Script tunjuk SL & TP label — follow itu.)
________________________________________
6) Entry types
• A. Sideway Reversal (M5)
o Signal: Sideway Buy / Sideway Sell
o Confirm: OB/FVG or rejection candle at range bottom/top
o Trade: scalp target 8–12 tick, tight SL 5–8 tick
• B. Breakout (M5 entry, M15 confirm)
o Signal: Breakout Buy/Sell (Strong)
o Confirm: ATR expanding + volume spike + M15 alignment
o Trade: trend follow, TP 15–25 tick, trailing stop active
• C. Retest Entry
o Breakout happens, price returns to retest range / OB / FVG → wait for rejection candle then enter. Safer.
________________________________________
7) Trailing & exit rules
• Jika useTrail = true script plots trailing stop (ATR × multiplier).
• Exit rules:
1. Hit TP → close.
2. Hit SL → close.
3. If trailing stop hit → close.
4. If opposing confirmed signal muncul (e.g., SELL confirm while long) → consider close early.
5. If H1 bias flips strongly vs trade → tighten stop or close.
________________________________________
8) Multiple signals & scaling
• Never add to losing position (no averaging down).
• If want scale-in on confirmed trend: add 1 partial size after price moves +10–12 tick in favor and shows continuation candle + no bearish OB/FVG.
• Keep aggregated risk within your max (2–3%).
________________________________________
9) Example trade walkthrough (concrete)
• RangeHigh = 4065, RangeLow = 4035 (contoh).
• Market sideway M5.
Case A — Sideway Sell:
1. Price touches 4064–4065, script shows sidewaySell.
2. Lihat OB: ada bear OB zone di 4062–4066 → confirm.
3. Candle rejection (bearish pinbar) muncul → enter SELL M5.
4. Set SL = 5 tick above rangeHigh = 4070, TP = 10 tick → 4055.
5. Trail jika price turun > 8 tick: aktifkan trailing.
6. Close at TP or trail/SL.
Case B — Breakout Buy:
1. Price closes above 4065 + 5 tick buffer = 4070 on M5. Script shows trueBreakUp.
2. M15 shows candle close above M15 resistance + volume spike → confirm.
3. Enter BUY, SL = 8 tick below entry, TP initial 20 tick, trail with ATR×1.5.
4. Move stop to breakeven after +10 tick, scale out half at +12 tick, leave rest to trail.
________________________________________
10) Journal & review
• Semua trade: record entry time, TF, reason (which confirmations), SL/TP, result, lesson.
• Weekly review: check which confirmation worked best (OB vs FVG vs candle) and tweak settings.
________________________________________
11) Tweaks / optimisations cepat
• Jika terlalu banyak false sideway signals → kurangkan touchDist ke 2 tick.
• Kalau fakeout breakout banyak → tambah tickBuf ke 6–8.
• Nak lebih konservatif → cuma trade breakout yang juga setuju M15.
________________________________________
12) Alerts & execution (practical)
• Pasang alert pada BUY Confirm / SELL Confirm (script).
• Kalau kau guna broker yang support one-click order, siap sediakan template order (SL/TP default).
• Kalau manual, bila alert masuk: buka M5, cepat confirm OB/FVG & candle rejection → entry.
________________________________________
Quick reference table (handy)
• TF utama entry: M5
• Confirm mid-TF: M15
• Bias HTF: H1
• Sideway SL/TP: SL 5–8, TP 8–12
• Breakout SL/TP: SL 8–12, TP 15–25+
• Mandatory confirmation: (Script signal) + (OB or FVG or candle)

RED-E Market Structure (Pro V2)RED-E Market Structure - Comprehensive Technical Analysis System
⚠️ EDUCATIONAL TOOL - NO GUARANTEES
This indicator is designed for educational purposes to help traders learn technical analysis concepts. It does not predict future price movements or guarantee profitable trades. Trading involves substantial risk of loss.
═══════════════════════════════════════════════════════════════
📊 WHAT THIS INDICATOR DOES
This indicator combines multiple standard technical analysis methods into a unified system for analyzing market structure, momentum, volume dynamics, and key price levels. Rather than adding 10 separate indicators to your chart, this consolidates related information into one cohesive interface where each component informs the others.
═══════════════════════════════════════════════════════════════
🔧 TECHNICAL METHODOLOGY - HOW IT WORKS
1️⃣ MOMENTUM CANDLE COLORING (6 Levels)
Calculation Method:
- Compares close vs EMA(9) and EMA(21)
- Applies RSI(14) thresholds for strength
- Color codes: Royal Blue (strongest bull) → Cyan → Green → Yellow → Orange → Red (strongest bear) → White (neutral)
Formula Logic:
IF close > EMA(9) AND close > EMA(21) AND close > open:
RSI > 70 = Level 3 Bull (Royal Blue)
RSI 60-70 = Level 2 Bull (Cyan)
RSI < 60 = Level 1 Bull (Green)
Purpose: Visualizes momentum strength by combining trend (EMAs), candle direction, and overbought/oversold conditions (RSI).
2️⃣ ENTRY SIGNAL LABELS
Calculation Method:
- Uses EMA alignment: EMA(9) > EMA(21) > EMA(50) for bullish
- Filters RSI to avoid extremes
- Requires confirming candle
BUY Signal Logic:
IF close > EMA(9) AND RSI between 40-70 AND EMA(9) > EMA(21) > EMA(50) AND close > open
THEN: Display "BUY" label
Purpose: Identifies potential entries when multiple trend and momentum conditions align. This is standard multi-confirmation technical analysis.
3️⃣ VOLUME DELTA PERCENTAGE
Calculation Method:
FOR each bar in lookback period (default 20):
IF close > open: add volume to bullish_volume
IF close < open: add volume to bearish_volume
bullish_percent = (bullish_volume / total_volume) × 100
Purpose: Quantifies buying vs selling pressure as percentages. Shows if volume supports the current trend.
Display: "🟢65.3% | 🔴34.7%" in dashboard
4️⃣ PRE-MARKET HIGH/LOW TRACKING
Calculation Method:
1. Detect pre-market session (4:00-9:30 AM ET)
2. Track highest high during pre-market
3. Track lowest low during pre-market
4. Draw horizontal lines when market opens
Purpose: Pre-market levels often act as support/resistance during regular hours. This automates their tracking and visualization.
5️⃣ OPENING RANGE BREAKOUT (ORB)
Calculation Method:
1. User sets start time (default 9:30 AM) and duration (default 15 min)
2. Track highest high and lowest low during this period
3. Draw box and extend lines
Purpose: The opening range breakout is a well-documented day trading strategy. First X minutes establish a range, and breakouts often signal directional moves.
6️⃣ SUPPORT/RESISTANCE TRENDLINES
Calculation Method:
1. Identify pivot highs: ta.pivothigh(high, 5, 5)
2. Identify pivot lows: ta.pivotlow(low, 5, 5)
3. Connect last two pivot highs = Resistance (red)
4. Connect last two pivot lows = Support (blue)
Purpose: Automatically connects significant pivot points. Based on standard pivot analysis where price respects these levels.
7️⃣ GAMMA ZONE DETECTION
Calculation Method:
1. Calculate 30-min range: (high - low)
2. Calculate 10-period SMA of range
3. Calculate ratio: current_range / average_range
IF ratio < (1.0 / sensitivity): HIGH GAMMA = Low volatility
IF ratio > (1.0 × sensitivity): LOW GAMMA = High volatility
Purpose: Approximates options gamma effects. High gamma = dealers hedge more = suppressed volatility. Low gamma = less hedging = potential explosive moves.
8️⃣ TAKE PROFIT LEVELS (5 Levels + ATR Stop Loss)
Calculation Method:
LONG: TP = entry_price × (1 + percentage/100)
SHORT: TP = entry_price × (1 - percentage/100)
Stop Loss (ATR): entry ± (ATR(14) × multiplier)
Purpose: Automatically calculates percentage-based targets and volatility-adjusted stops. ATR adapts stop to current market conditions.
9️⃣ THE STRAT PATTERN RECOGNITION
Calculation Method:
Compare current bar to previous:
- Strat 3 (outside bar): high > high AND low < low
- Strat 1 (inside bar): high ≤ high AND low ≥ low
- Strat 2 (directional): All others
Purpose: The Strat is a price action system categorizing bars by relationship to previous bars. This automates classification.
🔟 FIBONACCI RETRACEMENTS
Calculation Method:
1. Find highest high in lookback (default 30 bars)
2. Find lowest low in lookback
3. Calculate: 0.0, 0.382, 0.5, 0.618, 1.0 levels
Purpose: Standard Fibonacci tool. These ratios are commonly used support/resistance in technical analysis.
1️⃣1️⃣ MULTI-TIMEFRAME ANALYSIS
Calculation Method:
FOR each timeframe (default 15m, 1H, 4H):
Check if close > EMA(9) on that timeframe
IF true: "BULLISH", else: "BEARISH"
Purpose: Shows trend alignment across timeframes using Pine's request.security(). Common confirmation technique.
═══════════════════════════════════════════════════════════════
💡 WHY THESE COMPONENTS WORK TOGETHER
This indicator's originality lies in its unified system approach:
1. TREND IDENTIFICATION (EMAs, MTF) - Shows direction
2. MOMENTUM MEASUREMENT (RSI, candles) - Shows strength
3. VOLUME CONFIRMATION (Volume Delta) - Shows conviction
4. KEY LEVELS (PM, ORB, Fib, S/R) - Shows decision points
5. RISK MANAGEMENT (TP levels, ATR stops) - Shows exits
VALUE OF INTEGRATION:
Rather than 10 separate indicators creating chart clutter, this consolidates related concepts where each component provides different information that, when viewed together, gives a more complete market picture.
Example Integration:
- Entry signal appears (EMA + RSI aligned)
- Volume Delta confirms (more buying than selling)
- MTF shows higher timeframes agree
- TP levels auto-calculate with good risk:reward
- Support trendline nearby provides stop reference
═══════════════════════════════════════════════════════════════
⚙️ CUSTOMIZATION OPTIONS
All features independently toggleable:
- EMAs: Adjust lengths (9, 21, 50, 200), colors, widths
- RSI: Change overbought/oversold levels (70/30)
- Volume Delta: Adjust lookback period (20)
- ORB: Set custom start time, duration, timezone
- Gamma: Adjust sensitivity (1-10)
- TP Levels: Customize all 5 percentages
- Dashboard: Reposition, resize, recolor
═══════════════════════════════════════════════════════════════
📖 HOW TO USE
Step 1 - Assess Context:
- Check MTF Dashboard for alignment
- Check EMA indicator for trend
- Check Gamma Zone for volatility expectation
Step 2 - Identify Setups:
- Wait for BUY/SELL signal
- Check Volume Delta matches direction
- Verify RSI not extreme (30-70)
- Look for support/resistance confluence
Step 3 - Evaluate Risk:Reward:
- Review TP3 R:R ratio (target 2:1+)
- Check stop loss placement
- Ensure risk acceptable
Step 4 - Monitor:
- Track P&L % in real-time
- Use TP levels as potential exits
- Adjust stops based on S/R
═══════════════════════════════════════════════════════════════
⚠️ LIMITATIONS & REALISTIC EXPECTATIONS
This indicator does NOT:
- Predict future price movements
- Guarantee profitable trades
- Work in all market conditions
- Replace proper education and practice
This indicator CAN:
- Display standard technical indicators in organized way
- Automate common calculations
- Visualize multiple analysis methods simultaneously
- Help learn how different indicators relate
Key Understanding:
All technical indicators use historical data. They help identify patterns and conditions but cannot predict the future. Successful trading requires risk management, psychology, and experience—not just indicators.
═══════════════════════════════════════════════════════════════
📚 EDUCATIONAL CONCEPTS TAUGHT
- How EMAs show trend direction and alignment
- How RSI identifies momentum extremes
- How volume confirms or diverges from price
- How support/resistance levels form
- How multiple timeframes provide context
- How ATR adapts stops to volatility
- How risk:reward ratios work
═══════════════════════════════════════════════════════════════
📊 BEST SUITED FOR
- Scalping: 1m-5m charts with quick entries/exits
- Day Trading: 15m-1H focusing on ORB and PM levels
- Swing Trading: 4H-D following major trends
═══════════════════════════════════════════════════════════════
⚠️ RISK DISCLAIMER
Trading involves substantial risk of loss. This educational tool:
- Does NOT guarantee profits
- Cannot predict future performance
- Requires proper risk management
- Should be practiced on demo accounts first
Always use stop losses, risk only 1-2% per trade, and consult licensed financial professionals before trading with real capital.
═══════════════════════════════════════════════════════════════
Educational tool for learning technical analysis. Not financial advice. Past results do not indicate future performance.

Momentum Volume Divergence (MVD) EnhancedMomentum Volume Divergence (MVD) Enhanced is a powerful indicator that detects price-momentum divergences and momentum suppression for reversal trading. Optimized for XRP on 1D charts, it features dynamic lookbacks, ATR-adjusted thresholds, and SMA confirmation. Signals include strong divergences (triangles) and suppression warnings (crosses). Includes a detailed user guide—try it out and share your feedback!
Setup: Add to XRP 1D chart with defaults (mom_length_base=8, vol_length_base=10). Signals: Red triangle (sell), Green triangle (buy), Orange cross (bear warning), Yellow cross (bull warning). Confirm with 5-day SMA crossovers. See full guide for details!
Disclaimer: This indicator is for educational purposes only, not financial advice. Trading involves risk—use at your discretion.
Momentum Volume Divergence (MVD) Enhanced Indicator User Guide
Version: Pine Script v6
Designed for: TradingView
Recommended Use: XRP on 1-day (1D) chart
Date: March 18, 2025
Author: Herschel with assistance from Grok 3 (xAI)
Overview
The Momentum Volume Divergence (MVD) Enhanced indicator is a powerful tool for identifying price-momentum divergences and momentum suppression patterns on XRP’s 1-day (1D) chart. Plotted below the price chart, it provides clear visual signals to help traders spot potential reversals and trend shifts.
Purpose
Detect divergences between price and momentum for buy/sell opportunities.
Highlight momentum suppression as warnings of fading trends.
Offer actionable trading signals with intuitive markers.
Indicator Components
Main Plot
Volume-Weighted Momentum (vw_mom): Blue line showing momentum adjusted by volume.
Above 0 = bullish momentum.
Below 0 = bearish momentum.
Zero Line: Gray dashed line at 0, separating bullish/bearish zones.
Key Signals
Strong Bearish Divergence:
Marker: Red triangle at the top.
Meaning: Price makes a higher high, but momentum weakens, confirmed by a drop below the 5-day SMA.
Action: Potential sell/short signal.
Strong Bullish Divergence:
Marker: Green triangle at the bottom.
Meaning: Price makes a lower low, but momentum strengthens, confirmed by a rise above the 5-day SMA.
Action: Potential buy/long signal.
Bearish Suppression:
Marker: Orange cross at the top + red background.
Meaning: Strong bullish momentum with low volume in a volume downtrend, suggesting fading strength.
Action: Warning to avoid longs or exit early.
Bullish Suppression:
Marker: Yellow cross at the bottom + green background.
Meaning: Strong bearish momentum with low volume in a volume uptrend, suggesting fading weakness.
Action: Warning to avoid shorts or exit early.
Debug Plots (Optional)
Volume Ratio: Gray line (volume vs. its MA) vs. yellow line (threshold).
Momentum Threshold: Purple lines (positive/negative momentum cutoffs).
Smoothed Momentum: Orange line (raw momentum).
Confirmation SMA: Purple line (price trend confirmation).
Labels
Text labels (e.g., "Bear Div," "Bull Supp") mark detected patterns.
How to Use the Indicator
Step-by-Step Trading Process
1. Monitor the Chart
Load your XRP 1D chart with the indicator applied.
Observe the blue vw_mom line and signal markers.
2. Spot a Signal
Primary Signals: Look for red triangles (strong_bear) or green triangles (strong_bull).
Warnings: Note orange crosses (suppression_bear) or yellow crosses (suppression_bull).
3. Confirm the Signal
For Strong Bullish Divergence (Buy):
Green triangle appears.
Price closes above the 5-day SMA (purple line) and a recent swing high.
Optional: Volume ratio (gray line) exceeds the threshold (yellow line).
For Strong Bearish Divergence (Sell):
Red triangle appears.
Price closes below the 5-day SMA and a recent swing low.
Optional: Volume ratio (gray line) falls below the threshold (yellow line).
4. Enter the Trade
Long:
Buy at the close of the signal bar.
Stop loss: Below the recent swing low or 2 × ATR(14) below entry.
Short:
Sell/short at the close of the signal bar.
Stop loss: Above the recent swing high or 2 × ATR(14) above entry.
5. Manage the Trade
Take Profit:
Aim for a 2:1 or 3:1 risk-reward ratio (e.g., risk $0.05, target $0.10-$0.15).
Or exit when an opposite suppression signal appears (e.g., orange cross for longs).
Trailing Stop:
Move stop to breakeven after a 1:1 RR move.
Trail using the 5-day SMA or 2 × ATR(14).
Early Exit:
Exit if a suppression signal appears against your position (e.g., suppression_bull while short).
6. Filter Out Noise
Avoid trades if a suppression signal precedes a divergence within 2-3 days.
Optional: Add a 50-day SMA on the price chart:
Longs only if price > 50-SMA.
Shorts only if price < 50-SMA.
Example Trades (XRP 1D)
Bullish Trade
Signal: Green triangle (strong_bull) at $0.55.
Confirmation: Price closes above 5-SMA and $0.57 high.
Entry: Buy at $0.58.
Stop Loss: $0.53 (recent low).
Take Profit: $0.63 (2:1 RR) or exit on suppression_bear.
Outcome: Price hits $0.64, exit at $0.63 for profit.
Bearish Trade
Signal: Red triangle (strong_bear) at $0.70.
Confirmation: Price closes below 5-SMA and $0.68 low.
Entry: Short at $0.67.
Stop Loss: $0.71 (recent high).
Take Profit: $0.62 (2:1 RR) or exit on suppression_bull.
Outcome: Price drops to $0.61, exit at $0.62 for profit.
Tips for Success
Combine with Price Levels:
Use support/resistance zones (e.g., weekly pivots) to confirm entries.
Monitor Volume:
Rising volume (gray line above yellow) strengthens signals.
Adjust Sensitivity:
Too many signals? Increase div_strength_threshold to 0.7.
Too few signals? Decrease to 0.3.
Backtest:
Review 20-30 past signals on XRP 1D to assess performance.
Avoid Choppy Markets:
Skip signals during low volatility (tight price ranges).
Troubleshooting
No Signals:
Lower div_strength_threshold to 0.3 or mom_threshold_base to 0.2.
Check if XRP’s volatility is unusually low.
False Signals:
Increase sma_confirm_length to 7 or add a 50-SMA filter.
Indicator Not Loading:
Ensure the script compiles without errors.
Customization (Optional)
Change Colors: Edit color.* values (e.g., color.red to color.purple).
Add Alerts: Use TradingView’s alert menu for "Strong Bearish Divergence Confirmed," etc.
Test Other Assets: Experiment with BTC or ETH, adjusting inputs as needed.
Disclaimer
This indicator is for educational purposes only and not financial advice. Trading involves risk, and past performance does not guarantee future results. Use at your own discretion.
Setup: Use on XRP 1D with defaults (mom_length_base=8, vol_length_base=10). Signals: Red triangle (sell), Green triangle (buy), Orange cross (bear warning), Yellow cross (bull warning). Confirm with 5-day SMA cross. Stop: 2x ATR(14). Profit: 2:1 RR or suppression exit. Full guide available separately!

RSI Failure Swing Pattern (with Alerts & Targets)RSI Failure Swing Pattern Indicator – Detailed Description
Overview
The RSI Failure Swing Pattern Indicator is a trend reversal detection tool based on the principles of failure swings in the Relative Strength Index (RSI). This indicator identifies key reversal signals by analyzing RSI swings and confirming trend shifts using predefined overbought and oversold conditions.
Failure swing patterns are one of the strongest RSI-based reversal signals, initially introduced by J. Welles Wilder. This indicator detects these patterns and provides clear buy/sell signals with labeled entry, stop-loss, and profit target levels. The tool is designed to work across all timeframes and assets.
How the Indicator Works
The RSI Failure Swing Pattern consists of two key structures:
1. Bullish Failure Swing (Buy Signal)
Occurs when RSI enters oversold territory (below 30), recovers, forms a higher low above the oversold level, and finally breaks above the intermediate swing high in RSI.
Step 1: RSI dips below 30 (oversold condition).
Step 2: RSI rebounds and forms a local peak.
Step 3: RSI retraces but does not go below the previous low (higher low confirmation).
Step 4: RSI breaks above the previous peak, confirming a bullish trend reversal.
Buy signal is triggered at the breakout above the RSI peak.
2. Bearish Failure Swing (Sell Signal)
Occurs when RSI enters overbought territory (above 70), declines, forms a lower high below the overbought level, and then breaks below the intermediate swing low in RSI.
Step 1: RSI rises above 70 (overbought condition).
Step 2: RSI declines and forms a local trough.
Step 3: RSI bounces but fails to exceed the previous high (lower high confirmation).
Step 4: RSI breaks below the previous trough, confirming a bearish trend reversal.
Sell signal is triggered at the breakdown below the RSI trough.
Features of the Indicator
Custom RSI Settings: Adjustable RSI length (default 14), overbought/oversold levels.
Buy & Sell Signals: Buy/sell signals are plotted directly on the price chart.
Entry, Stop-Loss, and Profit Targets:
Entry: Price at the breakout of the RSI failure swing pattern.
Stop-Loss: Lowest low (for buy) or highest high (for sell) of the previous two bars.
Profit Targets: Two levels calculated based on Risk-Reward ratios (1:1 and 1:2 by default, customizable).
Labeled Price Levels:
Entry Price Line (Blue): Marks the point of trade entry.
Stop-Loss Line (Red): Shows the calculated stop-loss level.
Target 1 Line (Orange): Profit target at 1:1 risk-reward ratio.
Target 2 Line (Green): Profit target at 1:2 risk-reward ratio.
Alerts for Trade Execution:
Buy/Sell signals trigger alerts for real-time notifications.
Alerts fire when price reaches stop-loss or profit targets.
Works on Any Timeframe & Asset: Suitable for stocks, forex, crypto, indices, and commodities.
Why Use This Indicator?
Highly Reliable Reversal Signals: Unlike simple RSI overbought/oversold strategies, failure swings filter out false breakouts and provide strong confirmation of trend reversals.
Risk Management Built-In: Stop-loss and take-profit levels are automatically set based on historical price action and risk-reward considerations.
Easy-to-Use Visualization: Clearly marked entry, stop-loss, and profit target levels make it beginner-friendly while still being valuable for experienced traders.
How to Trade with the Indicator
Buy Trade Example (Bullish Failure Swing)
RSI drops below 30 and recovers.
RSI forms a higher low and then breaks above the previous peak.
Entry: Buy when RSI crosses above its previous peak.
Stop-Loss: Set below the lowest low of the previous two candles.
Profit Targets:
Target 1 (1:1 Risk-Reward Ratio)
Target 2 (1:2 Risk-Reward Ratio)
Sell Trade Example (Bearish Failure Swing)
RSI rises above 70 and then declines.
RSI forms a lower high and then breaks below the previous trough.
Entry: Sell when RSI crosses below its previous trough.
Stop-Loss: Set above the highest high of the previous two candles.
Profit Targets:
Target 1 (1:1 Risk-Reward Ratio)
Target 2 (1:2 Risk-Reward Ratio)
Final Thoughts
The RSI Failure Swing Pattern Indicator is a powerful tool for traders looking to identify high-probability trend reversals. By using the RSI failure swing concept along with built-in risk management tools, this indicator provides a structured approach to trading with clear entry and exit points. Whether you’re a day trader, swing trader, or long-term investor, this indicator helps in capturing momentum shifts while minimizing risk.
Would you like any modifications or additional features? 🚀

Bar Color - Moving Average Convergence Divergence [nsen]The Pine Script you've provided creates a custom indicator that utilizes the MACD (Moving Average Convergence Divergence) and displays various outputs, such as bar color changes based on MACD signals, and a table of data from multiple timeframes. Here's a breakdown of how the script works:
1. Basic Settings (Input)
• The script defines several user-configurable parameters, such as the MACD values, bar colors, the length of the EMA (Exponential Moving Average) periods, and signal smoothing.
• Users can also choose timeframes to analyze the MACD values, like 5 minutes, 15 minutes, 1 hour, 4 hours, and 1 day.
2. MACD Calculation
• It uses the EMA of the close price to calculate the MACD value, with fast_length and slow_length representing the fast and slow periods. The signal_length is used to calculate the Signal Line.
• The MACD value is the difference between the fast and slow EMA, and the Signal Line is the EMA of the MACD.
• The Histogram is the difference between the MACD and the Signal Line.
3. Plotting the Histogram
• The Histogram values are plotted with colors that change based on the value. If the Histogram is positive (rising), it is colored differently than if it's negative (falling). The colors are determined by the user inputs, for example, green for bullish (positive) signals and red for bearish (negative) signals.
4. Bar Coloring
• The bar color changes based on the MACD's bullish or bearish signal. If the MACD is bullish (MACD > Signal), the bar color will change to the color defined for bullish signals, and if it's bearish (MACD < Signal), the bar color will change to the color defined for bearish signals.
5. Multi-Timeframe Data Table
• The script includes a table displaying the MACD trend for different timeframes (e.g., 5m, 15m, 1h, 4h, 1d).
• Each timeframe will show a colored indicator: green (🟩) for bullish and red (🟥) for bearish, with the background color changing based on the trend.
6. Alerts
• The script has alert conditions to notify the user when the MACD shows a bullish or bearish entry:
• Bullish Entry: When the MACD turns bullish (crosses above the Signal Line).
• Bearish Entry: When the MACD turns bearish (crosses below the Signal Line).
• Alerts are triggered with custom messages such as "🟩 MACD Bullish Entry" and "🟥 MACD Bearish Entry."
Key Features:
• Customizable Inputs: Users can adjust the MACD settings, histogram colors, and timeframe options.
• Visual Feedback: The color changes of the histogram and bars provide instant visual cues for bullish or bearish trends.
• Multi-Timeframe Analysis: The table shows the MACD trend across multiple timeframes, helping traders monitor trends in different timeframes.
• Alert Conditions: Alerts notify users when key MACD crossovers occur.

Daily Manipulation and Distribution Levels with Buy/Sell SignalsIndicator Summary:
This indicator is designed for intraday traders, highlighting key price levels and providing simple buy/sell signals based on price manipulation and distribution concepts.
Key Features:
Core Levels:
Manipulation Plus/Minus: Derived from the daily open and a portion of the daily range (e.g., 25%).
Distribution Levels: Daily high and low serve as ultimate targets or resistance/support levels.
Buy and Sell Signals:
Buy Signal: Triggered when the price crosses above the Manipulation Plus level. A green "BUY" label marks the entry.
Sell Signal: Triggered when the price crosses below the Manipulation Minus level. A red "SELL" label marks the entry.
Clean Chart Design:
Hides unnecessary clutter, showing only relevant key levels and labeled signals for clarity.
How to Use:
Entry Points:
Buy Entry: When a green "BUY" label appears after the price breaks above the Manipulation Plus level.
Sell Entry: When a red "SELL" label appears after the price breaks below the Manipulation Minus level.
Exit Strategy:
Take Profit: Use the Distribution Levels (daily high/low) as take-profit zones.
Stop Loss: Set just above/below the Manipulation Levels to manage risk effectively.
One to Two Trades per Session: Focus on high-probability moves to ensure clarity and reduce overtrading.
Who It’s For:
This indicator is ideal for traders seeking a structured and visual approach to intraday trading, with clear entry/exit criteria based on price manipulation and distribution theory. It simplifies decision-making and ensures clean chart setups without overwhelming visuals.
TradingIQ - Nova IQIntroducing "Nova IQ" by TradingIQ
Nova IQ is an exclusive Trading IQ algorithm designed for extended price move scalping. It spots overextended micro price moves and bets against them. In this way, Nova IQ functions similarly to a reversion strategy.
Nova IQ analyzes historical and real-time price data to construct a dynamic trading system adaptable to various asset and timeframe combinations.
Philosophy of Nova IQ
Nova IQ integrates AI with the concept of central-value reversion scalping. On lower timeframes, prices may overextend for small periods of time - which Nova IQ looks to bet against. In this sense, Nova IQ scalps against small, extended price moves on lower timeframes.
Nova IQ is designed to work straight out of the box. In fact, its simplicity requires just one user setting, making it incredibly straightforward to manage.
Use HTF (used to apply a higher timeframe trade filter) is the only setting that controls how Nova IQ works.
Traders don’t have to spend hours adjusting settings and trying to find what works best - Nova IQ handles this on its own.
Key Features of Nova IQ
Self-Learning Market Scalping
Employs AI and IQ Technology to scalp micro price overextensions.
AI-Generated Trading Signals
Provides scalping signals derived from self-learning algorithms.
Comprehensive Trading System
Offers clear entry and exit labels.
Performance Tracking
Records and presents trading performance data, easily accessible for user analysis.
Higher Timeframe Filter
Allows users to implement a higher timeframe trading filter.
Long and Short Trading Capabilities
Supports both long and short positions to trade various market conditions.
Nova Oscillator (NOSC)
The Nova IQ Oscillator (NOSC) is an exclusive self-learning oscillator developed by Trading IQ. Using IQ Technology, the NOSC functions as an all-in-one oscillator for evaluating price overextensions.
Nova Bands (NBANDS)
The Nova Bands (NBANDS) are based on a proprietary calculation and serve as a custom two-layer smoothing filter that uses exponential decay. These bands adaptively smooth prices to identify potential trend retracement opportunities.
How It Works
Nova IQ operates on a simple heuristic: scalp long during micro downside overextensions and short during micro upside overextensions.
What constitutes an "overextension" is defined by IQ Technology, TradingIQ's proprietary AI algorithm. For Nova IQ, this algorithm evaluates the typical extent of micro overextensions before a reversal occurs. By learning from these patterns, Nova IQ adapts to identify and trade future overextensions in a consistent manner.
In essence, Nova IQ learns from price movements within scalping timeframes to pinpoint price areas for capitalizing on the reversal of an overextension.
As a trading system, Nova IQ enters all positions using market orders at the bar’s close. Each trade is exited with a profit-taking limit order and a stop-loss order. Thanks to its self-learning capability, Nova IQ determines the most suitable profit target and stop-loss levels, eliminating the need for the user to adjust any settings.
What classifies as a tradable overextension?
For Nova IQ, tradable overextensions are not manually set but are learned by the system. Nova IQ utilizes NOSC to identify and classify micro overextensions. By analyzing multiple variations of NOSC, along with its consistency in signaling overextensions and its tendency to remain in extreme zones, Nova IQ dynamically adjusts NOSC to determine what constitutes overextension territory for the indicator.
When NOSC reaches the downside overextension zone, long trades become eligible for entry. Conversely, when NOSC reaches the upside overextension zone, short trades become eligible for entry.
The image above illustrates NOSC and explains the corresponding overextension zones
The blue lower line represents the Downside Overextension Zone.
The red upper line represents the Upside Overextension Zone.
Any area between the two deviation points is not considered a tradable price overextension.
When either of the overextension zones are breached, Nova IQ will get to work at determining a trade opportunity.
The image above shows a long position being entered after the Downside Overextension Zone was reached.
The blue line on the price scale shows the AI-calculated profit target for the scalp position. The redline shows the AI-calculated stop loss for the scalp position.
Blue arrows indicate that the strategy entered a long position at the highlighted price level.
Yellow arrows indicate a position was closed.
You can also hover over the trade labels to get more information about the trade—such as the entry price and exit price.
The image above depicts a short position being entered after the Upside Overextension Zone was breached.
The blue line on the price scale shows the AI-calculated profit target for the scalp position. The redline shows the AI-calculated stop loss for the scalp position.
Red arrows indicate that the strategy entered a short position at the highlighted price level.
Yellow arrows indicate that NOVA IQ exited a position.
Long Entry: Blue Arrow
Short Entry: Red Arrow
Closed Trade: Yellow Arrow
Nova Bands
The Nova Bands (NBANDS) are based on a proprietary calculation and serve as a custom two-layer smoothing filter that uses exponential decay and cosine factors.
These bands adaptively smooth the price to identify potential trend retracement opportunities.
The image above illustrates how to interpret NBANDS. While NOSC focuses on identifying micro overextensions, NBANDS is designed to capture larger price overextensions. As a result, the two indicators complement each other well and can be effectively used together to identify a broader range of price overextensions in the market.
While the Nova Bands are not part of the core heuristic and do not use IQ technology, they provide valuable insights for discretionary traders looking to refine their strategies.
Use HTF (Use Higher Timeframe) Setting
Nova IQ has only one setting that controls its functionality.
“Use HTF” controls whether the AI uses a higher timeframe trading filter. This setting can be true or false. If true, the trader must select the higher timeframe to implement.
No Higher TF Filter
Nova IQ operates with standard aggression when the higher timeframe setting is turned off. In this mode, it exclusively learns from the price data of the current chart, allowing it to trade more aggressively without the influence of a higher timeframe filter.
Higher TF Filter
Nova IQ demonstrates reduced aggression when the "Use HTF" (Higher Timeframe) setting is enabled. In this mode, Nova IQ learns from both the current chart's data and the selected higher timeframe data, factoring in the higher timeframe trend when seeking scalping opportunities. As a result, trading opportunities only arise when both the higher timeframe and the chart's timeframe simultaneously display overextensions, making this mode more selective in its entries.
In this mode, Nova IQ calculates NOSC on the higher timeframe, learns from the corresponding price data, and applies the same rules to NOSC as it does for the current chart's timeframe. This ensures that Nova IQ consistently evaluates overextensions across both timeframes, maintaining its trading logic while incorporating higher timeframe insights.
AI Direction
The AI Direction setting controls the trade direction Nova IQ is allowed to take.
“Trade Longs” allows for long trades.
“Trade Shorts” allows for short trades.
Verifying Nova IQ’s Effectiveness
Nova IQ automatically tracks its performance and displays the profit factor for the long strategy and the short strategy it uses. This information can be found in a table located in the top-right corner of your chart showing the long strategy profit factor and the short strategy profit factor.
The image above shows the long strategy profit factor and the short strategy profit factor for Nova IQ.
A profit factor greater than 1 indicates a strategy profitably traded historical price data.
A profit factor less than 1 indicates a strategy unprofitably traded historical price data.
A profit factor equal to 1 indicates a strategy did not lose or gain money when trading historical price data.
Using Nova IQ
While Nova IQ is a full-fledged trading system with entries and exits - it was designed for the manual trader to take its trading signals and analysis indications to greater heights, offering numerous applications beyond its built-in trading system.
The hallmark feature of Nova IQ is its to ignore noise and only generate signals during tradable overextensions.
The best way to identify overextensions with Nova IQ is with NOSC.
NOSC is naturally adept at identifying micro overextensions. While it can be interpreted in a manner similar to traditional oscillators like RSI or Stochastic, NOSC’s underlying calculation and self-learning capabilities make it significantly more advanced and useful than conventional oscillators.
Additionally, manual traders can benefit from using NBANDS. Although NBANDS aren't a core component of Nova IQ's guiding heuristic, they can be valuable for manual trading. Prices rarely extend beyond these bands, and it's uncommon for prices to consistently trade outside of them.
NBANDS do not incorporate IQ Technology; however, when combined with NOSC, traders can identify strong double-confluence opportunities.
유료 스크립트
Position Size Calculator (EzAlgo)Upon adding the indicator to the chart, you will be prompted to place entry price lines, stop loss price line, and multiple take profit price lines by clicking at the desired price level on the chart.
Section Summaries
Table Settings: Allows users to select position and font size from drop-down menus. Displays current settings and potential profit/loss values.
Price Points: Users can set their Entry and select whether they want to include a DCA entry, Stop Loss price, Liquidation Buffer %, Take Profit levels and the amount of position to close at each level.
Risk Management: Users fill out their Account Size, set their Risk % (or fixed $ amount) for each Entry, set Manual Leverage, or allow the indicator to automatically choose the leverage based on the Stop Loss price distance from Entry and the Risk % per Entry.
User-Input Descriptions
DCA Price: The price at which users initiate their second, equally sized and leveraged position when using a Dollar-Cost Averaging (DCA) strategy. Upon reaching the DCA Price, the Entry Price adjusts to the Avg Price, calculated as the midpoint between initial and DCA entries.
Liquidation Buffer: A pre-set percentage that determines how close to the Stop Loss a position can get before it's liquidated. This assists the Auto Leverage feature in optimizing the leverage amount according to risk tolerance.
Risk per Entry: The proportion of the account, in % or a fixed dollar amount, that users are willing to risk for each trading position. If DCA is checked, this will assume users are entering with half of the total position size per entry.
Automatic Leverage: Auto Leverage automatically determines the optimal leverage level for a trade based on the user's Stop Loss price distance from the Entry point and the user-defined risk percentage per Entry. It also considers a user-defined Liquidation Buffer, which is a preset percentage determining how close to the Stop Loss a position can get before it's liquidated. This tool allows traders to optimize their leverage amount according to their risk tolerance.
Max Leverage: The highest leverage level users are willing to use, even if the exchange permits higher. This limit applies when the Auto Leverage feature is enabled.

Buy Sell Indicator by Independent ResearcherThis is an Buy and Sell Oscillator. Its show the trend reversal or change in price action of the market. This indicator is a combination of various moving averages. This is like a MACD but a very powerful version.
How To Use It
If green line gives crossover white line towards down then price is expected to fall.
If red line gives crossover white line towards up then price is expected to rise.
For better results of indicator trade after closing of crossover candle.
There is a band +.20 to -.20 for better results trade on crossover happens between that band.
Below you will see an example:-
XAUUSD
EURUSD
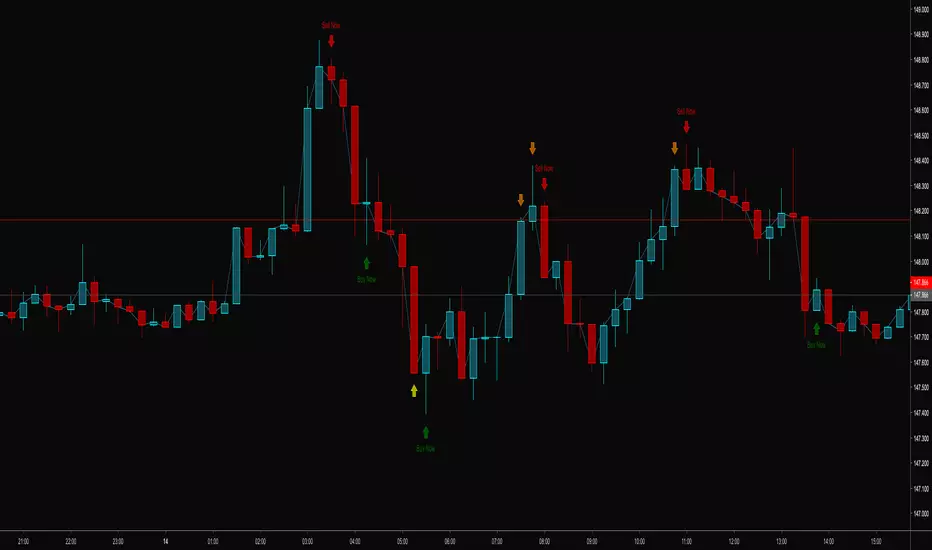
Adaptive Trend & Momentum [ATM] - All-in-One Confirmation Tired of Cluttered Charts and Conflicting Signals? This All-in-One Indicator is Your Solution.
The Adaptive Trend & Momentum (ATM) indicator is a powerful, next-generation trading tool designed to eliminate chart clutter and provide clear, high-conviction signals. Instead of using multiple conflicting indicators, the ATM system combines trend, momentum, and volatility into a single, cohesive, and adaptive framework. It automatically adjusts to changing market conditions, giving you a reliable edge in any environment.
This is not just another moving average crossover. It is a complete trading system that helps you identify the trend, confirm its strength, and time your entries with precision.
Key Features
•
Adaptive Moving Average (AMA): The core of the system. The AMA automatically adjusts its length based on market volatility (using the Average True Range). It becomes faster and more responsive in volatile markets to catch moves early, and smoother in calm markets to avoid noise and false signals.
•
Dynamic Volatility Bands: These bands expand and contract based on market volatility, providing a dynamic map of support and resistance. They are crucial for identifying pullback opportunities and setting effective stop-loss levels.
•
Integrated Momentum Oscillator: A smoothed RSI-based oscillator that runs in a separate pane. It is designed to confirm the signals from the main chart. The oscillator and its histogram are color-coded to show whether bullish or bearish momentum is in control, giving you an instant read on market strength.
•
Clear Consensus Signals: The ATM indicator provides four distinct, easy-to-read signals directly on your chart:
•
STRONG BUY: The highest-conviction signal, appearing when the trend is bullish, momentum is bullish, and the price has pulled back to a strategic entry zone near the AMA.
•
BUY: A standard confirmation signal when both trend and momentum are aligned to the upside.
•
STRONG SELL: The highest-conviction short signal, appearing when the trend is bearish, momentum is bearish, and the price has rallied to a strategic entry zone.
•
SELL: A standard confirmation signal when both trend and momentum are aligned to the downside.
•
Real-Time Dashboard: A convenient on-chart table that provides a complete overview of the market at a glance. It shows the current adaptive length, trend direction, momentum status, consensus signal, and volatility percentage, so you always know what the indicator is thinking.
How It Works: The Adaptive Engine
The magic of the ATM indicator lies in its adaptive engine. Traditional moving averages use a fixed length (e.g., 50-period MA), which can be too slow in a fast market or too sensitive in a choppy one. The ATM’s Adaptive Moving Average solves this by dynamically adjusting its calculation period in real-time:
When volatility increases, the AMA shortens its length to react more quickly to price changes. When volatility decreases, it lengthens its period to smooth out noise and prevent false signals.
This adaptive nature ensures that the indicator remains relevant and effective across different assets and timeframes, from scalping to swing trading.
How to Use This Indicator: A Simple Trading Strategy
The ATM indicator is designed for clarity and ease of use. Here is a basic framework for trading with it:
For Long (Buy) Positions:
1.
Identify the Trend: Wait for the Adaptive Moving Average (AMA) line to turn green, indicating a confirmed uptrend.
2.
Confirm with Momentum: Check that the momentum oscillator is above 50 and preferably rising, confirming bullish strength.
3.
Find Your Entry: The best entry is a "STRONG BUY" signal. This tells you that the price has pulled back to a value area within the uptrend, offering a high-probability entry. A standard "BUY" signal can also be used, but the conviction is higher on "STRONG" signals.
4.
Set Your Stop-Loss: A logical place for a stop-loss is just below the lower volatility band.
5.
Take Profit: Consider taking profits when an opposing "SELL" or "STRONG SELL" signal appears, or when the price reaches a key resistance level.
For Short (Sell) Positions:
1.
Identify the Trend: Wait for the Adaptive Moving Average (AMA) line to turn red, indicating a confirmed downtrend.
2.
Confirm with Momentum: Check that the momentum oscillator is below 50 and preferably falling, confirming bearish strength.
3.
Find Your Entry: The best entry is a "STRONG SELL" signal. This indicates the price has rallied to a resistance area within the downtrend, offering a prime shorting opportunity. A standard "SELL" signal can also be used.
4.
Set Your Stop-Loss: A logical place for a stop-loss is just above the upper volatility band.
5.
Take Profit: Consider taking profits when an opposing "BUY" or "STRONG BUY" signal appears, or when the price reaches a key support level.
Customization and Settings
The indicator is fully customizable to fit your trading style and the asset you are trading. You can adjust:
•
AMA Settings: Control the base length and the volatility multiplier to make the indicator more or less sensitive.
•
Momentum Settings: Adjust the RSI length and smoothing for the oscillator.
•
Volatility Bands: Change the multiplier to widen or narrow the bands.
•
Visuals: Toggle signals, labels, and the dashboard on or off, and customize all colors to your preference.
Summary
The Adaptive Trend & Momentum (ATM) indicator is more than just a tool; it is a complete system for making more confident trading decisions. By adapting to the market and combining trend, momentum, and volatility, it provides a clear, uncluttered, and powerful view of price action.
Add it to your chart today and experience the clarity of adaptive trading!
Disclaimer: This indicator is a tool for technical analysis and should not be considered financial advice. Trading involves risk, and you should always use proper risk management. Past performance is not indicative of future results. Practice on a demo account before trading with real capital.
Keywords: Adaptive, Moving Average, Trend, Momentum, Volatility, RSI, Bands, Signal, Confirmation, All-in-One, System, Strategy, ATR, Volatility, Dashboard, Alert

Katz Candle Momentum Reversal Indicator v4.1Katz Candle Momentum Reversal Indicator (CMRI) v4.1
Overview
The Katz CMRI is a comprehensive trading indicator designed to identify trend direction, momentum shifts, and potential market reversals. It combines several different concepts into a single, cohesive visual tool.
At its core, the indicator uses a custom Line Break chart calculation to filter out market noise and a Heikin-Ashi-style formula to smooth price action. This combination helps to more clearly define the underlying trend. The main output is a dynamic, multi-colored trend line accompanied by various signals that appear directly on your chart. It's designed to help traders stay with the trend while also spotting key moments of expansion, contraction, and potential reversal.
How to Interpret the Indicator
The indicator has several key visual components:
Main Trend Line: This is the thick, central line that changes color.
Green: Indicates a bullish (upward) trend.
Red: Indicates a bearish (downward) trend.
Faded/Light Colors: Suggest a potential loss of momentum or a pullback within the trend.
White: Signals a significant break in the trend structure.
Trend Cloud: The shaded area between the main trend line and the white midline (mid). A green cloud shows the trend is above the midpoint, while a red cloud shows it's below.
Upper/Lower Bands: The aqua (Trend Up) and yellow (Trend Down) lines represent the recent highs and lows of the established trend. When price is pushing against these bands, it signals trend strength.
Background Colors:
Gray: A "Contraction Zone." This indicates that the trend is losing momentum and consolidating, warning of potential chop or a reversal.
Blue: An "Expansion Event." This highlights a sudden increase in momentum in the direction of the trend.
Signal Shapes:
Diamonds: These are the primary entry signals. A green diamond below a candle signals a potential long entry, while a red diamond above a candle signals a potential short entry.
⬆️⬇️ Arrows: These are secondary momentum signals. They can be used as confirmation that the trend is continuing.
Trading Strategy & Rules
This strategy uses the primary diamond signals for entries and trend changes for exits.
Long Trade (Buy) Rules
Entry: Wait for a green diamond to appear below the price candles. For confirmation, the main trend line should turn solid green, and the price should ideally be above the white midline.
Exit:
Stop Loss: Place a stop loss below the recent swing low or below the candle where the green diamond appeared.
Take Profit: Consider exiting the trade when a red diamond appears above the candles, signaling a potential trend reversal. Alternatively, a trader might exit if the background turns gray (Contraction Zone), indicating the bullish momentum has faded.
Short Trade (Sell) Rules
Entry: Wait for a red diamond to appear above the price candles. For confirmation, the main trend line should turn solid red, and the price should ideally be below the white midline.
Exit:
Stop Loss: Place a stop loss above the recent swing high or above the candle where the red diamond appeared.
Take Profit: Consider exiting the trade when a green diamond appears below the candles. A gray "Contraction Zone" can also serve as an early warning to exit as bearish momentum wanes.
Indicator Filters Explained
The indicator includes a "Trend Filter Type" setting that allows you to adjust its sensitivity. This can help reduce false signals in choppy markets.
Raw: This is the most sensitive setting. It will generate a trend change signal as soon as the basic conditions are met. Use this for scalping or in strongly trending markets, but be aware that it may produce more false signals.
OutStep: This is the default, balanced setting. It adds an extra layer of confirmation by requiring the main trend line itself to be moving in the direction of the new trend. For example, a new green signal will only be confirmed if the trend line's value is higher than its previous value. This helps filter out weak signals.
FullStep: This is the most conservative and filtered setting. It includes the "OutStep" logic and adds further conditions related to the upper and lower trend bands. This setting will produce the fewest signals, but they are generally the highest quality, making it suitable for swing trading or avoiding choppy market conditions.
Disclaimer
This indicator is a tool for technical analysis and should not be considered financial advice. All trading involves substantial risk, including the possible loss of principal. Past performance is not indicative of future results. The signals generated by this indicator are for educational and informational purposes only. You are solely responsible for any trading decisions you make. Use this indicator at your own risk.

Trishul Tap Signals (v6) — Liquidity Sweep + Imbalanced RetestTrishul Tap Signals — Liquidity Sweep + Imbalanced Retest
Type: Signal-only indicator (non-repainting)
Style: Price-action + Liquidity + Trend-following
Best for: Intraday & Swing Trading — any liquid market (stocks, futures, crypto, FX)
Timeframes: Any (5m–1D recommended)
Concept
The Trishul Tap setup is a liquidity-driven retest play inspired by order-flow and Smart Money Concepts.
It identifies one-sided impulse candles that also sweep liquidity (grab stops above/below a recent swing), then waits for price to retest the origin of that candle to enter in the trend direction.
Think of it as the three points of a trident:
Trend filter — Only signals with the prevailing trend.
Liquidity sweep — Candle takes out a recent swing high/low (stop-hunt).
Imbalanced retest — Price taps the candle’s open/low (bull) or open/high (bear).
Bullish Setup
Trend Filter: Price above EMA(200).
Impulse Candle:
Green close.
Upper wick ≥ (wickRatio × lower wick).
Lower wick ≤ (oppWickMaxFrac × full range).
Liquidity Sweep: Candle’s high exceeds the highest high of the last sweepLookback bars (excluding current).
Tap Entry: Buy signal triggers when price later taps the candle’s low or open (user choice) within expireBars.
Bearish Setup
Trend Filter: Price below EMA(200).
Impulse Candle:
Red close.
Lower wick ≥ (wickRatio × upper wick).
Upper wick ≤ (oppWickMaxFrac × full range).
Liquidity Sweep: Candle’s low breaks the lowest low of the last sweepLookback bars (excluding current).
Tap Entry: Sell signal triggers when price later taps the candle’s high or open (user choice) within expireBars.
Inputs
Trend EMA Length: Default 200.
Sweep Lookback: Number of bars for liquidity sweep check (default 20).
Wick Ratio: Required size ratio of dominant wick to opposite wick (default 2.0).
Opposite Wick Max %: Opposite wick must be ≤ this fraction of the candle’s range (default 25%).
Tap Tolerance (ticks): How close price must come to the level to count as a tap.
Expire Bars: Max bars after setup to allow a valid tap.
One Signal per Level: If ON, a base is “consumed” after first signal.
Plot Tap Levels: Show horizontal lines for active bases.
Show Setup Labels: Mark the origin sweep candle.
Plots & Visuals
EMA Trend Line — trend filter reference.
Tap Levels —
Green = bullish base (origin candle’s low/open).
Red = bearish base (origin candle’s high/open).
Labels — Show where the setup candle formed.
Signals —
BUY: triangle-up below bar at bullish tap.
SELL: triangle-down above bar at bearish tap.
Alerts
Two built-in conditions:
BUY Signal (Trishul Tap) — triggers on bullish tap.
SELL Signal (Trishul Tap) — triggers on bearish tap.
Set via Alerts panel → Condition = this indicator → Choose signal type.
How to Trade It
Use in liquid markets with clean price structure.
Confirm with HTF structure, volume spikes, or other confluence if desired.
Place stop just beyond the tap level (or ATR-based).
Target 1–2R or trail behind structure.
Why It Works
Liquidity sweep traps traders entering late (breakout buyers or panic sellers) and forces them to exit in the opposite direction, fueling your entry.
Wick imbalance confirms directional aggression by one side.
Trend filter keeps you aligned with the market’s dominant flow.
Retest entry lets you enter at a better price with reduced risk.
Non-Repainting
Setups form only on confirmed bar closes.
Signals trigger only on later bars that tap the stored level.
No lookahead functions are used.
Disclaimer
This script is for educational purposes only and does not constitute financial advice. Test thoroughly in a simulator or demo before using in live markets. Trading involves risk.

T3 JMA KAMA VWMAEnhancing Trading Performance with T3 JMA KAMA VWMA Indicator
Introduction
In the dynamic world of trading, staying ahead of market trends and capitalizing on volume-driven opportunities can greatly influence trading performance. To address this, we have developed the T3 JMA KAMA VWMA Indicator, an innovative tool that modifies the traditional Volume Weighted Moving Average (VWMA) formula to increase responsiveness and exploit high-volume market conditions for optimal position entry. This article delves into the idea behind this modification and how it can benefit traders seeking to gain an edge in the market.
The Idea Behind the Modification
The core concept behind modifying the VWMA formula is to leverage more responsive moving averages (MAs) that align with high-volume market activity. Traditional VWMA utilizes the Simple Moving Average (SMA) as the basis for calculating the weighted average. While the SMA is effective in providing a smoothed perspective of price movements, it may lack the desired responsiveness to capitalize on short-term volume-driven opportunities.
To address this limitation, our T3 JMA KAMA VWMA Indicator incorporates three advanced moving averages: T3, JMA, and KAMA. These MAs offer enhanced responsiveness, allowing traders to react swiftly to changing market conditions influenced by volume.
T3 (T3 New and T3 Normal):
The T3 moving average, one of the components of our indicator, applies a proprietary algorithm that provides smoother and more responsive trend signals. By utilizing T3, we ensure that the VWMA calculation aligns with the dynamic nature of high-volume markets, enabling traders to capture price movements accurately.
JMA (Jurik Moving Average):
The JMA component further enhances the indicator's responsiveness by incorporating phase shifting and power adjustment. This adaptive approach ensures that the moving average remains sensitive to changes in volume and price dynamics. As a result, traders can identify turning points and anticipate potential trend reversals, precisely timing their position entries.
KAMA (Kaufman's Adaptive Moving Average):
KAMA is an adaptive moving average designed to dynamically adjust its sensitivity based on market conditions. By incorporating KAMA into our VWMA modification, we ensure that the moving average adapts to varying volume levels and captures the essence of volume-driven price movements. Traders can confidently enter positions during periods of high trading volume, aligning their strategies with market activity.
Benefits and Usage
The modified T3 JMA KAMA VWMA Indicator offers several advantages to traders looking to exploit high-volume market conditions for position entry:
Increased Responsiveness: By incorporating more responsive moving averages, the indicator enables traders to react quickly to changes in volume and capture short-term opportunities more effectively.
Enhanced Entry Timing: The modified VWMA aligns with high-volume periods, allowing traders to enter positions precisely during price movements influenced by significant trading activity.
Improved Accuracy: The combination of T3, JMA, and KAMA within the VWMA formula enhances the accuracy of trend identification, reversals, and overall market analysis.
Comprehensive Market Insights: The T3 JMA KAMA VWMA Indicator provides a holistic view of market conditions by considering both price and volume dynamics. This comprehensive perspective helps traders make informed decisions.
Analysis and Interpretation
The modified VWMA formula with T3, JMA, and KAMA offers traders a valuable tool for analyzing volume-driven market conditions. By incorporating these advanced moving averages into the VWMA calculation, the indicator becomes more responsive to changes in volume, potentially providing deeper insights into price movements.
When analyzing the modified VWMA, it is essential to consider the following points:
Identifying High-Volume Periods:
The modified VWMA is designed to capture price movements during high-volume periods. Traders can use this indicator to identify potential market trends and determine whether significant trading activity is driving price action. By focusing on these periods, traders may gain a better understanding of the market sentiment and adjust their strategies accordingly.
Confirmation of Trend Strength:
The modified VWMA can serve as a confirmation tool for assessing the strength of a trend. When the VWMA line aligns with the overall trend direction, it suggests that the current price movement is supported by volume. This confirmation can provide traders with additional confidence in their analysis and help them make more informed trading decisions.
Potential Entry and Exit Points:
One of the primary purposes of the modified VWMA is to assist traders in identifying potential entry and exit points. By capturing volume-driven price movements, the indicator can highlight areas where market participants are actively participating, indicating potential opportunities for opening or closing positions. Traders can use this information in conjunction with other technical analysis tools to develop comprehensive trading strategies.
Interpretation of Angle and Gradient:
The modified VWMA incorporates an angle calculation and color gradient to further enhance interpretation. The angle of the VWMA line represents the slope of the indicator, providing insights into the momentum of price movements. A steep angle indicates strong momentum, while a shallow angle suggests a slowdown. The color gradient helps visualize this angle, with green indicating bullish momentum and purple indicating bearish momentum.
Conclusion
By modifying the VWMA formula to incorporate the T3, JMA, and KAMA moving averages, the T3 JMA KAMA VWMA Indicator offers traders an innovative tool to exploit high-volume market conditions for optimal position entry. This modification enhances responsiveness, improves timing, and provides comprehensive market insights.
Enjoy checking it out!
---
Credits to:
◾ @cheatcountry – Hann Window Smoothing
◾ @loxx – T3
◾ @everget – JMA

[SCOPO]Scalping BotEnglish, German is found Below
Scalping Indicator (5min Mostly)
- An Indicator that Creates Possible Trades, created on MA's, Volumebased Support and Ressistance and MACD, The Take Profits are created by a Simple Support and Ressitance Indicator (Built In)
- The Indicator sends with the Alert Function Buy and Sell Signals
- These Signals exists from 3 Entrys, 5 Take Profits and 1 Additional Take Profit who should be used after Entry 2/3 has been filled
- If a Signal gets Invalid or an Entry has been filled ,there comes a new Alert
- The Indicator Plots Lines on the Chart for TP/SL and has an Integrated Backtester table
If you got Questions pls Contact me via PM!
Update Rolled out Today (2.9.2022)
- Its now possible to set your own choosen minimal TP, before was 0.3 % and the next Ressistance above would have been taken for longs
- FilterMA can now be choosen from Different MA's via Dropdown menu
- Length of FilterMA can now be set by user
- Those Changes have been done to make it usefull for higher Timeframes too
German
Scalping Indikator
- Kurzbeschreibung: Ein Indikator der mit EMA & Macd und Volumenbasierten Supports/Ressistance Long - & Shorttrades vorschlägt
- Der Indikator sendet mit der Alarm Funktion Kauf und Verkaufsignale
Diese Signale bestehen aus 3 Entrys, 5 Take Profits sowie 1 Additional Take Profit der Aktiv wird nachdem der Entry 2 / 3 gefüllt wurde
Sollte ein Signal Invalidiert werden dann kommt ein erneuter Alarm
Sollte der 1.Entry gefüllt werden dann kommt auch ein Alarm
- Der Indikator gibt visuell auf dem Chart Linien für TP/SL wieder und besitzt auch ein Integriertes Info Fenster für ehemalige Trades.
- Die TP's werden durch eine eingebaute Support/Ressistance Funktion ausgewählt.
Alle verbesserungsvorschläge bitte per PN an @ridicolous
Update vom 2.9.2022
- Es wurde die möglichkeit mindest TP's zu setzen hinzugefügt
- Die FilterEMA kann nun aus einer Auswahl verschiedener MA's ausgewählt werden
- FilterMA längen können nun angepasstwerden
- Diese Aenderungen wurden hinzugefügt um das Skript auch auf höheren Timeframes laufen lassen zu können
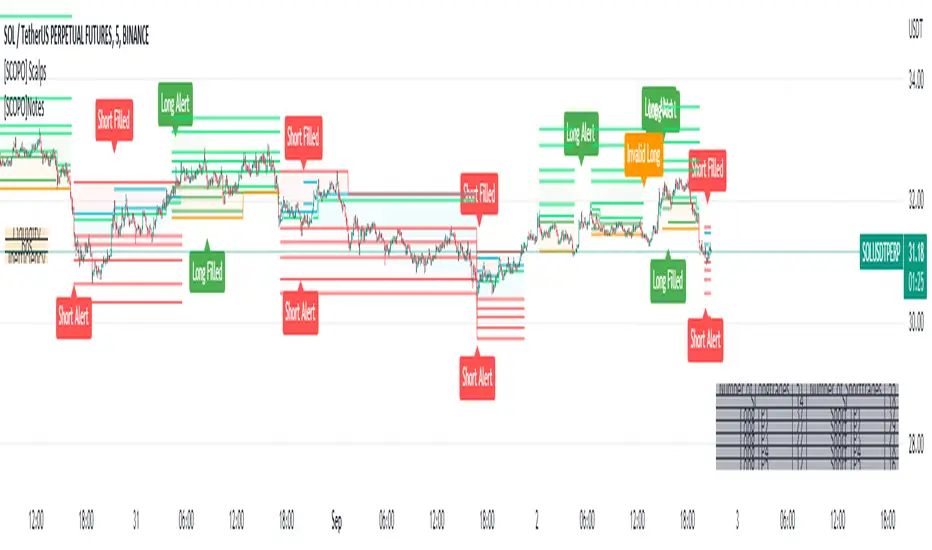
Donchian DipThe Donchian Dip
This strategy is designed to look for good "Buy the Dip" entries on stocks that are clearly in a strong 1-year upward trend. If you do not know how to identify those stocks on your own please do not use this system or continue your education until you do. The Donchian Dip strategy was designed on the daily time frame but works amazingly well on both daily and weekly timeframes. It does still work on intraday charts also if the current trend on the daily chart is in a strong uptrend.
Chart Setup:
3-period Donchian Channel with a 1-period offset (hide basis)
Bollinger Bands with the default settings of 20/2 (display basis)
Entry Signals:
There are 3 different entry signals that will be printed on the chart that have similar underlying criteria but are ranked based on skill level just like ski slope skill levels! I recommend only taking green entries until you are familiar with the system and the stocks you are trading.
Green Easy Entry:
This is the safest buy the dip entry that is normally found at or near a large retracement bottom. You might get one or two bad entries but be persistent and eventually, a great entry will present itself!
These are the specifics for the conditions that trigger a Green entry if you want to know what they are:
1. The current bar is an up bar (green or white bar) and closed above the lower Donchian channel
2. Previous bar or 2 bars back closed below the lower Donchian channel
3. Previous bar or 2 bars back closed below the Bollinger Band Basis (20 SMA )
4. The low of the previous bar or 2 bars back was below the lower Bollinger Band
Blue Intermediate Entry:
This is a decent entry if you missed the green entry, want to add to an existing position, or are not sure it will pull back far enough to even give a green entry. I would suggest only trade these entries to add to an existing pyramid position or get back into a trade that you were recently stopped out of. However, on high-flying stocks like TSLA these signals and the Black Diamond entry signals might be the only ones you get for a long time. Also, on the weekly chart, Blue or Black entries are sometimes all you will get for a year or more.
These are the specifics for the conditions that trigger a Blue entry if you want to know what they are:
1. The current bar is an up bar (green or white bar) and closed above the lower Donchian channel
2. Previous bar or 2 bars back closed below the lower Donchian channel
3. Previous bar or 2 bars back closed below the Bollinger Band Basis (20 SMA )
Black Diamond Advanced Rule:
This is normally just a small pullback re-entry signal on a strong trending stock like TSLA ...trade with extreme caution!!! You have been warned but daredevils feel free to give it a shot. I sometimes do trade these entries if the market and sector of the stock I am trading are extremely bullish or if I am looking to add to a position but I use a conservative stop.
These are the specifics for the conditions that trigger a Black entry if you want to know what they are:
1. The current bar is an up bar (green or white bar) and closed above the lower Donchian channel
2. Previous bar or 2 bars back closed below the lower Donchian channel
3. Previous bar or 2 bars back closed above the Bollinger Band Basis (20 SMA )
Exit Criteria:
The goal of this strategy is to buy the dip and hold as long as possible...let's practice some Paytience and exercise those holding muscles! RLT!!!
So, we don't want to exit early but we also want to protect our profits somehow. We do this by using the built-in trailing stops that are defined by dots of three different shades of purple on the chart (feel free to change these in the settings). Simply move your trailing stop to the highest current dot price level. Do not move the trailing stop down ever even if a lower dot is printed later. These are simply the suggested trailing stops and definitely use your own judgment for exits but if you backtest this strategy enough you will most likely discover that in the long run, these trailing stops work really well.
I hope this strategy helps you to identify good "Buy the Dip" entries on stocks you love as well as trains you to hold your winners longer for bigger gains.
***HOW TO ADD TO YOUR CHARTS***
1) Click the "Add to Favorite Scripts" button
2) Go to a stock chart and click the "Indicators" icon at the top
3) Next, on the left, click the "Favorites" and then click the "Naked Put - Growth Indicator v2"
4) It should appear on your charts, and you can click the "gear" icon on the study to edit a few settings.
5) Read the release notes above so you understand how it works.

Position SizingHello All,
This script can be used for Position Sizing.
After you entered Capital you have, how much you can Risk per Trade, Profit and Stoploss Levels, it calculates Number of Buys/Sells, Position Size and Reward/Risk ratio. you need to choose one of "Long" or "Short" position you will take.
Number of Buys formula = Capital * RiskPerTrade / Loss
Position Size = NumberOfBuys * EntryPrice
Reward / Risk rate = (TargetPrice - EntryPrice) / (EntryPrice - StoplossPrice)
Enjoy!

Market Regime# MARKET REGIME IDENTIFICATION & TRADING SYSTEM
## Complete User Guide
---
## 📋 TABLE OF CONTENTS
1. (#overview)
2. (#regimes)
3. (#indicator-usage)
4. (#entry-signals)
5. (#exit-signals)
6. (#regime-strategies)
7. (#confluence)
8. (#backtesting)
9. (#optimization)
10. (#examples)
---
## OVERVIEW
### What This System Does
This is a **complete market regime identification and trading system** that:
1. **Identifies 6 distinct market regimes** automatically
2. **Adapts trading tactics** to each regime
3. **Provides high-probability entry signals** with confluence scoring
4. **Shows optimal exit points** for each trade
5. **Can be backtested** to validate performance
### Two Components Provided
1. **Indicator** (`market_regime_indicator.pine`)
- Visual regime identification
- Entry/exit signals on chart
- Dynamic support/resistance
- Info tables with live data
- Use for manual trading
2. **Strategy** (`market_regime_strategy.pine`)
- Fully automated backtestable version
- Same logic as indicator
- Position sizing and risk management
- Performance metrics
- Use for backtesting and automation
---
## THE 6 MARKET REGIMES
### 1. 🟢 BULL TRENDING
**Characteristics:**
- Strong uptrend
- Price above SMA50 and SMA200
- ADX > 25 (strong trend)
- Higher highs and higher lows
- DI+ > DI- (bullish momentum)
**What It Means:**
- Market has clear upward direction
- Buyers in control
- Pullbacks are buying opportunities
- Strongest regime for long positions
**How to Trade:**
- ✅ **BUY dips to EMA20 or SMA20**
- ✅ Enter when RSI < 60 on pullback
- ✅ Hold through minor corrections
- ❌ Don't short against the trend
- ❌ Don't sell too early
**Expected Behavior:**
- Pullbacks are shallow (5-10%)
- Bounces are strong
- Support at moving averages holds
- Volume increases on rallies
---
### 2. 🔴 BEAR TRENDING
**Characteristics:**
- Strong downtrend
- Price below SMA50 and SMA200
- ADX > 25 (strong trend)
- Lower highs and lower lows
- DI- > DI+ (bearish momentum)
**What It Means:**
- Market has clear downward direction
- Sellers in control
- Rallies are selling opportunities
- Strongest regime for short positions
**How to Trade:**
- ✅ **SELL rallies to EMA20 or SMA20**
- ✅ Enter when RSI > 40 on bounce
- ✅ Hold through minor bounces
- ❌ Don't buy against the trend
- ❌ Don't cover shorts too early
**Expected Behavior:**
- Rallies are weak (5-10%)
- Selloffs are strong
- Resistance at moving averages holds
- Volume increases on declines
---
### 3. 🔵 BULL RANGING
**Characteristics:**
- Bullish bias but consolidating
- Price near or above SMA50
- ADX < 20 (weak trend)
- Trading in range
- Choppy price action
**What It Means:**
- Uptrend is pausing
- Accumulation phase
- Support and resistance zones clear
- Lower volatility
**How to Trade:**
- ✅ **BUY at support zone**
- ✅ Enter when RSI < 40
- ✅ Take profits at resistance
- ⚠️ Smaller position sizes
- ⚠️ Tighter stops
**Expected Behavior:**
- Range-bound oscillations
- Support bounces repeatedly
- Resistance rejections common
- Eventually breaks higher (usually)
---
### 4. 🟠 BEAR RANGING
**Characteristics:**
- Bearish bias but consolidating
- Price near or below SMA50
- ADX < 20 (weak trend)
- Trading in range
- Choppy price action
**What It Means:**
- Downtrend is pausing
- Distribution phase
- Support and resistance zones clear
- Lower volatility
**How to Trade:**
- ✅ **SELL at resistance zone**
- ✅ Enter when RSI > 60
- ✅ Take profits at support
- ⚠️ Smaller position sizes
- ⚠️ Tighter stops
**Expected Behavior:**
- Range-bound oscillations
- Resistance holds repeatedly
- Support bounces are weak
- Eventually breaks lower (usually)
---
### 5. ⚪ CONSOLIDATION
**Characteristics:**
- No clear direction
- Range compression
- Very low ADX (< 15 often)
- Price inside tight range
- Neutral sentiment
**What It Means:**
- Market is coiling
- Building energy for next move
- Indecision between buyers/sellers
- Calm before the storm
**How to Trade:**
- ✅ **WAIT for breakout direction**
- ✅ Enter on high-volume breakout
- ✅ Direction becomes clear
- ❌ Don't trade inside the range
- ❌ Avoid choppy scalping
**Expected Behavior:**
- Narrow range
- Low volume
- False breakouts possible
- Explosive move when it breaks
---
### 6. 🟣 CHAOS (High Volatility)
**Characteristics:**
- Extreme volatility
- No clear direction
- Erratic price swings
- ATR > 2x average
- Unpredictable
**What It Means:**
- Market panic or euphoria
- News-driven moves
- Emotion dominates logic
- Highest risk environment
**How to Trade:**
- ❌ **STAY OUT!**
- ❌ No positions
- ❌ Wait for stability
- ✅ Protect existing positions
- ✅ Reduce risk
**Expected Behavior:**
- Large intraday swings
- Gaps up/down
- Stop hunts
- Whipsaws
- Eventually calms down
---
## INDICATOR USAGE
### Visual Elements
#### 1. Background Colors
- **Light Green** = Bull Trending (go long)
- **Light Red** = Bear Trending (go short)
- **Light Teal** = Bull Ranging (buy dips)
- **Light Orange** = Bear Ranging (sell rallies)
- **Light Gray** = Consolidation (wait)
- **Purple** = Chaos (stay out!)
#### 2. Regime Labels
- Appear when regime changes
- Show new regime name
- Positioned at highs (bullish) or lows (bearish)
#### 3. Entry Signals
- **Green "LONG"** labels = Buy here
- **Red "SHORT"** labels = Sell here
- Number shows confluence score (X/5 signals)
- Hover for details (stop, target, RSI, etc.)
#### 4. Exit Signals
- **Orange "EXIT LONG"** = Close long position
- **Orange "EXIT SHORT"** = Close short position
- Shows exit reason in tooltip
#### 5. Support/Resistance Lines
- **Green line** = Dynamic support (buy zone)
- **Red line** = Dynamic resistance (sell zone)
- Adapts to regime automatically
#### 6. Moving Averages
- **Blue** = SMA 20 (short-term trend)
- **Orange** = SMA 50 (medium-term trend)
- **Purple** = SMA 200 (long-term trend)
### Information Tables
#### Top Right Table (Main Info)
Shows real-time market conditions:
- **Current Regime** - What regime we're in
- **Bias** - Long, Short, Breakout, or Stay Out
- **ADX** - Trend strength (>25 = strong)
- **Trend** - Strong, Moderate, or Weak
- **Volatility** - High or Normal
- **Vol Ratio** - Current vs average volatility
- **RSI** - Momentum (>70 overbought, <30 oversold)
- **vs SMA50/200** - Price position relative to MAs
- **Support/Resistance** - Exact price levels
- **Long/Short Signals** - Confluence scores (X/5)
#### Bottom Right Table (Regime Guide)
Quick reference for each regime:
- What action to take
- What strategy to use
- Color-coded for quick identification
---
## ENTRY SIGNALS EXPLAINED
### Confluence Scoring System (5 Factors)
Each entry signal is scored 0-5 based on how many factors align:
#### For LONG Entries:
1. ✅ **Regime Alignment** - In Bull Trending or Bull Ranging
2. ✅ **RSI Pullback** - RSI between 35-50 (not overbought)
3. ✅ **Near Support** - Price within 2% of dynamic support
4. ✅ **MACD Turning Up** - Momentum shifting bullish
5. ✅ **Volume Confirmation** - Above average volume
#### For SHORT Entries:
1. ✅ **Regime Alignment** - In Bear Trending or Bear Ranging
2. ✅ **RSI Rejection** - RSI between 50-65 (not oversold)
3. ✅ **Near Resistance** - Price within 2% of dynamic resistance
4. ✅ **MACD Turning Down** - Momentum shifting bearish
5. ✅ **Volume Confirmation** - Above average volume
### Confluence Requirements
**Minimum Confluence** (default = 2):
- 2/5 = Entry signal triggered
- 3/5 = Good signal
- 4/5 = Strong signal
- 5/5 = Excellent signal (rare)
**Higher confluence = Higher probability = Better trades**
### Specific Entry Patterns
#### 1. Bull Trending Entry
```
Requirements:
- Regime = Bull Trending
- Price pulls back to EMA20
- Close above EMA20 (bounce)
- Up candle (close > open)
- RSI < 60
- Confluence ≥ 2
```
#### 2. Bear Trending Entry
```
Requirements:
- Regime = Bear Trending
- Price rallies to EMA20
- Close below EMA20 (rejection)
- Down candle (close < open)
- RSI > 40
- Confluence ≥ 2
```
#### 3. Bull Ranging Entry
```
Requirements:
- Regime = Bull Ranging
- RSI < 40 (oversold)
- Price at or below support
- Up candle (reversal)
- Confluence ≥ 1 (more lenient)
```
#### 4. Bear Ranging Entry
```
Requirements:
- Regime = Bear Ranging
- RSI > 60 (overbought)
- Price at or above resistance
- Down candle (rejection)
- Confluence ≥ 1 (more lenient)
```
#### 5. Consolidation Breakout
```
Requirements:
- Regime = Consolidation
- Price breaks above/below range
- Volume > 1.5x average (explosive)
- Strong directional candle
```
---
## EXIT SIGNALS EXPLAINED
### Three Types of Exits
#### 1. Regime Change Exits (Automatic)
- **Long Exit**: Regime changes to Bear Trending or Chaos
- **Short Exit**: Regime changes to Bull Trending or Chaos
- **Reason**: Market character changed, strategy no longer valid
#### 2. Support/Resistance Break Exits
- **Long Exit**: Price breaks below support by 2%
- **Short Exit**: Price breaks above resistance by 2%
- **Reason**: Key level violated, trend may be reversing
#### 3. Momentum Exits
- **Long Exit**: RSI > 70 (overbought) AND down candle
- **Short Exit**: RSI < 30 (oversold) AND up candle
- **Reason**: Overextension, take profits
### Stop Loss & Take Profit
**Stop Loss** (Automatic in strategy):
- Placed at Entry - (ATR × 2)
- Adapts to volatility
- Protected from whipsaws
- Typically 2-4% for stocks, 5-10% for crypto
**Take Profit** (Automatic in strategy):
- Placed at Entry + (Stop Distance × R:R Ratio)
- Default 2.5:1 reward:risk
- Example: $2 risk = $5 reward target
- Allows winners to run
---
## TRADING EACH REGIME
### BULL TRENDING - Most Profitable Long Environment
**Strategy: Buy Every Dip**
**Entry Rules:**
1. Wait for pullback to EMA20 or SMA20
2. Look for RSI < 60
3. Enter when candle closes above MA
4. Confluence should be 2+
**Stop Loss:**
- Below the recent swing low
- Or 2 × ATR below entry
**Take Profit:**
- At previous high
- Or 2.5:1 R:R minimum
**Position Size:**
- Can use full size (2% risk)
- High win rate regime
**Example Trade:**
```
Price: $100, pulls back to $98 (EMA20)
Entry: $98.50 (close above EMA)
Stop: $96.50 (2 ATR)
Target: $103.50 (2.5:1)
Risk: $2, Reward: $5
```
---
### BEAR TRENDING - Most Profitable Short Environment
**Strategy: Sell Every Rally**
**Entry Rules:**
1. Wait for bounce to EMA20 or SMA20
2. Look for RSI > 40
3. Enter when candle closes below MA
4. Confluence should be 2+
**Stop Loss:**
- Above the recent swing high
- Or 2 × ATR above entry
**Take Profit:**
- At previous low
- Or 2.5:1 R:R minimum
**Position Size:**
- Can use full size (2% risk)
- High win rate regime
**Example Trade:**
```
Price: $100, rallies to $102 (EMA20)
Entry: $101.50 (close below EMA)
Stop: $103.50 (2 ATR)
Target: $96.50 (2.5:1)
Risk: $2, Reward: $5
```
---
### BULL RANGING - Buy Low, Sell High
**Strategy: Range Trading (Long Bias)**
**Entry Rules:**
1. Wait for price at support zone
2. Look for RSI < 40
3. Enter on reversal candle
4. Confluence should be 1-2+
**Stop Loss:**
- Below support zone
- Tighter than trending (1.5 ATR)
**Take Profit:**
- At resistance zone
- Don't hold through resistance
**Position Size:**
- Reduce to 1-1.5% risk
- Lower win rate than trending
**Example Trade:**
```
Range: $95-$105
Entry: $96 (at support, RSI 35)
Stop: $94 (below support)
Target: $104 (at resistance)
Risk: $2, Reward: $8 (4:1)
```
---
### BEAR RANGING - Sell High, Buy Low
**Strategy: Range Trading (Short Bias)**
**Entry Rules:**
1. Wait for price at resistance zone
2. Look for RSI > 60
3. Enter on rejection candle
4. Confluence should be 1-2+
**Stop Loss:**
- Above resistance zone
- Tighter than trending (1.5 ATR)
**Take Profit:**
- At support zone
- Don't hold through support
**Position Size:**
- Reduce to 1-1.5% risk
- Lower win rate than trending
**Example Trade:**
```
Range: $95-$105
Entry: $104 (at resistance, RSI 65)
Stop: $106 (above resistance)
Target: $96 (at support)
Risk: $2, Reward: $8 (4:1)
```
---
### CONSOLIDATION - Wait for Breakout
**Strategy: Breakout Trading**
**Entry Rules:**
1. Identify consolidation range
2. Wait for VOLUME SURGE (1.5x+ avg)
3. Enter on close outside range
4. Direction must be clear
**Stop Loss:**
- Opposite side of range
- Or 2 ATR
**Take Profit:**
- Measure range height, project it
- Example: $10 range = $10 move expected
**Position Size:**
- Reduce to 1% risk
- 50% false breakout rate
**Example Trade:**
```
Consolidation: $98-$102 (4-point range)
Breakout: $102.50 (high volume)
Entry: $103
Stop: $100 (back in range)
Target: $107 (4-point range projected)
Risk: $3, Reward: $4
```
---
### CHAOS - STAY OUT!
**Strategy: Preservation**
**What to Do:**
- ❌ NO new positions
- ✅ Close existing positions if near entry
- ✅ Tighten stops on profitable trades
- ✅ Reduce position sizes dramatically
- ✅ Wait for regime to stabilize
**Why It's Dangerous:**
- Stop hunts are common
- Whipsaws everywhere
- News-driven volatility
- No technical reliability
- Even "perfect" setups fail
**When Does It End:**
- Volatility ratio drops < 1.5
- ADX starts rising (direction appears)
- Price respects support/resistance again
- Usually 1-5 days
---
## CONFLUENCE SYSTEM
### How It Works
The system scores each potential entry on 5 factors. More factors aligning = higher probability.
### Confluence Requirements by Regime
**Trending Regimes** (strictest):
- Minimum 2/5 required
- 3/5 = Good
- 4-5/5 = Excellent
**Ranging Regimes** (moderate):
- Minimum 1-2/5 required
- 2/5 = Good
- 3+/5 = Excellent
**Consolidation** (breakout only):
- Volume is most critical
- Direction confirmation
- Less confluence needed
### Adjusting Minimum Confluence
**If too few signals:**
- Lower from 2 to 1
- More trades, lower quality
**If too many false signals:**
- Raise from 2 to 3
- Fewer trades, higher quality
**Recommendation:**
- Start at 2
- Adjust based on win rate
- Aim for 55-65% win rate
---
## STRATEGY BACKTESTING
### Loading the Strategy
1. Copy `market_regime_strategy.pine`
2. Open Pine Editor in TradingView
3. Paste and "Add to Chart"
4. Strategy Tester tab opens at bottom
### Initial Settings
```
Risk Per Trade: 2%
ATR Stop Multiplier: 2.0
Reward:Risk Ratio: 2.5
Trade Longs: ✓
Trade Shorts: ✓
Trade Trending Only: ✗ (test both)
Avoid Chaos: ✓
Minimum Confluence: 2
```
### What to Look For
**Good Results:**
- Win Rate: 50-60%
- Profit Factor: 1.8-2.5
- Net Profit: Positive
- Max Drawdown: <20%
- Consistent equity curve
**Warning Signs:**
- Win Rate: <45% (too many losses)
- Profit Factor: <1.5 (barely profitable)
- Max Drawdown: >30% (too risky)
- Erratic equity curve (unstable)
### Testing Different Regimes
**Test 1: Trending Only**
```
Trade Trending Only: ✓
Result: Higher win rate, fewer trades
```
**Test 2: All Regimes**
```
Trade Trending Only: ✗
Result: More trades, potentially lower win rate
```
**Test 3: Long Only**
```
Trade Longs: ✓
Trade Shorts: ✗
Result: Works in bull markets
```
**Test 4: Short Only**
```
Trade Longs: ✗
Trade Shorts: ✓
Result: Works in bear markets
```
---
## SETTINGS OPTIMIZATION
### Key Parameters to Adjust
#### 1. Risk Per Trade (Most Important)
- **0.5%** = Very conservative
- **1.0%** = Conservative (recommended for beginners)
- **2.0%** = Moderate (recommended)
- **3.0%** = Aggressive
- **5.0%** = Very aggressive (not recommended)
**Impact:** Higher risk = higher returns BUT bigger drawdowns
#### 2. Reward:Risk Ratio
- **2:1** = More wins needed, hit target faster
- **2.5:1** = Balanced (recommended)
- **3:1** = Fewer wins needed, hold longer
- **4:1** = Very patient, best in trending
**Impact:** Higher R:R = can have lower win rate
#### 3. Minimum Confluence
- **1** = More signals, lower quality
- **2** = Balanced (recommended)
- **3** = Fewer signals, higher quality
- **4** = Very selective
- **5** = Almost never triggers
**Impact:** Higher = fewer but better trades
#### 4. ADX Thresholds
- **Trending: 20-30** (default 25)
- Lower = detect trends earlier
- Higher = only strong trends
- **Ranging: 15-25** (default 20)
- Lower = identify ranging earlier
- Higher = only weak trends
#### 5. Trend Period (SMA)
- **20-50** = Short-term trends
- **50** = Medium-term (default, recommended)
- **100-200** = Long-term trends
**Impact:** Longer period = slower regime changes, more stable
### Optimization Workflow
**Step 1: Baseline**
- Use all default settings
- Test on 3+ years
- Record: Win Rate, PF, Drawdown
**Step 2: Risk Optimization**
- Test 1%, 1.5%, 2%, 2.5%
- Find best risk-adjusted return
- Balance profit vs drawdown
**Step 3: R:R Optimization**
- Test 2:1, 2.5:1, 3:1
- Check which maximizes profit factor
- Consider holding time
**Step 4: Confluence Optimization**
- Test 1, 2, 3
- Find sweet spot for win rate
- Aim for 55-65% win rate
**Step 5: Regime Filter**
- Test with/without trend filter
- Test with/without chaos filter
- Find what works for your asset
---
## REAL TRADING EXAMPLES
### Example 1: Bull Trending - SPY
**Setup:**
- Regime: BULL TRENDING
- Price pulls back from $450 to $445
- EMA20 at $444
- RSI drops to 45
- Confluence: 4/5
**Entry:**
- Price closes at $445.50 (above EMA20)
- LONG signal appears
- Enter at $445.50
**Risk Management:**
- Stop: $443 (2 ATR = $2.50)
- Target: $451.75 (2.5:1 = $6.25)
- Risk: $2.50 per share
- Position: 80 shares (2% of $10k = $200 risk)
**Outcome:**
- Price rallies to $452 in 3 days
- Target hit
- Profit: $6.50 × 80 = $520
- Return: 2.6 × risk (excellent)
---
### Example 2: Bear Ranging - AAPL
**Setup:**
- Regime: BEAR RANGING
- Range: $165-$175
- Price rallies to $174
- Resistance at $175
- RSI at 68
- Confluence: 3/5
**Entry:**
- Rejection candle at $174
- SHORT signal appears
- Enter at $173.50
**Risk Management:**
- Stop: $176 (above resistance)
- Target: $166 (support)
- Risk: $2.50
- Position: 80 shares
**Outcome:**
- Price drops to $167 in 2 days
- Target hit
- Profit: $6.50 × 80 = $520
- Return: 2.6 × risk
---
### Example 3: Consolidation Breakout - BTC
**Setup:**
- Regime: CONSOLIDATION
- Range: $28,000 - $30,000
- Compressed for 2 weeks
- Volume declining
**Breakout:**
- Price breaks $30,000
- Volume surges 200%
- Close at $30,500
- LONG signal
**Entry:**
- Enter at $30,500
**Risk Management:**
- Stop: $29,500 (back in range)
- Target: $32,000 (range height = $2k)
- Risk: $1,000
- Position: 0.2 BTC ($200 risk on $10k)
**Outcome:**
- Price runs to $33,000
- Target exceeded
- Profit: $2,500 × 0.2 = $500
- Return: 2.5 × risk
---
### Example 4: Avoiding Chaos - Tesla
**Setup:**
- Regime: BULL TRENDING
- LONG position from $240
- Elon tweets something crazy
- Regime changes to CHAOS
**Action:**
- EXIT signal appears
- Close position immediately
- Current price: $242 (small profit)
**Outcome:**
- Next 3 days: wild swings
- High $255, Low $230
- By staying out, avoided:
- Potential stop out
- Whipsaw losses
- Stress
**Result:**
- Small profit preserved
- Capital protected
- Re-enter when regime stabilizes
---
## ALERTS SETUP
### Available Alerts
1. **Bull Trending Regime** - Market goes bullish
2. **Bear Trending Regime** - Market goes bearish
3. **Chaos Regime** - High volatility, stay out
4. **Long Entry Signal** - Buy opportunity
5. **Short Entry Signal** - Sell opportunity
6. **Long Exit Signal** - Close long
7. **Short Exit Signal** - Close short
### How to Set Up
1. Click **⏰ (Alert)** icon in TradingView
2. Select **Condition**: Choose indicator + alert type
3. **Options**: Popup, Email, Webhook, etc.
4. **Message**: Customize notification
5. Click **Create**
### Recommended Alert Strategy
**For Active Traders:**
- Long Entry Signal
- Short Entry Signal
- Long Exit Signal
- Short Exit Signal
**For Position Traders:**
- Bull Trending Regime (enter longs)
- Bear Trending Regime (enter shorts)
- Chaos Regime (exit all)
**For Conservative:**
- Only regime change alerts
- Manually review entries
- More selective
---
## TIPS FOR SUCCESS
### 1. Start Small
- Paper trade first
- Then 0.5% risk
- Build to 1-2% over time
### 2. Follow the Regime
- Don't fight it
- Adapt your style
- Different tactics for each
### 3. Trust the Confluence
- 4-5/5 = Best trades
- 2-3/5 = Good trades
- 1/5 = Skip unless desperate
### 4. Respect Exits
- Don't hope and hold
- Cut losses quickly
- Take profits at targets
### 5. Avoid Chaos
- Seriously, just stay out
- Protect your capital
- Wait for clarity
### 6. Keep a Journal
- Record every trade
- Note regime and confluence
- Review weekly
- Learn patterns
### 7. Backtest Thoroughly
- 3+ years minimum
- Multiple market conditions
- Different assets
- Walk-forward test
### 8. Be Patient
- Best setups are rare
- 1-3 trades per week is normal
- Quality over quantity
- Compound over time
---
## COMMON QUESTIONS
**Q: How many trades per month should I expect?**
A: Depends on timeframe and settings. Daily chart: 5-15 trades/month. 4H chart: 15-30 trades/month.
**Q: What's a good win rate?**
A: 55-65% is excellent. 50-55% is good. Below 50% needs adjustment.
**Q: Should I trade all regimes?**
A: Beginners: Only trending. Intermediate: Trending + ranging. Advanced: All except chaos.
**Q: Can I use this on any timeframe?**
A: Best on Daily and 4H. Works on 1H with more noise. Not recommended <1H.
**Q: What if I'm in a trade and regime changes?**
A: Exit immediately (if using indicator) or let strategy handle it automatically.
**Q: How do I know if I'm over-optimizing?**
A: If results are perfect on one period but fail on another. Use walk-forward testing.
**Q: Should I always take 5/5 confluence trades?**
A: Yes, but they're rare (1-2/month). Don't wait only for these.
**Q: Can I combine this with other indicators?**
A: Yes, but keep it simple. RSI, MACD already included. Maybe add volume profile.
**Q: What assets work best?**
A: Liquid stocks, major crypto, futures. Avoid forex spot (use futures), penny stocks.
**Q: How long to hold positions?**
A: Trending: Days to weeks. Ranging: Hours to days. Breakout: Days. Let the regime guide you.
---
## FINAL THOUGHTS
This system gives you:
- ✅ Clear market context (regime)
- ✅ High-probability entries (confluence)
- ✅ Defined exits (automatic signals)
- ✅ Adaptable tactics (regime-specific)
- ✅ Backtestable results (strategy version)
**Success requires:**
- 📚 Understanding each regime
- 🎯 Following the signals
- 💪 Discipline to wait
- 🧠 Emotional control
- 📊 Proper risk management
**Start your journey:**
1. Load the indicator
2. Watch for 1 week (no trading)
3. Identify regime patterns
4. Paper trade for 1 month
5. Go live with small size
6. Scale up as you gain confidence
**Remember:** The market will always be here. There's no rush. Master one regime at a time, and you'll be profitable in all conditions!
Good luck! 🚀
