Inside Breakout PerQuantumCoin Premium Indicator (strategy)HOW IT WORKS:
- The Inside Breakout gives signals on the chart on the breakout of inside bar chart pattern;
- It allows to trade trend or counter-trend signals;
- Computes intrinsic values to access the strength of the Buy/Sell signal;
- Allows users to adjust their own settings, adapting the signals produced;
- These signals can be also set up as Alerts;
- The indicator has a few custom features that allows users to filter out signals using multi-timeframe trend indicator and to keep tracking positions so that one can only get new signals when they reserve position;
This Strategy version is meant to be a companion to the main indicator in order to backtest your SLT/TP settings with different instruments and adapt results.
Please NOTE:
Results may vary depending on TP/SL settings. Also, previous performance is not a indicator for future results.
스크립트에서 "breakout"에 대해 찾기

Pivot Point BreakoutThis is a strategy taken from Perry Kaufman's book, Trading Systems and Methods.
Just like the title says, it's a breakout strategy. It works by buying when the current high is higher than the last pivot high, and selling when the low is lower than the last pivot low.
It does not have a good success probability, and relies on the good reward to risk ratio. Definitely not recommended for someone with weak hands.

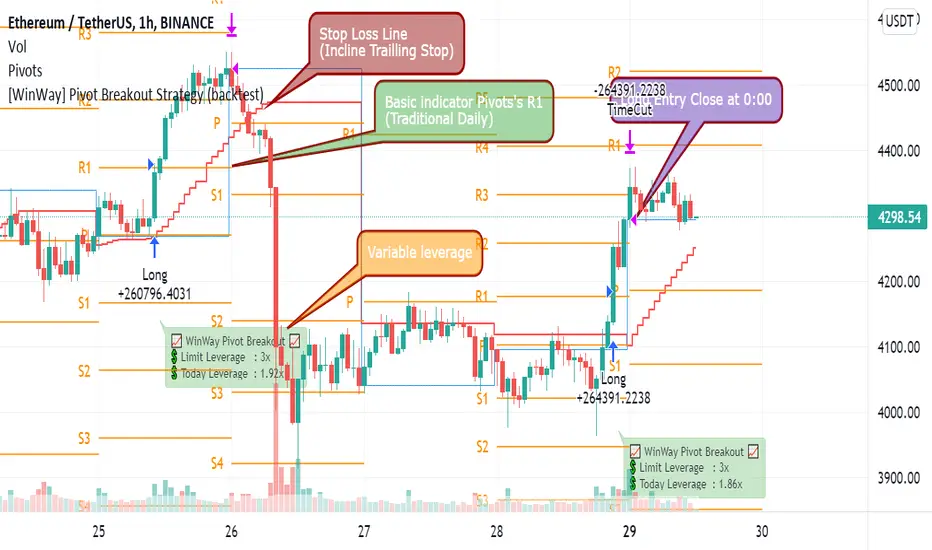
[WinWay] Pivot Breakout Strategy (backtest)This is the Winway's Pivot breaktout,
Using the Pivot point , we made a new volatility breakout strategy.
It's the strategy for ETH / BTC.
Please choose 1H time frame.
No repaint.
"As a long-only day trend strategy, we pursue profits in the downward / transverse / rising market."
- It will be exited based on the closing price of the day as a strategy to take only the day trend.
- It's a long-only strategy without short trade.
- It has high market adaptability in response to market volatility .
"The efficiency has been increased by delicate control of entry volume ."
- Control losses by managing funds in line with market changes.
- Calculate the leverage on the real time automatically.
- It goes in more when it's advantageous and less when it's disadvantageous
- It's a welfare strategy that works against assets
"We further lowered the risk by cutting off in installments."
- If you judge that the trend has declined on the day, you will break off and respond to a sharp drop by using the real time trailing stop.
========================================================================================
윈웨이의 피봇돌파입니다.
피봇 포인트를 이용한 새로운 변동성 돌파 전략입니다.
이더리움과 비트코인을 위한 전략이며
1H 타임프레임으로 선택해주세요
리페인트는 발생하지 않습니다.
롱 온리 당일 추세 전략으로 하락/횡보/상승 장에서 수익을 추구합니다.
- 당일 추세만 취하는 전략으로 일봉 종가 기준 청산됩니다.
- 숏은 없는 롱 온리 전략입니다.
- 시장 변동성에 따라 대응하여 시장 적응력이 높습니다.섬세한 진입 물량 제어로 효율을 높였습니다.
- 시장 변화에 맞춰 자금관리를 하여 손실을 제어합니다.
- 당일 레버리지를 실시간으로 자동 계산합니다.
- 유리할때 더 들어가고, 불리할때 적게 들어갑니다.
- 자산대비로 작동하는 복리 전략입니다.
손절로 리스크를 더욱 낮췄습니다.
- 당일 추세가 꺾였다고 판단하면 손절하여, 실시간 트레일링 스탑을 이용하여 급락에 대응합니다.
Breakout in 20 daysbreakout condition
1. current close price must be higher than all close prices in 20 days
2. close prices change in 20 days must be less than 20%
3. current volume must be greater than previous volume by 10%
ブレイクアウト条件
1. 最新の終値が直近20日のすべての終値より高い
2. 直近X日の終値の変動率が20%以下
3. 最新の出来高が前日の出来高より10%大きい

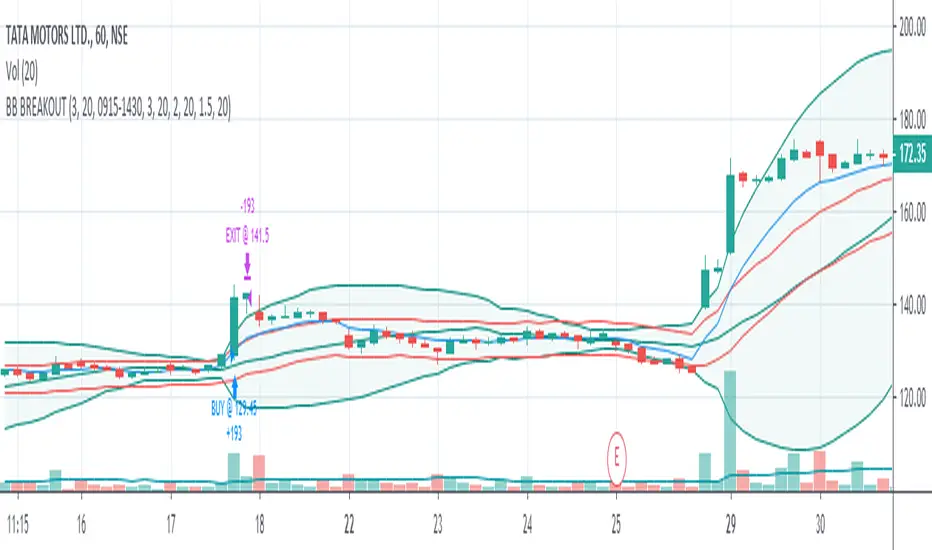
Open Range Breakout with TSLThis ORB with TSL Indicator Session Time is Indian NSE and BSE Equity Market
This indicator Provide you 2 type Setup
Opening Range Plot Only for Observation
1st Range Breakout = Long
2nd Range Breakout = Short
How to work This Indicator?
When Market is Open This Indicator automatically Plot Opening Range High and Low,
if Market bullish & Candle Close above Opening Range high When This Indicator automatically Plot 1st Range High and Low if You Want to 1st Range High Plot Crossingup any Candle You can Also Add Alerts
if Market Bearish & Candle Close Below Opening Range Low When This Indicator automatically Plot 2nd Range High and Low if You Want to 2nd Range Low Plot CrossingDown any Candle You can Also Add Alerts
If you Have any Suggestion please mention here
Thank you so much
This Also Automatically start trailing SL on basis of ATR

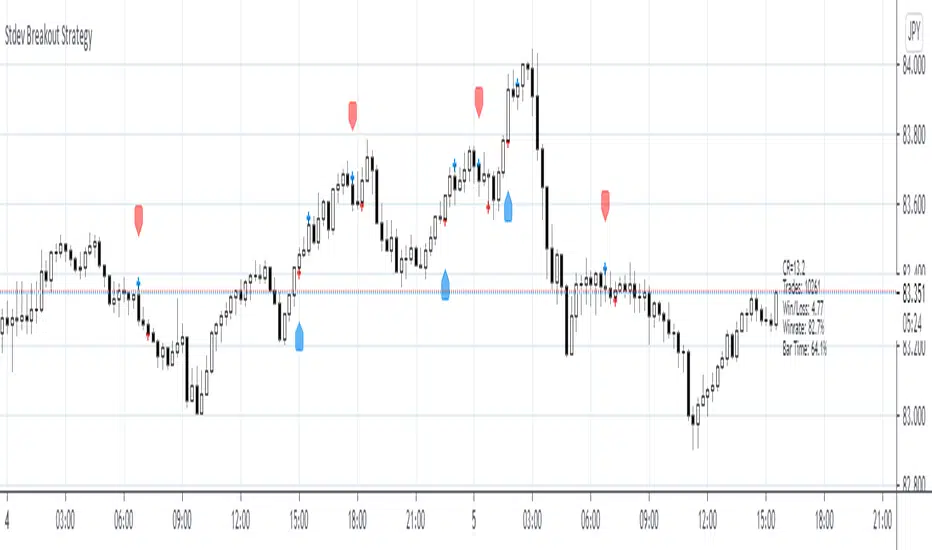
Stdev Breakout StrategyStdev Breakout Strategy
Description:
This script generates a long entry signal when the Standard Deviation crosses over the Simple Moving Average and the Close is greater than the Open, and/or generates a short entry signal when the Standard Deviation crosses under the Simple Moving Average and the Close is less than the Open.
Ravih Pro Trend BreakoutThis is a Trend Breakout Strategy on “DAILY Time-frame”
This Strategy is designed keeping in mind with Medium to Long Term traders. The strategy works only on Daily Time-frame and on Closing Price.
The concept here is to identify assets with potential change in trend. Primary focus is to position for the big move. There are times... trying to catch every trend, many of which can be unprofitable especially in side-way market. However, the primary purpose of this strategy is to catch all the major trend movements, which are much more profitable than minor market losses in all the side-way market.
I’ve simplified it to make it user-friendly.
How to use?
Set it to Daily Time-frame.
Buy, Take Profit 1,2,3 and Exit signals are included on chart based on the current Trend direction. The system shows an Exit signal if the system’s exit conditions are met. It works only on Daily Time-frame and on Closing Price.
Dark Blue Up Triangle denotes Buy at the Closing Price. Entry Price is Closing Price or with + or – 2% tolerance of the Closing Price for the following market day.
Purple Down Triangle denotes Exit to close any remaining position to free up capital.
Little Green Up Triangles denote the Bulls are in Control and Overpowering the Bears and represents minor Buying opportunities with strong probability of continuing up-moves.
Setting Up Alerts
The user has the option to Setup Alerts for all chart signals that is…
For Buy, for Exit, for Take Profit 1 set at 24%, for Take Profit 2 set at 48% and for Take Profit 3 set at 72%
The user also has the option to adjust the Take Profit as per their desire. However, the predetermined Take Profit set for this strategy does work reasonably well.
Remember...
This strategy is only built for stocks. It is Not for Indices neither for any other financial instruments.
No SHORT signals in this strategy.

True Range Breakout [racer8]TRB (True Range Breakout) plots the current TR (true range) as well as the previous TR high over n periods. If the current TR is greater than the previous TR high, then the TR histogram will become red. Red signals high volatility. Enter trades only when the histogram is above the TR high line. Happy trading! 🥳

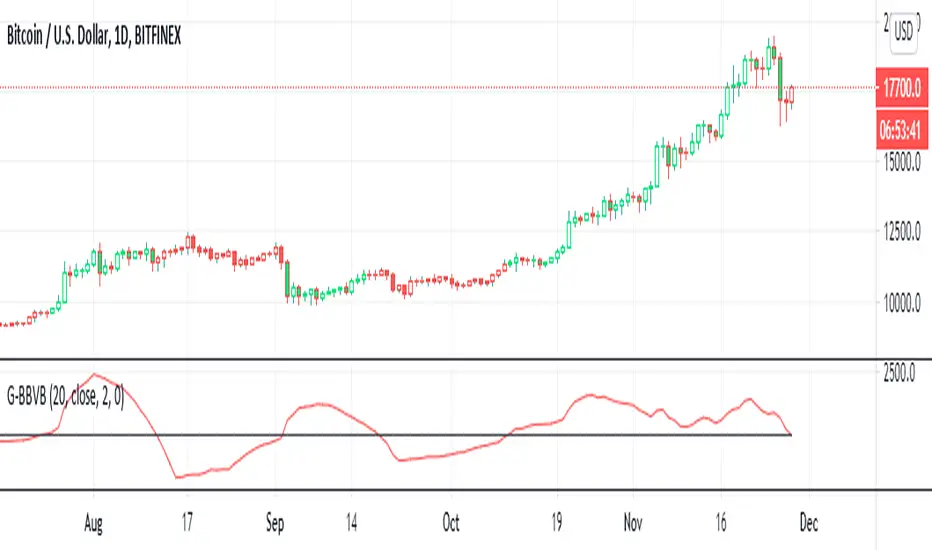
G-Bollinger bands volatility breakout v.1This is my frist publish scrpit. I developed this indicator origin is BB. It make from easy idea but powerful for sideway to breakout
1. I findout volatility by upper band of BB - lower band of BB (I called "Aline")
2. I created SMA of Aline (I called Bline)
3. I created the special line is "Cline" from Aline - Bline
4. I created 0 line " Baseline "
G-BBvB is the very good indicator to detect low volatility to begin the volatility = Buy signal
Now I can't find the sell signal form indicator. I try backtest sell at Cline cross zeroline but it not work.
I'll develop "G" indicator for free .
Goodluck :D
Session Range and Breakout Summary
This script presents the session range and post session movements relative to that range of all the majors and crosses on a single page. You can also set it to a daily range and weekly range (beta). It will even show you the pip value of the range. I made the indicator to easily stay on top of market movements at london open relative to the Asia session range. Its very easy to see which entire currency group is breaking its asia range WHIST ITS HAPPENING. Focus on NZD in the examples as it was the market lead today - I was able to get some of it when I saw the entire group breaking its range
Showing all the majors and crosses relative to the Asia range (00:00 - 07:00 GMT)
Active 'show on chart' to verify the indicator is measuring the range correctly. Compare below to the NZD box above - you can see how NZD had control of the market this morning and all NZD pairs broke out of their ranges.
'PIP MODE' - active pip mode to see what the pip range was of the session
Notes
The information is presented RELATIVELY - this means that all the ranges and movements are scaled to be the same size. You are therefore seeing the movements relative to their ranges. When you see a breakout it relative to the size of the range - for example, if GBPJPY had a range of 50pips and breaks out of the range by 100 pip and GBPEUR has a range of 20 pips and breaks out by 40 pips they have both broken out double the range and will be displayed as the same distance.
The indicator will show the movements whilst the range is forming. I did this so I can see what the groups are doing before Europe open and be ready - such as lingering at the top end of its INCOMPLETE asia range. Be aware through that if the lines are flat at the top of the range WHILST THE RANGE IS STILL FORMING this does not mean price was flat, it means that price was pushing up and growing the range. (Price can't breakout until the range has formed at the end of the session)
The currency pairs are organised to show the strength or weakness of the selected group - this means that the base currency is always the select group. This is to present the data with currencies moving in the same direction rather than some reversed but meaning the same in relation to currency strength. In the NZD example:
NZDAUD (not AUDNZD )
NZDCAD
NZDCHF
NZDEUR (not EURNZD )
NZDGBP (not GBPNZD )
NZDJPY
NZDUSD
I hope its useful. This is the most powerful indicator I've managed to write yet. It was difficult to make the code efficient enough to fit into the pinescript limit and still do everything.

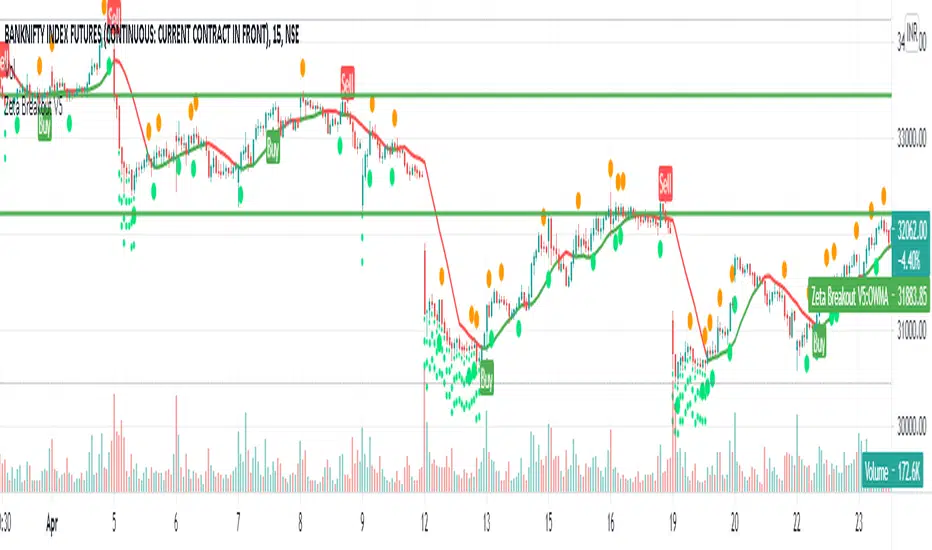
Zeta BreakoutIf I ask you what moves the price, most of you will say the same old answer: Demand & Supply
But who creates Demand & Supply? You or Me, the retailers? No. It is Big Institutions and Mutual Funds and Big Banks which create this demand and supply because the
share of retailers in Stock Market is so little it does not affect the price in a big way.
The Big Institutions, Mutual Funds, Big Banks or in some cases Governments, are collectively called Smart Money.
When Smart Money steps in, the previous levels of Support or Resistance are broken and then the up or down move starts which most probably goes a certain distance.
Now the Support or Resistance levels are not static, they are dynamic in nature and keep changing with the time.
How does this indicator work?
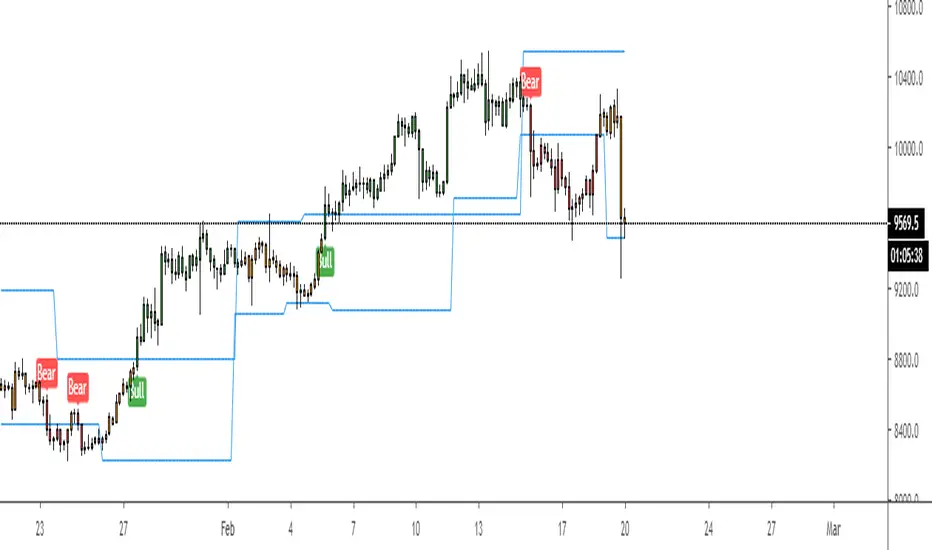
Zeta Breakout dynamically and automatically detects and marks these levels and when the price break-outs or break-downs or bounces up or down from these levels, the Buy or Sell Signals are generated for you to follow.
The indicator keeps watching previous or newly created levels of Support or Resistance and as soon as price crosses these levels or bounces from these levels, the user is alerted in the form of 'Buy' or 'Sell' Signals.
How to use this indicator?
1. When you see a Buy Signal, take Buy Position and hold it till either (a) You see opposite signal or (b) Your Stop Loss is hit which is ideally the low of candle preceding the signal candle or any other user defined SL. If your stop loss is hit and then price again starts moving in the same direction as indicated by the last Buy signal, take a fresh position as soon as the price crosses the level where previous signal is sitting.
2. When you see a Sell Signal, close your Buy Position, take a Sell position and hold it till either (a) You see opposite signal or (b) Your Stop Loss is hit which is ideally the high of candle preceding the signal candle or any user defined SL. If your stop loss is hit and then price again starts moving in the same direction as indicated by the last Sell signal, take a fresh position as soon as the price crosses the level where previous signal is sitting.
What are the target instruments/markets for this indicator?
This indicator can be used on Stocks, Indices, Gold , Silver , Currency Pairs, Crude Oil or anything being trades on any exchange in the world.
This indicator is not limited to any specific time-frame. You may select any time-frame which suits your trading style.
How can you get this indicator?
This is an invite-only paid indicator but we can give you FREE TRIAL for 05 days if you are interested.
For Free Trial, send a message to @jellygill
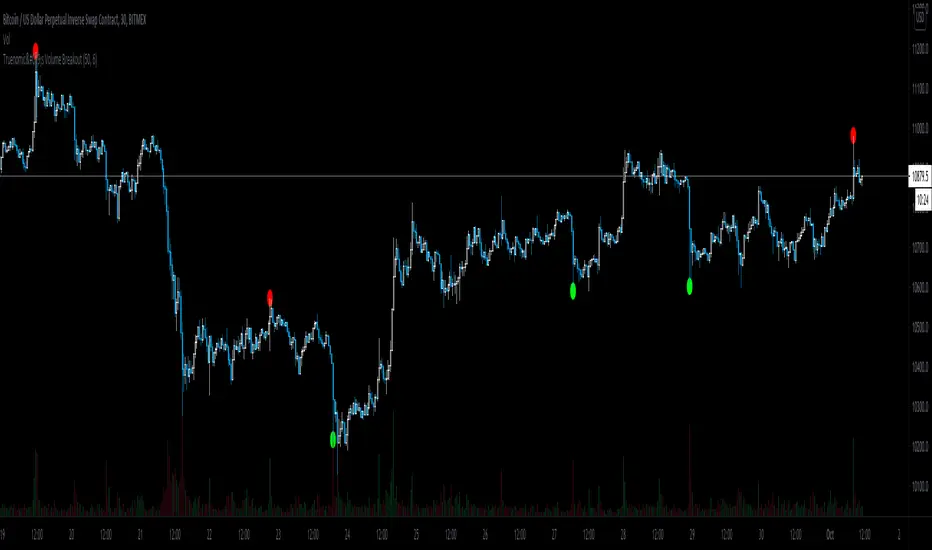
Truenomic's Volume BreakoutAn indicator that determines the breakout of the standard deviation of volume over a certain period.
Bollinger Bands Breakout StrategyBollinger Bands Breakout Strategy is the strategy version of Bollinger Bands Filter study version, which can be found under my scripts page. The strategy goes long when price closes above the upper band and goes short signal when price closes below the lower band.
Bollinger Bands is a classic indicator that uses a simple moving average of 20 periods, along with plots of upper and lower bands that are 2 standard deviations away from the basis line. These bands help visualize price volatility and trend based on where the price is, in relation to the bands.
The strategy doesn't take into account any other parameters such as Volume / RSI / Fundamentals etc, so user must use discretion based on confirmations from another indicator or based on fundamentals. The strategy results are based on purely long and short trades and doesn't take into account any user defined targets or stop losses.
The strategy works great when the price closes above/below upper/lower bands with continuation on next bar. It is definitely useful to have this strategy or the Bollinger Bands filter along with other indicators to get early glimpse of breach/fail of bands on candle close during BB squeeze or based on volatility .
This can be used on Heikin Ashi candles for spotting trends, but HA candles are not recommended for trade entries as they don't reflect true price of the asset.
The strategy settings default is 55 SMA and 1 standard deviation for Bollinger Bands filter, but these can be changed from settings.
It is definitely worth reading the 22 rules of Bollinger Bands written by John Bollinger if interested in trading Bollinger Bands successfully.

Monday + Tuesday Fib BreakoutINTENDED FOR DAILY CHART ONLY
This is my take on a simple breakout based on the well known Fibonacci Retracement. It was created with the main intention of swing trading Futures with a small account, though it can also be used for other instruments - just tweak the settings to what fits best for you.
As you can see, the strategy is trading a single contract every time and the stop loss is hard (no trailing yet) - I'm trying to show how well it works with a small account, obviously you can scale up from here.
The strategy:
Account Starting Balance: $500
Instrument: E-Mini Russell 2000 Futures
Contracts: 1 contract per trade
Commission: $0.34 per trade
Next Steps:
- Add more description to all the settings
- Add Trailing Stops
Don't forget:
For educational purpose only
Past performance doesn't guarantee future results.

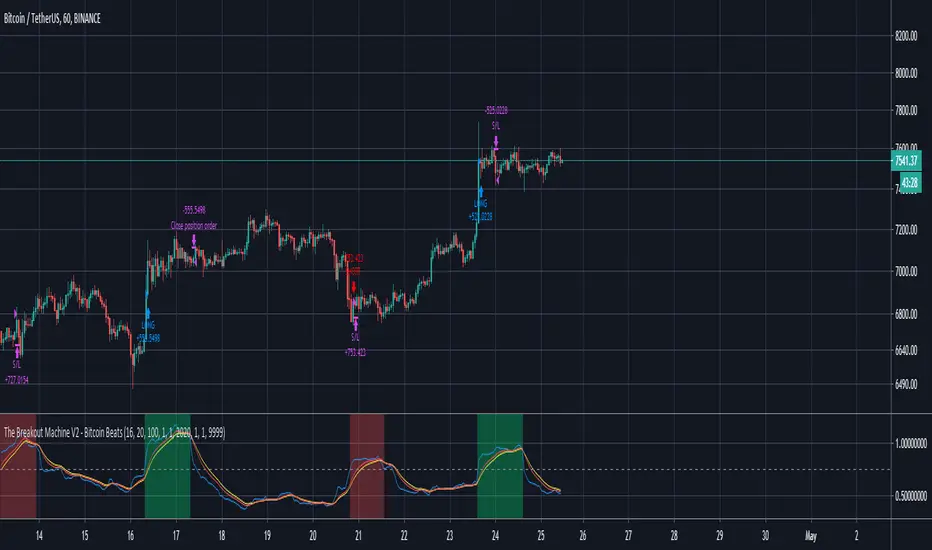
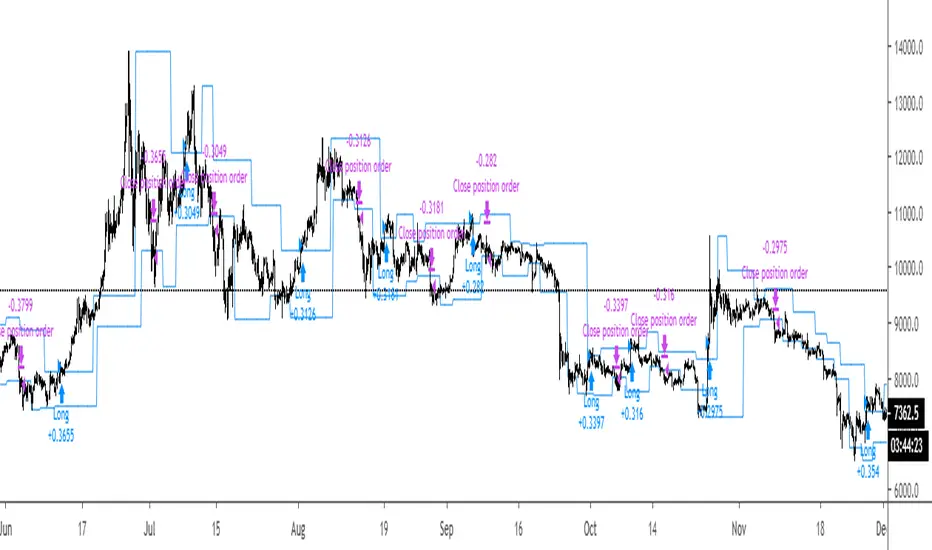
The Breakout Machine V2 BTCUSDT - Bitcoin BeatsHello, Hello, Hello and welcome back to Bitcoin Beats.
As the title suggests, this is Version 2 of The Breakout Machine. Unlike the previous version, this one has been fine-tuned to work best on Binance Futures(BTCUSDT).
The stats shown below are from 2020.
PLEASE BE CAREFUL WITH YOUR LEVERAGE AND DON'T GET REKT.
Trade at your own risk! Good luck!
This strategy takes MACD and Volume spikes to calculate pumps and dumps in the bitcoin market.
I've also added custom backtesting inputs and leverage for you all to experiment with and see the profitability of the Strategy.
Alerts version coming soon...
Thank you, And goodbye, from Bitcoin Beats.
[RS]The Breakout IndicatorSignals when there is a breakout from the trading range(donchian channel up to 300 bars back).

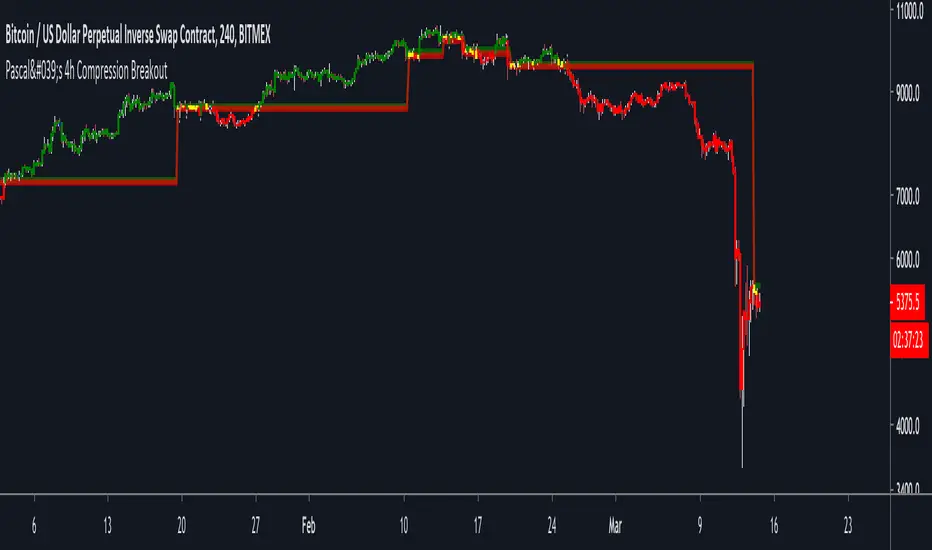
Pascal's 4h Compression BreakoutThis indicator aims to identify areas of price compression, by looking for two consecutive "inside candles" on the 4h chart.
An inside candle is simply when the current candle's high is lower than the previous candle's high, and the current candle's low is higher than the previous candle's low.
Once price compression is identified, the indicator draws a range based on the highest high and the lowest low of the two inside candles.
1) A break above the range is bullish.
2) A break below the range is bearish.
The script ALSO paints candles in blue that are likely to become strong horizontal S/R levels. This is, again, based on a candle pattern.
Please note:
1) This indicator is only meant to be used on BITMEX:XBTUSD (on the 4h or 1h chart).
2) You will have to apply some discretion to profitably trade with this indicator. Use SFPs and horizontal S/R levels to judge if a breakout is worth trading.
Finally, use the indicator at your own risk. I am not responsible for any losses you may incur.
My objective with this indicator g is to hopefully give you something that you can build upon, and NOT a script to blindly copy trade.
The concept of market compression is powerful. There are countless ways in which you can build a system around it.
This is just the tip of the iceberg.
Cheers.
Custom Candle BreakOut ORB with Alerts [MV]This is Indicator base on Custom Bar Breakout
Indicator Feature
You can also add alerts Long, Short, Long-side-exit, Short-side-exit
you can Change Take profit Percentage
In future, I will Enhance and update this Indicator
if you have any suggestion Mention There
Thank you :-)

Breakout Strategy IndicatorBreakout strategy indicator version.
Backtested strategy version can be found on my published scripts
Breakout Strategy #1Breakout above previous pivot points trigger a long. Close below pivot lows trigger the exit.
Most effective during trends.
Breakout Notifier LONG NEW with wicksBreakout script with few changes that considers wick to close trades instead of using candle body like in the previous version

Breakout Notifier SHORT With wicksBreakout notifier with modifed version to close on wicks instead of candle body
