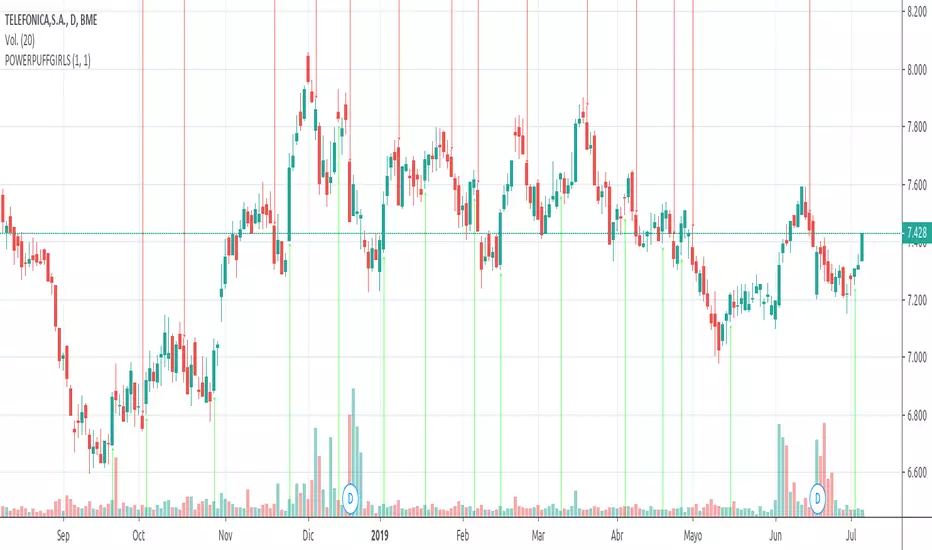
POWERPUFFGIRLS WE ARE GIRLS PROGRAMMING GREAT CODES, WE CREATE THIS INDICATOR THAT GIVE YOU THE CONTROL OVER THE ALERTS, JUST BUY IT WHEN GREEN ARROW APPEARS, AND SELL HEN THE RED ONE COMES OUT, GOOD LUCK
스크립트에서 "binary"에 대해 찾기
SharinganTraderthe most powerful clan of konoha, the uchiha have created a sharingan indicator before itachi kill them all, and now u have this precious weapon use it with respect.


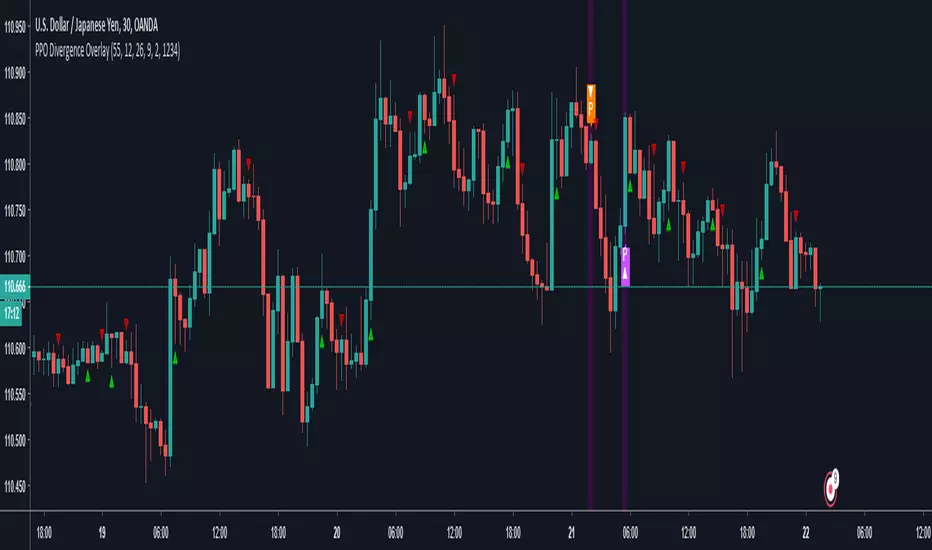
Divergence With OverlaysThis is a nice script
Modification request by @emanuel.
Great thanks to
This script creates mixed alerts and removes any repaints by using v3
signal manipulation is also edited from the offset
ANB AI Alert (my ANN)Hi guy
This is a high level trend predicting study. It is modified from the strategy by sirlof.
Feel free to use it as you like.
::USAGE only on 15 minutes
1. add the study in your chart
2. create an alert on the right
3. select ANB AI Alert (my ANN)(0,1D)
4. select the option you wish
5. select once per bar close alert
6. you can select email alert which i usually like
7. once the trade is alerted, execute your trade
TP: DYNAMIC (read more)
SL: null
Setting TP and SL: this is in consideration with the daily volatility and sessions
USDCAD TP 400 points, no stop loss.
To maximize profit, use trailing stops. most trades are 500 to 1800 points

VEMA Band_v2 - 'Centre of GravityConcept taken from the MT4 indicator 'Centre of Gravity'except this one doesn't repaint.
Modified / BinaryPro 3 / Permanent Marker
Ema configuration instead of sma & centralised.

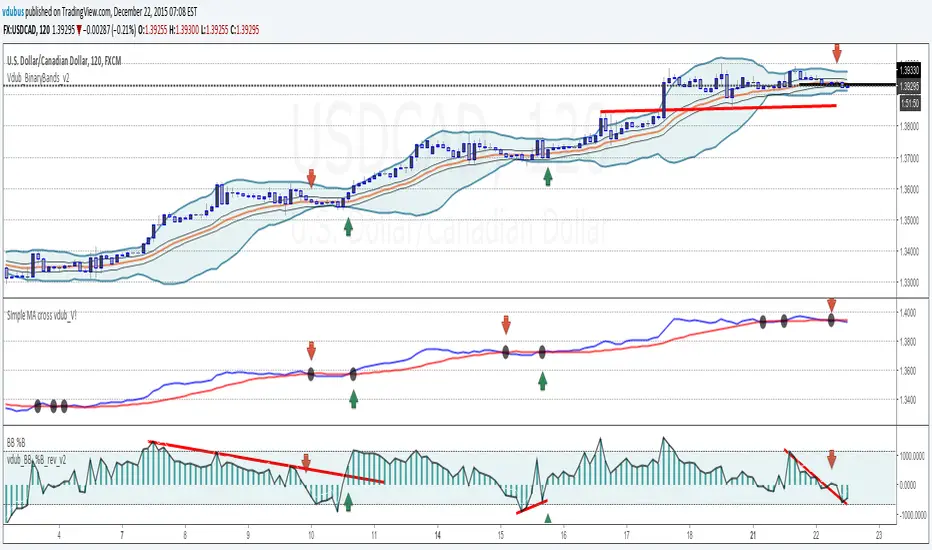
Vdub_Tetris_Stoch_V1Vdub_Tetris_Stoch_V1
A combination lower based indicators based on the period channel indicator Vdub_Tetris_V2
Blue line is more reactive fast moving, Red line in more accurate to highs / Lows with divergence.- Still testing
Code title error
Change % = Over Bought / Over Sold
Vdub Tetris_V2
Vdubus BinaryPro 2 /Tops&Bottoms
StochDM

HFX321This indicator will provide the possibility of when trend reversals may happen on shorter time frames. It can work on any time frame and the use of Heiken Ashi candles can enhance it further.
When used with other indicators such as the Stochastic RSI, support, resistance and trend lines, it can increase the possibility of a trend reversal being identified. On shorter time frames the alerts are much more frequent therefore can be less accurate so other indicators may be used.
It will show an alert Arrow (green) pointing UP for the First Candle after a pivot LOW (LL, HL) that could indicate a trend reversal.
It will show an alert Arrow (red) pointing DOWN for the First Candle after a pivot HIGH (HH, LH) that could indicate a trend reversal.
The Colour changes on the Moving Average from Red to Green and green to red to support a trend change possibility.
This has been designed to provide a visual confirmation that selected indicators have met certain criteria and that the trend has the possibility of reversing in the near future.
It is NOT meant to be a trading system or offer trading advice. The indicator offers only possibilities of trend reversals when the above criteria is met.
This is designed for Trend analysis ONLY.
To gain access to this invite only script, please send me a private message on Trading View so I can assist you further.
Thanks Les Gallagher


VCTOS - Volatility & Candle Transition OscillatorShort Description (one-line summary)
Displays candle and volatility-based trend transitions using EMA relationships and adaptive dynamic thresholds.
Full Description
Overview
This VCTOS (Volatility & Candle Transition Oscillator System) indicator visualizes market structure, volatility, and transition phases using a custom oscillator-based candle model.
Its purpose is to provide contextual insight into pressure, strength, and loss of momentum, not to predict future price movement and not to provide trading signals.
________________________________________
What Makes This Script Distinct
The indicator is designed to make relative market strength observable:
• Taller candles reflect higher volatility
• Shorter candles reflect reduced activity
• Candles extending far beyond the threshold suggest stronger conditions
• Compression toward the threshold suggests weakening pressure
While the base calculations use EMA-derived components, the indicator’s distinguishing feature is its adaptive advanced threshold logic, which frames volatility in a consistent and measurable way across different conditions.
________________________________________
How to Read It
One way to interpret the oscillator candles is by comparing them against price to observe divergence, compression, and loss of momentum.
To support this, candles are labeled with incrementing numbers.
These numbers do not represent signals, probabilities, or trade instructions. They simply indicate how long a sequence has been developing.
The label colors reflect transition phases:
• Blue – early phase
• Orange – transition building
• Green – late phase
A green label indicates that a sequence has matured, not that a transition will occur. Interpreting whether this information is meaningful depends on broader market context.
________________________________________
Oscillator Candle Representation
Price action is transformed into candles plotted around a zero line in oscillator form.
Each candle reflects relative movement and is color-coded based on its current state:
• Green – upward pressure
• Orange – range or transitional behavior
• Red – downward pressure
Because absolute market tops and bottoms cannot be known in advance, the oscillator format focuses on relative extremes and structural behavior, rather than fixed price levels.
________________________________________
Dynamic Candle Threshold Line
A dotted Candle Threshold Line is plotted above and below the oscillator candles.
This line is not a simple average. It dynamically adapts using the most relevant extreme values observed over time, allowing it to adjust automatically to changing volatility conditions.
The threshold line serves as a reference zone where market conditions may become stretched. It is a dynamic indication only and should not be interpreted as a reversal level or predictive boundary.
________________________________________
Volatility Line
The indicator includes a Volatility Line representing directional pressure:
• Above zero – downward pressure
• Below zero – upward pressure
Short colored threshold lines appear on the indicator right areas where pressure threshold was in the past. These segments are contextual references, not triggers.
The slope and magnitude of the volatility line are emphasized, as they reflect increasing or decreasing pressure rather than binary conditions.
________________________________________
Timeframes and Assets
The indicator is designed to work on any asset and any timeframe.
The active timeframe is displayed in the top-right corner of the chart.
Using multiple timeframes can help place short-term structure within broader market context.
________________________________________
Usage Notes
• This indicator does not generate trade entries, exit signals, or financial recommendations.
• This indicator does not predict future price movement
• Colored candles and labels highlight contextual phases within market behavior and should not be interpreted as buy or sell signals.
• Zero-line interactions in the volatility line visually mark potential phase transitions, not confirmed trend changes.
• All visuals are intended for analytical and educational purposes only.
• Users are encouraged to integrate this indicator within their own analytical or confirmation framework.
• Numerical labels are iterative and do not carry standalone predictive meaning.
• The distance between the oscillator candles, the candle threshold line, and the volatility threshold levels can help visualize relative market strength and pressure, but should not be interpreted as a forecast or signal.
The indicator is intended as a market-structure and volatility visualization tool, not as a standalone decision system.
________________________________________
Access
This is an invite-only script.
Access is restricted to users who have been granted permission by the author.
To request access, contact me through vtostrading@gmail.com
Approved users will find the indicator under Invite-only scripts in the TradingView Indicators panel.
________________________________________
Disclaimer
VCTOS is provided strictly for informational and educational purposes.
It does not constitute financial advice, investment guidance, or performance assurance.
All users should conduct independent analysis and manage their own risk responsibly.

RSS3 - Reversal Score System v3 [Rulph]RSS3 - Reversal Score System v3
RSS3 is a quantitative reversal detection system that combines volatility pressure analysis with directional momentum exhaustion to produce a unified reversal strength score from -1 (extreme bullish) to +1 (extreme bearish).
Unlike traditional single-indicator divergence systems (RSI, MACD), RSS3 cross-validates signals between two independent analytical engines (VPI and TDFI) and applies multi-timeframe contextual filtering to reduce false signals.
RSS3 is not a visual overlay of separate indicators. It implements a unified calculation pipeline where VPI and TDFI components feed into a single normalized Score through weighted aggregation. The divergence bonus system creates feedback loops where price-indicator relationships dynamically adjust the final Score, producing signals that cannot be replicated by simply viewing RSI, Bollinger Bands, and moving averages side-by-side.
━━━━━━━━━━━━━━━━━━━━━━━━━━━━━━━━━━
WHY COMBINE VOLATILITY + TREND FORCE?
━━━━━━━━━━━━━━━━━━━━━━━━━━━━━━━━━━
Most reversal systems rely on a single dimension:
• RSI divergence tracks momentum exhaustion
• Bollinger extremes track volatility expansion
• MACD divergence tracks trend deceleration
RSS3 recognizes that major reversals typically require both :
1. Volatility pressure buildup (market stretched beyond normal range)
2. Directional force exhaustion (trend losing momentum despite stretched price)
When VPI (volatility) and TDFI (trend force) diverge simultaneously from price, it signals a high-probability reversal zone. When only one diverges, the signal is weighted accordingly.
This dual-validation approach filters out:
• Momentum exhaustion in low-volatility consolidations (no VPI confirmation)
• Volatility spikes within strong trends (no TDFI exhaustion)
━━━━━━━━━━━━━━━━━━━━━━━━━━━━━━━━━━
COMPONENT 1: VOLATILITY PRESSURE INDEX (VPI)
━━━━━━━━━━━━━━━━━━━━━━━━━━━━━━━━━━
VPI quantifies how far the market has deviated from its equilibrium state using four factors:
1. RSI deviation from 50
Measures directional bias accumulation. When RSI stays at 70+ or 30- for extended periods, it signals persistent one-sided pressure.
2. Annualized volatility (VIX-style)
Calculates rolling standard deviation of returns scaled to annual terms. Rising volatility indicates increasing uncertainty and potential for mean reversion.
3. Normalized candle range
Compares current bar's range to recent average range. Expanding ranges signal climactic moves.
4. Bollinger Band position
Measures price distance from statistical mean (middle band). Touches or penetrations of outer bands indicate statistical overextension.
How they combine:
Each component is normalized to 0-1 scale, then weighted based on current market regime (trending vs ranging). The weighted average produces VPI reading where:
• VPI > 0.5 = overbought pressure zone
• VPI < -0.5 = oversold pressure zone
━━━━━━━━━━━━━━━━━━━━━━━━━━━━━━━━━━
COMPONENT 2: TREND DIRECTION FORCE INDEX (TDFI)
━━━━━━━━━━━━━━━━━━━━━━━━━━━━━━━━━━
TDFI measures the strength and sustainability of directional movement using moving average dynamics:
1. MA spread (fast MMA vs slow SMMA)
When fast MA pulls far from slow MA, it indicates strong directional momentum. When the spread contracts, momentum is fading.
2. Average impulse between MAs
Calculates the velocity of the spread change. Rapid expansion = acceleration phase; slowing expansion or contraction = deceleration/exhaustion.
3. Normalized trend strength
The spread and impulse are normalized relative to recent volatility to make TDFI comparable across different instruments and market conditions.
Output:
• TDFI > 0.7 = unsustainably strong bullish momentum
• TDFI < -0.7 = unsustainably strong bearish momentum
• TDFI near 0 = directionless or balanced market
━━━━━━━━━━━━━━━━━━━━━━━━━━━━━━━━━━
SCORE CALCULATION & DIVERGENCE INTEGRATION
━━━━━━━━━━━━━━━━━━━━━━━━━━━━━━━━━━
Base Score:
Score = (VPI_weight × VPI) + (TDFI_weight × TDFI)
This creates a continuous measure where:
• Score > +0.5 = bearish reversal zone (high VPI + weak bullish TDFI)
• Score < -0.5 = bullish reversal zone (low VPI + weak bearish TDFI)
Divergence Bonus System:
When classic divergences are detected (price makes new high/low but VPI or TDFI doesn't), a bonus/penalty is applied to Score:
• Decay mechanism: Divergence influence fades linearly over 15 bars (default). Fresh divergences have maximum impact; older ones gradually lose weight.
• Amplitude weighting: Larger divergences (bigger spread between price and indicator pivots) receive stronger bonuses.
• Dual-source amplification: When VPI and TDFI diverge on the same pivot (double divergence), their bonuses stack, creating extreme Score readings near ±1.0.
This means:
• Score = 0.9 with v3t2 label = third VPI + second TDFI bearish divergence, very high confidence
• Score = -0.85 with v1 label = first VPI bullish divergence, strong but early signal
━━━━━━━━━━━━━━━━━━━━━━━━━━━━━━━━━━
CALCULATION MECHANICS (DETAILED)
━━━━━━━━━━━━━━━━━━━━━━━━━━━━━━━━━━
VPI Component Weighting:
Weights are dynamically adjusted based on market regime detected by TDFI:
• Trending regime (|TDFI| > 0.5): RSI deviation 40%, BB position 30%, volatility 15%, range 15%
• Ranging regime (|TDFI| < 0.3): Volatility 35%, range 35%, RSI deviation 15%, BB position 15%
• Transition zones: linear interpolation between the two weight sets
Normalization Approach:
Each VPI/TDFI component is rescaled using rolling percentile rank over 100-bar window:
• Value at 100th percentile (highest) → 1.0
• Value at 0th percentile (lowest) → 0.0
• Current value → percentile position between 0-1
This makes the indicator adaptive to changing volatility and comparable across instruments.
Divergence Amplitude Measurement:
When a divergence is detected, its strength is quantified as:
Amplitude = (price_pivot_delta / ATR) × (indicator_pivot_delta / indicator_stddev)
Where:
• price_pivot_delta = distance between current and previous pivot
• indicator_pivot_delta = distance between indicator values at those pivots
• ATR and stddev provide normalization
Larger amplitude → larger bonus/penalty to Score (up to ±0.3 maximum).
Decay Function:
Divergence bonus decays linearly: Bonus(t) = Initial_Bonus × (1 - t/15), where t is bars since divergence. After 15 bars, bonus reaches zero. This ensures recent divergences dominate the Score.
Why This Design:
This architecture creates a system where:
• Components adapt to market regime automatically
• Signals are normalized across timeframes and instruments
• Multiple divergences create amplification (bonuses stack)
• Stale signals fade out naturally
This is fundamentally different from displaying RSI + Bollinger + MA separately, as the unified Score cannot be replicated by visual inspection alone.
━━━━━━━━━━━━━━━━━━━━━━━━━━━━━━━━━━
SEQUENTIAL DIVERGENCE LABELS (v/t SYSTEM)
━━━━━━━━━━━━━━━━━━━━━━━━━━━━━━━━━━
Each divergence is tracked separately for VPI and TDFI:
v-series: VPI divergences (v1, v2, v3...)
t-series: TDFI divergences (t1, t2, t3...)
The counter increments each time a new divergence appears in the same direction (e.g., consecutive bearish divergences). When direction flips (bearish → bullish), counters reset to 1.
Why this matters:
• v1 or t1 = early warning, potentially premature
• v3 or v4 = late-stage exhaustion, higher probability of reversal
• v2t3 = double divergence with second VPI + third TDFI = strong confluence
Traders can filter signals by label:
• Aggressive: trade v1/t1
• Conservative: wait for v2+/t2+ or double divergences
━━━━━━━━━━━━━━━━━━━━━━━━━━━━━━━━━━
MULTI-TIMEFRAME FILTER
━━━━━━━━━━━━━━━━━━━━━━━━━━━━━━━━━━
The MTF filter analyzes a higher timeframe to determine if the current market structure supports the divergence signal.
Modes:
• Off: All divergences shown
• Reduce: Counter-trend divergences have their bonus reduced by 70% (visual indication: dimmed/gray markers)
• Block: Counter-trend divergences completely hidden
Logic:
If 1H shows bearish divergence but 4H is in strong uptrend (Score < -0.3), the 1H signal is likely premature. MTF filter prevents entering shorts against higher timeframe momentum.
This protects against:
• Catching falling knives in strong downtrends
• Shorting pullbacks in strong uptrends
• Low-probability mean-reversion attempts
━━━━━━━━━━━━━━━━━━━━━━━━━━━━━━━━━━
HOW TO USE RSS3
━━━━━━━━━━━━━━━━━━━━━━━━━━━━━━━━━━
Entry Setup:
1. Wait for divergence marker (green = bullish, red = bearish)
2. Check Score magnitude:
• |Score| > 0.5 = higher confidence
• |Score| > 0.8 = extreme zone
3. Check v/t label:
• v1/t1 = early (more risk, more reward potential)
• v2+/t2+ or double = late but more reliable
4. Optional: wait +2 bars for pivot confirmation
Exit Options:
• Conservative: opposite divergence appears
• Aggressive: Score crosses through 0 or opposite ±0.5 threshold
• Always use volatility-based stop (2-3× ATR)
Timeframe Recommendations:
• 5-15m: intraday (use MTF 1H-4H)
• 1-4H: swing trading (use MTF Daily-Weekly)
• Daily: position trading (use MTF Weekly-Monthly)
Complementary Tools:
RSS3 is a reversal timing engine, not a complete strategy. Combine with:
• Support/resistance for target zones
• Volume analysis for confirmation
• Trend filters for directional bias
━━━━━━━━━━━━━━━━━━━━━━━━━━━━━━━━━━
WHAT MAKES RSS3 ORIGINAL
━━━━━━━━━━━━━━━━━━━━━━━━━━━━━━━━━━
vs Traditional RSI Divergence:
• RSI divergence = binary yes/no
• RSS3 = quantified strength score with dual-source validation
vs MACD Divergence:
• MACD = single dimension (momentum)
• RSS3 = volatility pressure + trend force + MTF context
vs Bollinger + RSI mashup:
• Standard mashup = two separate signals
• RSS3 = unified scoring system where components interact through weighted bonuses
Unique features:
• Decay-weighted divergence bonuses (recent divergences matter more)
• Amplitude-sensitive scoring (stronger divergences = higher score impact)
• Sequential tracking (v/t labels show signal maturity)
• MTF-aware filtering (context-dependent signal validation)
• Closed-loop system (divergences → Score → priority weighting → signal)
━━━━━━━━━━━━━━━━━━━━━━━━━━━━━━━━━━
EXAMPLE INTERPRETATION
━━━━━━━━━━━━━━━━━━━━━━━━━━━━━━━━━━
Scenario: BTC 2H chart shows:
• Red triangle appears above price
• Label: v1 + t2
• Recent Score Value: 1
What this means:
• Second consecutive TDFI bearish divergence detected (t2)
• First VPI bearish divergence on same pivot (v1)
• Double divergence stacking → Score near maximum
• Market is in extreme overbought/overextended zone
• High probability of short-term reversal
Trading decision:
• Aggressive trader: short immediately with tight stop
• Conservative trader: wait for Score to drop below 0.5 or opposite divergence for exit
━━━━━━━━━━━━━━━━━━━━━━━━━━━━━━━━━━
CHART LEGEND
━━━━━━━━━━━━━━━━━━━━━━━━━━━━━━━━━━
The published chart shows:
• Green triangles below price = bullish divergences (v/t labels indicate sequence)
• Red triangles above price = bearish divergences
• Score line in lower panel = reversal strength from -1 to +1
• Colored clouds = pressure accumulation zones (optional display)
• Text annotations = example entry/exit points for educational purposes
━━━━━━━━━━━━━━━━━━━━━━━━━━━━━━━━━━
Disclaimer: All trading involves risk. This indicator does not guarantee profits. Always backtest and apply proper risk management.

AVAX Bot-Safe SuperTrend FastConfirm v1 (No Repaint for BOT)BETA version - (still in testing)
AVAX Bot-Safe SuperTrend FastConfirm v1 is a TradingView indicator designed to generate stable, non-repainting trade signals for automated execution, while also offering optional visual “early” cues for discretionary monitoring. The script combines a SuperTrend trend engine with a FastConfirm mechanism based on lower-timeframe closes, plus optional confirmation via Hull Moving Averages (HMAs) and risk overlays (ATR-based SL/TP) for execution planning.
1) Core Trend Engine (SuperTrend)
The indicator computes a SuperTrend using ATR (Wilder ATR via ta.atr() by default, optional SMA-TR alternative).
It tracks a binary trend state:
* Trend = bullish when price is above the trailing bearish band.
* Trend = bearish when price is below the trailing bullish band.
“Early” SuperTrend flips (trend change points) can be shown as visual-only markers, intended for human observation rather than bot execution.
2) Hull Moving Averages (Context / Optional Confirmation)
* Two Hull MAs are calculated:
* Fast Hull (short length)
* Slow Hull (longer length)
* Hull alignment is used as an optional confirmation layer (recommended for AVAX) to reduce whipsaws:
* Bullish bias when Fast Hull > Slow Hull
* Bearish bias when Fast Hull < Slow Hull
* Hull lines can be plotted for trend structure and momentum context.
3) Momentum Burst (Visual Only)
* The script includes a momentum “burst / continuation” visual module:
* Measures impulse using either ATR-normalized movement (default) or percentage change.
* Flags continuation patterns (e.g., consecutive rising/falling closes after a burst).
* These markers are not used for bot execution, and are intended to assist human interpretation.
4) Optional Filters (Only Applied to BOT if Enabled)
The script contains optional execution filters that can be applied to bot signals (toggleable):
* Volume filter: compares current volume to a volume moving average.
* RSI filter: avoids entries in overstretched conditions.
* ADX filter: requires a minimum trend strength.
A dedicated switch (“BOT: apply Volume/RSI/ADX if enabled”) determines whether these filters impact automated entries.
5) Bot-Safe Signal Logic (No Repaint)
The indicator’s primary purpose is to produce bot-safe entries that do not “blink” intrabar:
A. Candidate trigger (stable bands + buffer)
* Uses previous bar SuperTrend levels and an ATR-based buffer to avoid micro-touch signals.
* Detects whether price action meaningfully penetrates the relevant band.
B. FastConfirm via lower timeframe closes
* Pulls lower-TF closes inside the current candle (e.g., 1m confirmations) and requires N consecutive closes beyond the threshold level.
* This is intended to reduce false flips while still entering earlier than pure bar-close logic.
C. Two execution modes
* FastConfirm: faster entries, confirmation from lower timeframe closes (recommended for latency-sensitive automation).
* BarClose: waits for bar close confirmation (slowest but maximally conservative).
D. Latching + cooldown
* Signals are latched per bar so they do not disappear within the same candle.
* A direction lock and cooldown prevents immediate opposite signals in rapid chop.
6) Risk Levels (ATR-Based SL/TP + JSON Payload)
* On each bot signal, the indicator calculates:
* Stop Loss = ATR-multiple away from price
* Take Profit = based on a configurable risk:reward ratio
* SL/TP lines can be plotted for a limited number of bars after the signal for clarity.
* For automation, the script can send dynamic JSON alerts via alert() including:
* action (BUY/SELL), symbol, timeframe, confirmation TF, suggested entry, SL, TP, and latency cushion.
A configurable latency cushion (%) adjusts the “entry” field to account for real execution delay/slippage (useful when routing signals to bots/exchanges with a few seconds latency).
Recommended Usage (TradingView + Bot Execution)
Best practice for bot safety
* Use Bot Signal Mode = FastConfirm for earlier entries while keeping confirmations.
* Keep FastConfirm TF = 1m and start with Confirm Bars = 2 (then tune to 3 if too many false signals).
* Maintain a modest ATR buffer (e.g., 0.10–0.20 × ATR ) to reduce noise triggers.
How to set alerts
* For bot routing that expects structured data: enable Send JSON via alert(), and create the TradingView alert using:
* “Any alert() function call”
* For simpler setups: use the built-in alertcondition() alerts (“AVAX BOT BUY/SELL”).
Filter policy (risk control)
* If you trade during choppy ranges, consider enabling ADX and/or Hull alignment.
* Enable Volume/RSI/ADX filters for the bot only if you accept fewer trades in exchange for higher selectivity.
Operational notes
* Prefer lower chart timeframes (e.g., 1m–5m) with FastConfirm to limit reaction time.
* Calibrate latency cushion (%) to match your observed end-to-end delay (TradingView → webhook → bot → exchange).
* Always validate settings in BarClose mode first to benchmark “safest behaviour,” then switch to FastConfirm and tune confirm bars/buffer.
!!!! - The algorithm was designed with ChatGPT 5.2 Pro

ABC Risk Management SystemOverview
This script is a comprehensive execution engine designed for high-frequency momentum trading (optimized for MES/ES Futures). It solves the problem of "grade inflation" in trading by strictly categorizing setups based on Multi-Timeframe (MTF) alignment and volatility.
How it Works
The script utilizes a 5-Minute Bias Engine to filter a 1-Minute Execution Chart. It relies on the relationship between the CCI (Commodity Channel Index) and its 20-period SMA using Typical Price (HLC3).
The Grading Hierarchy
Grade A+ (The Trend Follower): Triggered when the 5m Trend is strong (ADX > 25) and 1m momentum is perfectly aligned.
Grade B (The Momentum Burst): Triggered in "Lazy Markets" (5m ADX < 25). The script automatically raises the entry requirement to a 140 CCI burst to filter out noise.
Grade C (The Mean Reversion): Triggered when 1m internals (ADX/DI/CCI) are powerful enough to trade against the 5m Bias.
Key Indicators Included
T3 Pulse Lead: A specialized, color-coded trailing line used for dynamic stop-loss management.
Price-Locked Labels: Signals are pinned to the High/Low of the specific candle to provide exact price levels for entry.
🚀 Release Notes: Version 3.0 (The "ABC" Update)
New Features & Logic Fixes:
Strict Binary Bias: Removed all level-based filters for the HTF trend. The bias is now determined solely by the crossover of the 5m CCI and its SMA.
Bullish: 5m CCI > 5m SMA (regardless of positive/negative value).
Bearish: 5m CCI < 5m SMA.
Adaptive ADX Scaling: If 5m ADX falls below 25, the 1m CCI trigger is automatically moved from 100 to 140 to compensate for the lack of trend strength.
Visual Overhaul: Replaced generic shapes with Price-Locked Text Labels.
Longs: Labels appear below the candle (Green/Lime/Purple).
Shorts: Labels appear above the candle (Red/Maroon/Orange).
T3 Pulse Integration: Added the T3 Pulse Lead (8-period) directly into the overlay to facilitate the "T3 Trailing Stop" methodology.
Typical Price Standard: Standardized all calculations to HLC3 to align with professional S&P 500 momentum standards.
How to Setup the Chart:
Apply script to a 1-Minute Chart.
Ensure your 5-minute CCI settings in your separate indicator match (20 SMA, HLC3 Source).
Follow the A/B/C Risk Management Protocol (0.5% / 0.25% / 0.10% risk)

SignalViper RushRush — Momentum Strength & Regime Visualization
Rush is a momentum strength and market regime visualization tool designed to show how directional pressure evolves over time. Instead of producing discrete entry signals, Rush focuses on displaying momentum quality, persistence, and transition in a clear visual format.
The script emphasizes how strong and stable momentum is, and whether current conditions favor continuation or consolidation.
Core Concepts & Logic
Rush evaluates momentum as a spectrum, not a binary condition. It measures directional pressure relative to recent price behavior and classifies it into graduated intensity levels.
Key concepts include:
Momentum Strength
Indicates how strongly price is pushing in a given direction relative to recent movement.
Momentum Stability
Helps distinguish sustained movement from short-lived bursts.
Regime Awareness
Identifies when momentum is likely to be unreliable due to sideways or compressed conditions.
Indicator Families Used
Rush belongs to the momentum and regime-detection family of indicators. It uses smoothed, normalized momentum measurements rather than single-bar oscillators. These measurements are evaluated over time to reduce noise and highlight meaningful transitions.
Visual Outputs Explained
Heat Gradient Colors
A 7-level color scale represents momentum intensity, ranging from weaker to stronger directional pressure. Color progression reflects relative momentum strength, not price levels.
Chop Detection Dots
Gold dots indicate CHOP conditions where momentum is unstable or unreliable
Cyan dots indicate CLEAR conditions where momentum is more consistent
Information Panel
Displays current directional bias, relative momentum strength, and regime state for quick reference.
All visuals are directly tied to the current momentum and regime evaluation.
Alerts
Custom alerts are available for:
Momentum intensity transitions
Regime changes between CHOP and CLEAR states
Alerts are designed to notify traders of context changes, not to signal entries or exits.
How to Use Rush
Rush is intended to be used as a context and timing tool. Traders commonly use it to:
Hold positions during sustained momentum phases
Avoid overtrading during choppy conditions
Anticipate transitions between expansion and consolidation
It pairs naturally with structure or entry-based tools by clarifying when momentum is supportive.
Why This Script Is Invite-Only
Rush’s value comes from how momentum is normalized, categorized, and visualized into readable states and gradients. This allows traders to assess momentum quality at a glance without stacking multiple oscillators or filters.

SignalViper PulsePulse — Market Bias & Signal Quality Analyzer
Pulse is a market bias and signal-quality analysis tool designed to evaluate directional conditions using multiple layers of contextual information. Rather than generating standalone trade entries, Pulse focuses on assessing how favorable current conditions are for directional continuation or mean reversion.
The script continuously evaluates price behavior across timeframes to provide a structured view of trend alignment, momentum participation, and contextual confirmation.
Core Concepts & Logic
Pulse operates by aggregating several analytical dimensions into a unified assessment of market bias:
Directional Alignment
Evaluates whether higher and lower timeframes are aligned, conflicted, or neutral.
Momentum & Participation
Assesses whether price movement is supported by sufficient participation rather than isolated price spikes.
Contextual Weighting
Incorporates volume-aware and structure-sensitive inputs to distinguish meaningful movement from noise.
These components are combined into a normalized bias and quality framework, allowing traders to assess confidence rather than react to binary signals.
Indicator Families Used
Pulse belongs to the multi-factor bias and regime analysis category. It incorporates elements of trend analysis, momentum evaluation, and volume-aware context. Familiar concepts may be present, but they are evaluated together, not used independently, to reduce conflicting signals.
Outputs Explained
Pulse displays a consolidated view of market conditions through:
Bias Scoring that reflects directional favorability
Signal Quality Ratings that indicate alignment and confidence
Visual states highlighting periods of agreement, transition, or uncertainty
These outputs are designed to simplify interpretation without oversimplifying the underlying market state.
How to Use Pulse
Pulse is intended as a decision-support layer. Traders commonly use it to:
Confirm whether directional setups are supported by broader context
Avoid trades during conflicting or weak participation conditions
Adjust expectations during transitional or neutral regimes
It pairs naturally with entry-based or execution-focused tools by answering the question: “Is the market aligned enough to justify this trade?”
Why This Script Is Invite-Only
Pulse’s value comes from how multiple analytical inputs are weighted, normalized, and synthesized into a readable framework. This reduces the need for separate indicators and helps traders evaluate market conditions consistently across symbols and timeframes.

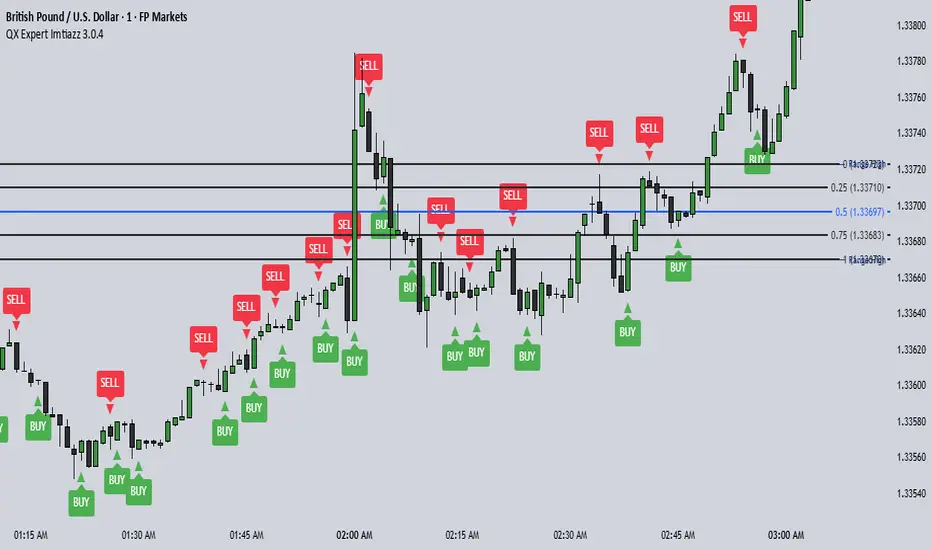
QX Expert Imtiazz 3.0.4 PROQX Expert Imtiazz 3.0.4 (qx_expert_imtiaz)
is a high-precision 1-minute binary scalping indicator, built using a hybrid trading strategy that combines momentum, structure, volume, and zone-based logic.
This indicator is specially designed for fast decision-making and short expiry trades in volatile market conditions.
---
🔹 Core Concepts Used
This indicator integrates multiple professional trading concepts into a single system:
QQE (Quantitative Qualitative Estimation)
Identifies momentum shifts and trend strength with reduced noise.
EMA Trend Filter
Confirms market direction and avoids counter-trend entries.
Smart Zones (Base & Reaction Zones)
Detects key price areas where reversals or continuations are most likely.
Volume Confirmation
Filters weak signals and confirms real market participation.
Footprint Logic (Price Acceptance / Rejection)
Analyzes candle behavior to validate buy/sell pressure.
---
Trend FilterTrend Filter
Summary
Trend Filter is a multi-factor trend-confidence indicator that produces a simple, actionable output: Direction (Up / Down / Ranging) and a normalized Confidence %. It is intended as a decision-support overlay to help traders quickly identify whether a market is trending or rangebound, and how strong that directional bias is.
What it shows
A single line in the on-chart table: Direction (Up / Down / Ranging).
A Confidence % (0–100) that combines multiple normalized market signals into a single score.
Optional notification row when a manually-selected reference timeframe does not match the chart timeframe.
Alert conditions when direction changes to Up, Down, or Ranging.
How the indicator works (concise, non-proprietary explanation)
Trend Filter computes a weighted confidence score from several complementary components, each normalized to a 0–100 scale and combined into a single confidence value. The components and their roles are:
EMA structure & spread (trend breadth)
-Uses three EMAs (fast / mid / slow) computed at lengths that scale with the selected/reference timeframe. The EMA spread (fast vs slow) quantifies directional separation.
HH/HL structure and streaks (price structure)
-Counts higher highs/higher lows (and the reverse) across a scaled lookback to measure whether price structure is predominantly bullish, bearish or mixed.
EMA slope (momentum of trend)
-A robust slope approximation (smoothed) measures whether the short EMA is rising/falling relative to its own smoothed history.
ADX / DMI (trend strength)
-Uses a standard ADX-style component to capture directional persistence and dampen the confidence score when the ADX is weak.
ATR (volatility context)
-ATR expressed as a percentage of price helps detect abnormal volatility regimes which affect the validity of trend signals.
Volume context
-Simple volume vs a short SMA gives a participation signal that increases confidence when moves occur with higher volume.
Each component is capped to avoid outsized influence. Components are scaled by a set of weights (configurable in code) and then combined. The final confidence is lightly smoothed before being used to determine direction and to feed alert conditions.
Important implementation & safety design choices (why it’s not a simple mashup)
Adaptive timeframe scaling: EMA lengths and lookbacks are proportionally scaled based on the chosen reference timeframe (Auto or manual). This preserves relative indicator behavior across 1-minute → Daily timeframes without manual retuning of each parameter.
HH/HL structure plus streaks: Instead of relying solely on moving averages or ADX, the script explicitly measures price structure (HH/HL counts and streaks) and blends that with slope/ADX. This reduces false trending signals on noisy price action.
Normalized, weighted combination with caps: Each component is normalized (0–100) and combined by predefined weights; cap thresholds prevent extreme component values from dominating the result. This is a design intended to produce interpretable confidence % rather than opaque binary outputs.
History and loop safety: The code enforces a cap and protects loop lengths against available historical bars to avoid runtime errors and to ensure the script remains stable on short data series.
Practical guardrails: The script includes notification behavior to highlight manual timeframe mismatches and avoids dynamic indexing patterns that can cause unreliable results on small bar histories.
These design decisions — adaptive scaling, structural HH/HL scoring, capped normalization and explicit safety limits — are the elements that distinguish Trend Filter from simple, single-indicator overlays (EMA-only, ADX-only, etc.) and form the basis for why closed-source protection is reasonable for commercial/invite-only publication.
User controls & recommended usage
Reference Timeframe: Auto (uses chart TF) or choose a manual reference TF (1min → D). When manual TF is selected, the table shows a mismatch warning if the chart TF differs.
Table placement & colors: Positioning and appearance of the on-chart table are configurable.
Confidence thresholds: The indicator uses internal thresholds to mark high/medium/low confidence. Users can interpret the Confidence % relative to those ranges.
Alerts: Built-in alerts fire only on direction changes (to Up, Down, or Ranging). Use alerts as a signal to review the chart rather than an instruction to trade automatically.
How traders typically use it
Add Trend Filter as an overlay to your chart.
Confirm that the recommended reference timeframe is appropriate (Auto will adjust automatically).
Use Direction and Confidence % together: high Confidence + Up (or Down) suggests staying with trend; Ranging suggests avoiding trend-following entries.
Combine this filter with your entry/exit rules (price structure, support/resistance, or your preferred signal generator).
Disclaimers & limitations
This is a decision-support indicator, not an automated execution strategy. It does not place orders and does not provide P/L or backtesting statistics.
Confidence % is an aggregated measure — treat it as context, not a guarantee.
Results vary across symbols and timeframes; use appropriate position sizing and risk controls.
The code intentionally includes history and loop safeguards; on very short histories the indicator may display conservative results.

strongResistanceActually it is education purpose. This indicator is designed to help traders clearly identify strong Support & Resistance (SNR) levels along with high-probability Buy & Sell..
The indicator works smoothly on lower timeframes for binary trading.

Leading Leaders: RS / 52W / EPS+Sales + Volume (Clustered)Leading Leaders – Multi-Factor Institutional Strength & Accumulation Framework
This indicator is a multi-factor leadership and accumulation framework designed to identify stocks that are behaving like institutional leaders, not just showing temporary strength.
It is not a mashup of unrelated indicators.
Each component measures a different dimension of leadership, and the script combines them into a structured scoring and clustering model to identify persistent, high-quality candidates suitable for swing trading, momentum continuation, and breakout anticipation.
🔹 Core Idea
True leaders show repeated constructive behavior, not one-day spikes.
This script evaluates four independent dimensions of leadership on every bar and then measures persistence over time using a rolling cluster score.
The goal is to answer one question clearly:
Is this stock consistently behaving like a leader while institutions are accumulating?
🔹 Components Explained
1) Relative Strength (RS Approximation)
The script compares the stock’s daily performance against a benchmark index over a configurable lookback period and normalizes it.
This identifies stocks that are outperforming the broader market, similar in concept to RS ranking models used by professional momentum traders.
2) Proximity to 52-Week High
Strong leaders tend to trade near their highs, not deep below them.
The script checks whether price is within a defined percentage of its 52-week high, filtering out structurally weak stocks.
3) Fundamental Growth (EPS & Sales)
Institutional leadership is usually backed by real business growth.
The script evaluates:
EPS YoY growth
EPS QoQ growth
Sales YoY growth
Only stocks meeting minimum growth thresholds contribute to the leadership score.
4) Volume Health (Accumulation Logic)
Instead of using raw volume spikes, the script evaluates contextual volume behavior:
Advances with expanding volume → institutional participation
Pullbacks or tight bars with contracting volume → lack of selling pressure
This aligns with accumulation principles used by O’Neil, Minervini, and professional momentum traders.
🔹 Leadership Scoring Model
Each bar receives a binary score for each component:
Relative Strength
52-Week High Proximity
Fundamental Growth
Volume Health
Each bar scores 0–4 points.
This creates a daily leadership score, not a trade signal.
🔹 Cluster Scoring (Persistence Filter)
Rather than acting on a single bar, the script computes a rolling cluster score across recent bars.
The cluster score represents:
How often the stock has shown leadership behavior recently
This persistence filter is what separates:
one-day wonders
from
true institutional leaders under accumulation
Stocks triggering strong cluster conditions have shown repeated strength, not isolated spikes.
🔹 Visual Design Philosophy
This script is intentionally designed for clarity and scan-ability:
Background shading highlights leadership intensity
Bar coloring emphasizes strongest conditions
Optional labels summarize why a bar qualifies
No external indicators are required, and the chart remains clean and readable.
🔹 How to Use
This indicator does NOT generate buy/sell signals.
Typical professional use cases include:
Building watchlists of high-quality leaders
Identifying accumulation before breakouts
Filtering for momentum continuation candidates
Avoiding low-quality or noisy stocks
Market condition analysis during weak breadth environments
Best suited for:
Daily and higher timeframes
Swing trading
Momentum and breakout strategies
⚠️ Important Notes
This is a research and analysis tool, not a trading system.
No future data is used; calculations are non-repainting.
Always combine with market context, risk management, and execution rules.
✅ Why This Script Is Original
Uses a multi-dimension leadership framework, not a single indicator
Focuses on behavioral persistence (cluster scoring) rather than point-in-time signals
Applies contextual volume logic, not raw volume spikes
Designed specifically for leader identification and accumulation analysis
This combination and scoring methodology is not a direct reproduction of any single open-source script and is intended to provide structured insight into institutional stock behavior.

Institutional MF-Vol Compression Scanner v4.0 [BIG]═══════════════════════════════════════════════════════════════════════════════
BIG COMPRESSION SCANNER v4.0
═══════════════════════════════════════════════════════════════════════════════
OVERVIEW
The BIG Compression Scanner v4.0 is a proprietary volatility regime detection system designed for systematic Daily options deployment. This framework identifies pre-expansion volatility compression zones through multi-dimensional market structure analysis, combining institutional positioning patterns with hierarchical timeframe confirmation and options market structure to generate high-conviction directional signals for premium strategies.
The methodology synthesizes volatility dynamics, liquidity flow patterns, and cross-timeframe regime alignment into a probabilistic scoring system that isolates asymmetric risk-reward setups characteristic of compression-to-expansion transitions. The framework is calibrated specifically for 30-45 DTE options strategies where timing precision and volatility environment assessment are critical to edge generation.
═══════════════════════════════════════════════════════════════════════════════
CORE METHODOLOGY
═══════════════════════════════════════════════════════════════════════════════
• Proprietary Compression Detection
The system employs a multi-factor compression identification framework that monitors volatility regime transitions across price dispersion metrics and range contraction patterns. Unlike single-indicator squeeze systems, this methodology uses weighted ensemble logic to distinguish true pre-expansion compression from random consolidation noise.
Compression strength is quantified through a proprietary scoring algorithm (0-100%) that evaluates:
- Statistical volatility contraction relative to historical norms
- Price range compression within dynamic envelope systems
- Institutional volume signature analysis during low-volatility periods
- Cross-timeframe compression alignment (Daily/Weekly/Monthly hierarchy)
The framework filters compression events based on minimum strength thresholds and multi-bar confirmation to eliminate premature signals characteristic of retail squeeze indicators.
• Hierarchical Multi-Timeframe Architecture
The indicator integrates a three-tier temporal analysis structure where higher timeframes constrain and validate lower timeframe signals:
Strategic Layer (Monthly) – Establishes macro directional bias and identifies structural market positioning. This layer determines whether intermediate trends align with or counter dominant regime dynamics.
Structural Layer (Weekly) – Provides tactical context through key price levels, momentum assessment, and volatility regime confirmation. Weekly analysis filters signals that would occur in unfavorable proximity to structural inflection zones.
Execution Layer (Daily) – Generates precise entry timing through intraday regime shift detection, momentum confluence analysis, and institutional flow pattern recognition.
Each layer contributes weighted influence to the composite directional probability model, with recalibration logic that adjusts timeframe importance based on current market regime characteristics. The exact weighting algorithm is proprietary and adapts to volatility environment dynamics.
• Options Market Structure Integration
Version 4.0 incorporates options-specific market intelligence not available in standard technical analysis frameworks:
Volatility Environment Assessment – The system continuously monitors implied volatility regime characteristics through proprietary estimation models. These models identify whether current premium levels favor buying or selling strategies, adjusting signal generation accordingly.
Temporal Decay Awareness – Built-in expiration cycle logic ensures signals only trigger when sufficient time value remains for thesis development. The framework approximates days-to-expiration and applies minimum threshold filters to prevent entries in high theta decay regimes.
Greeks-Aware Targeting – Price targets are dynamically calibrated based on volatility expansion expectations and estimated leverage characteristics. Target multipliers adjust to current options market structure rather than using fixed risk-reward ratios.
Premium Environment Classification – Signals are enhanced with real-time assessment of whether current volatility levels favor long premium, short premium, or spread strategies based on historical percentile analysis.
• Probabilistic Directional Scoring System
Rather than binary bullish/bearish classification, the framework generates probability-weighted directional bias through a proprietary multi-factor model. This model synthesizes trend alignment metrics, momentum characteristics, structural positioning, and institutional flow signatures into normalized probability distributions.
The scoring system evaluates dozens of market structure variables across multiple timeframes, applies regime-dependent weighting, and produces directional probabilities that reflect actual edge rather than arbitrary technical indicator thresholds. Signal generation occurs only when directional probability exceeds user-defined conviction thresholds (55-65% depending on sensitivity setting).
This probabilistic approach allows traders to calibrate position sizing and strategy selection (outright vs. spreads) to the strength of directional conviction rather than treating all signals as equal weight.
• Institutional Flow Detection
The framework monitors volume and price interaction patterns characteristic of institutional accumulation or distribution during compression phases. This analysis identifies whether compression zones contain building directional positions (high probability of sustained move post-breakout) versus thin, choppy consolidation (high false breakout risk).
Flow detection employs proprietary algorithms that distinguish genuine institutional activity from retail volume spikes, providing critical context for signal validation.
═══════════════════════════════════════════════════════════════════════════════
SIGNAL ARCHITECTURE
═══════════════════════════════════════════════════════════════════════════════
Call Option Signals trigger when compression strength, directional probability, timeframe alignment, options market structure, and institutional flow patterns simultaneously satisfy proprietary threshold criteria. Signals are filtered against weekly structural levels to avoid low-probability entries near major resistance zones.
Put Option Signals follow equivalent logic with inverse directional parameters, ensuring symmetrical framework application across bull and bear setups.
All signals include:
- Directional conviction probability (percentage)
- Current volatility environment assessment (IV Rank proxy)
- Dynamic price target based on expansion expectations
- Multi-timeframe alignment status
Signal cooldown logic prevents excessive signal generation during extended consolidation periods, maintaining signal quality over quantity.
═══════════════════════════════════════════════════════════════════════════════
VISUAL INTELLIGENCE
═══════════════════════════════════════════════════════════════════════════════
Real-Time Multi-Timeframe Dashboard
The top-right panel provides continuous visibility into:
- Trend alignment across Daily/Weekly/Monthly timeframes
- Current compression status at each temporal layer
- Momentum regime characteristics (RSI values)
- Options environment assessment (IV Rank, optimal strategy)
- Composite signal readiness (compression strength percentage)
This dashboard enables rapid regime assessment without manual multi-timeframe chart analysis.
Chart Integration
Visual overlays include:
- Volatility envelope systems (dynamic bands)
- Weekly structural price levels (pivot, resistance, support)
- Compression zone highlighting (background shading)
- Active squeeze indicators (Daily and Weekly differentiation)
Signal Labels
When setups trigger, comprehensive labels display:
📈 CALL OPTION
Prob: XX%
IV Rank: XX%
Target: $XXX.XX
Labels provide all critical execution information without requiring dashboard consultation.
═══════════════════════════════════════════════════════════════════════════════
KEY CAPABILITIES
═══════════════════════════════════════════════════════════════════════════════
- Proprietary multi-factor compression detection with adaptive thresholds
- Hierarchical multi-timeframe confirmation (Daily/Weekly/Monthly)
- Options-specific filters (IV regime, DTE requirements, Greeks awareness)
- Probabilistic directional scoring (0-100% conviction levels)
- Institutional flow pattern recognition during compression
- Weekly structural level integration with proximity filters
- Dynamic target calibration based on volatility expansion expectations
- Real-time multi-timeframe regime dashboard
- Customizable sensitivity and threshold parameters
- Non-repainting signal architecture (bar close confirmation)
- Comprehensive alert system for proactive monitoring
═══════════════════════════════════════════════════════════════════════════════
APPLICATION GUIDELINES
═══════════════════════════════════════════════════════════════════════════════
1. Timeframe Selection
Apply to Daily (D1) charts only. Framework calibration is timeframe-specific; other intervals produce suboptimal results.
2. Options Mode Activation
Enable Options Trading Mode for premium strategy optimization. This activates IV filtering, DTE thresholds, and Greeks-aware targeting.
3. Strategy Calibration
- Premium Buying: Set IV threshold to 50th percentile, DTE minimum 30+ days, target multiplier 2.5-3.0×
- Premium Selling: Set IV threshold to 70th+ percentile, DTE minimum 20-30 days, target multiplier 1.5-2.0×
4. MTF Dashboard Monitoring
Verify multi-timeframe alignment before execution:
- Ideal setup: Daily + Weekly compression both active
- Confirm trend alignment across timeframes
- Check IV Rank for premium environment assessment
- Wait for "READY" status (green) indicating threshold satisfaction
5. Signal Execution
When labels appear:
- Review directional probability (target >65% for high conviction)
- Assess IV environment (low IV favors buying, high IV favors selling)
- Use price target for strike selection and profit objectives
- Consider 30-45 DTE options for thesis development time
6. Risk Management
- Position size: 2-5% options capital per signal
- Stop loss: Exit if compression breaks opposite direction without follow-through
- Time stop: Reassess if position stagnant after 5-7 days
- Profit taking: Scale out at provided targets or weekly pivot levels
7. Sensitivity Adjustment
- High (55%): More signals, lower conviction, diversified approach
- Medium (60%): Balanced, default setting (2-4 signals/month typical)
- Low (65%): Fewer signals, higher conviction, concentrated positions
═══════════════════════════════════════════════════════════════════════════════
FRAMEWORK LIMITATIONS
═══════════════════════════════════════════════════════════════════════════════
- Optimized exclusively for Daily timeframe analysis
- Compression development requires patience (2-4 weeks typical)
- IV metrics are proprietary proxies, not direct exchange data
- Greeks estimations approximate actual options contract characteristics
- DTE calculations simplified vs. precise monthly expiration dates
- Multi-timeframe filtering reduces but cannot eliminate false breakouts
- Requires liquid options markets (tight spreads, adequate open interest)
- Not designed for earnings-driven volatility events (IV crush risk)
- Framework identifies timing, not specific strike or expiration selection
═══════════════════════════════════════════════════════════════════════════════
TECHNICAL SPECIFICATIONS
═══════════════════════════════════════════════════════════════════════════════
- Pine Script v5 architecture
- Non-repainting signal confirmation (bar close validation)
- Multi-security data integration (Weekly/Monthly via request.security)
- Real-time multi-timeframe analysis dashboard
- 4 alert conditions (Call/Put options, directional generic)
- Fully customizable parameters (compression, scoring, filters, visuals)
- Professional-grade visual hierarchy and information density
═══════════════════════════════════════════════════════════════════════════════
PROFESSIONAL CONTEXT
═══════════════════════════════════════════════════════════════════════════════
This framework is designed for systematic options traders with working knowledge of:
- Volatility regime dynamics and expansion/contraction cycles
- Options Greeks and their impact on P&L across various market conditions
- Implied Volatility Rank interpretation and premium pricing assessment
- Multi-timeframe analysis methodology and trend hierarchy
- Risk-adjusted position sizing and portfolio construction principles
The system identifies when market structure favors options deployment but does not prescribe how to construct positions. Strike selection, expiration choice, spread architecture, and position sizing require independent trader judgment based on account parameters and risk tolerance.
Optimal deployment combines this framework with:
- Options analytics platform (actual IV, Greeks, probability calculations)
- Earnings calendar awareness (pre-earnings IV inflation vs. post-earnings crush)
- Broader market regime context (VIX, correlation, sector rotation)
- Portfolio-level risk management (concentration limits, correlation analysis)
═══════════════════════════════════════════════════════════════════════════════
Proprietary compression-to-expansion framework for systematic Daily options deployment. Methodology incorporates multi-dimensional volatility analysis, hierarchical timeframe confirmation, and options market structure intelligence.

NQ Market DNA MapNQ Market DNA Map
The Market DNA Map indicator is designed to visualize key trading sessions (Asia, London, and New York) on the chart while providing a probabilistic lookup table based on historical session patterns. This tool draws session boxes with midline references, extends session highs and lows until mitigated or a daily hardstop (16:00 in the selected timezone), and displays a summary table with statistical metrics derived from predefined historical data. The data mappings are hardcoded, reflecting an analytical approach for session-based price action. Note that all probabilities and metrics are based on past observations and should not be interpreted as predictions or guarantees of future market behavior. These statistics are only tested and generated based on NQ futures. This indicator is for educational and informational purposes only; trading decisions should incorporate additional analysis and risk management.
Key Features
• Session Visualization:
o Draws colored boxes for the Asia, London, and New York sessions, updating in real-time as the session progresses.
o Includes a dotted midline within each box for quick reference to the session's midpoint.
o Extends horizontal lines from the final session high and low until price mitigates them (crossing both above and below) or the daily hardstop is reached.
• Probabilistic Table:
o A customizable-position table appears on the chart (once the New York open is detected), summarizing conditions and metrics for the current day's setup.
o Conditions include: Asia range relative to its rolling average, London open relative to Asia's midpoint, London sweep type (high only, low only, both, or none), and New York open relative to London's midpoint.
o Metrics displayed include:
First High Sweep %: Probability (based on historical data) that the high of the prior session is swept first during New York.
First Low Sweep %: Probability that the low is swept first.
Med Pen ↑ (High): Median penetration distance (in points) above the session high.
Med Pen ↓ (Low): Median penetration below the session low.
Fail High -> Low %: Failure rate where an initial high sweep fails and reverses to sweep the low.
Fail Low -> High %: Failure rate for an initial low sweep reversing to the high.
Sample Size: Number of historical observations for the matching pattern (n value), with a rating of "High" (n ≥ 150), "Mid" (n ≥ 75), or "Low" (n < 75) to indicate data reliability.
o The table uses color-coding for quick interpretation: Green for above-average/above-mid conditions, red for below, and neutral tones for metrics.
• Asia Range Ratio: Calculates a rolling average of Asia session ranges over a user-defined lookback period to classify the current Asia range as above or below average.
• Hardstop Logic: All extensions cease at 16:00 in the selected timezone to align with typical daily cycle resets.
Inputs and Customization
• Calculation Timezone: Select from predefined options (e.g., "America/New_York", "Europe/London") to align session times with your preferred market clock. Default: "America/New_York".
• Session Times:
o Asia Session: Default "2000-0200" (8:00 PM to 2:00 AM in the selected timezone).
o London Session: Default "0200-0800" (2:00 AM to 8:00 AM).
o NY Session: Default "0800-1600" (8:00 AM to 4:00 PM). These can be adjusted to match specific market hours or personal preferences.
• Asia Ratio Rolling Window: Integer lookback (default: 20) for calculating the average Asia session range ratio (range divided by open price).
• Table Position: Choose where the summary table appears on the chart (e.g., top_right, bottom_right). Default: top_right.
• Colors: Customizable box fill and border colors for each session (Asia: yellow tones, London: blue, NY: gray) with transparency settings for overlay compatibility.
How It Works
1. Session Detection: The indicator checks the current bar's time against user-defined sessions in the selected timezone. Sessions are non-overlapping and assume a 24-hour cycle.
2. Box and Line Drawing:
o At session start, a box is initialized from the open/high/low.
o As the session progresses, the box expands to capture the live high/low, with the midline updating dynamically.
o Upon session end, final high/low are locked, and extension lines are drawn horizontally.
o Extensions persist until price fully mitigates the level (high ≥ level and low ≤ level) or the hardstop time is passed.
3. Asia Ratio Calculation: Maintains a historical array of Asia range ratios (high-low divided by open). The current ratio is compared to the average over the lookback to classify as "Above Avg" or "Below Avg".
4. Key Generation and Lookup:
o A unique key is built from four binary/ternary codes: Asia classification (0/1), London open vs. Asia mid (0/1), London sweep type (0=high only, 1=low only, 2=both, 3=none), NY open vs. London mid (0/1).
o This key queries a hardcoded map of historical data (e.g., "0_0_0_0" for above-avg Asia, above-mid London open, high-only sweep, above-mid NY open).
o Data includes sample size, probabilities, failure rates, and median penetrations, all derived from historical analysis (total samples across all keys: approximately 5,000+ based on the provided mappings).
5. Table Rendering: On the last bar (real-time), the table populates with the current key's data. Metrics are formatted for readability, and penetration values are scaled to the current London high/low in points for context.
6. Performance Notes: The indicator uses up to 500 lines and boxes for extensions and visuals, ensuring compatibility with TradingView limits. It is overlay=true, so it plots directly on the price chart.
Data Source and Limitations
The probabilistic data is hardcoded and represents a compilation of historical session patterns from backtested or observed market behavior on NQ futures. Exact data collection methodology is not specified in the script, but values are presented as-is for illustrative purposes. Users should verify applicability to their specific symbol/timeframe, as markets evolve and past patterns may not repeat. Low-sample patterns (rated "Low") have higher uncertainty.
This indicator does not generate buy/sell signals, alerts, or trading strategies—it solely provides visual and statistical context. Always combine with other tools, fundamental analysis, and proper risk controls. Trading involves risk of loss; no performance guarantees are implied. If republishing or modifying, please credit the original structure and adhere to TradingView's publication guidelines. For questions on usage, refer to TradingView documentation on session indicators and probabilistic tools.

Moving Average ExponentialThe EMA 50 Trend Filter At the heart of the Sniper system lies the 50-period Exponential Moving Average. Unlike simple moving averages, the EMA applies a weighting factor to recent price data, significantly reducing lag. Role in Strategy:
Trend Identification: Serves as the binary divider between Long and Short bias.
Dynamic Structure: Acts as dynamic support in uptrends and resistance in downtrends.
Signal Filtering: The algorithm automatically suppresses any 'Buy' signals below the line and 'Sell' signals above it, ensuring you never trade against the institutional momentum.
