OHLC Daily Resolution BandsShout out to nPE- for the idea.
Bands made with stdev from 10 day OHLC.
Keeps resolution to daily, so you can use bands as daily pivots for day trading.
Upper band 1=yesterday close + 0.5 std(ohlc,10)
Upper band 1=yesterday close + 1 std(ohlc,10)
Mid=yesterday close
Lower band 1=yesterday close - 0.5 std(ohlc,10)
Lower band 2=yesterday close - 1 std(ohlc,1
스크립트에서 "band"에 대해 찾기

ATR BandThe indicator is intended to be used with daily or higher time frames.
Options:
Mark out of Band: show a symbol if price has moved beyond the band

ATR BandThe indicator is intended to be used with daily or higher time frames.
Options:
Mark out of Band: show a symbol is price has moved beyond the band

ATR BandThe indicator is intended to be used with daily or higher time frames.
Options:
Mark out of Band: show a symbol is price has moved beyond the band

Fibonacci BandsCreates bands based on Fibonacci numbers and the SMA.
Based on indicator by Big Mike on futures.io
How to trade
- Best to use in ranging market conditions
- Place on two different time frames eg. 15 and 55 min.
- Take trades off either short or long term chart.
- Best trades occur when both charts show same trigger/condition.
- Trades are short term reversals in direction of major trend on longer term chart unless you expect a trend reversal.
- Determine which band is the limiting band for the volatility of the instrument.
- When the market closes outside of the limiting band then returns inside, take a long/short one tick above/below the high/low of the previous bar.
- Place stop below/above the low/high of the the recent swing low/high.
- Set targets at opposite band of chart
VWAP Stdev Bands v2 Modoriginal script by /u/SandroTurriate/ - I just made some small changes.
Vwap + standard deviation bands. Good for reversal trading among other things. Used intraday.
Very useful when price is ranging.
I added the option to fill the spaces between the deviation lines with color and also the option to add some extra bands. That's about it. Color/length/style etc is customizable.
Standard Error Bands by @XeL_arjonaStandard Error Bands - Code by @XeL_arjona
Original implementation by:
Traders issue: Stocks & Commodities V. 14:9 (375-379):
Standard Error Bands by Jon Andersen
Version 1
For a quick and publicly open explanation of this Statistical indicator, you can refer at Here!
Extract from the former URL:
Standard Error bands are quite different than Bollinger's. First, they are bands constructed around a linear regression curve. Second, the bands are based on two standard errors above and below this regression line. The error bands measure the standard error of the estimate around the linear regression line. Therefore, as a price series follows the course of the regression line the bands will narrow, showing little error in the estimate. As the market gets noisy and random, the error will be greater resulting in wider bands.

Bollinger Band TouchThis script simply colors the background when price hits or exceeds the bollinger bands. Just a nice visual cue.

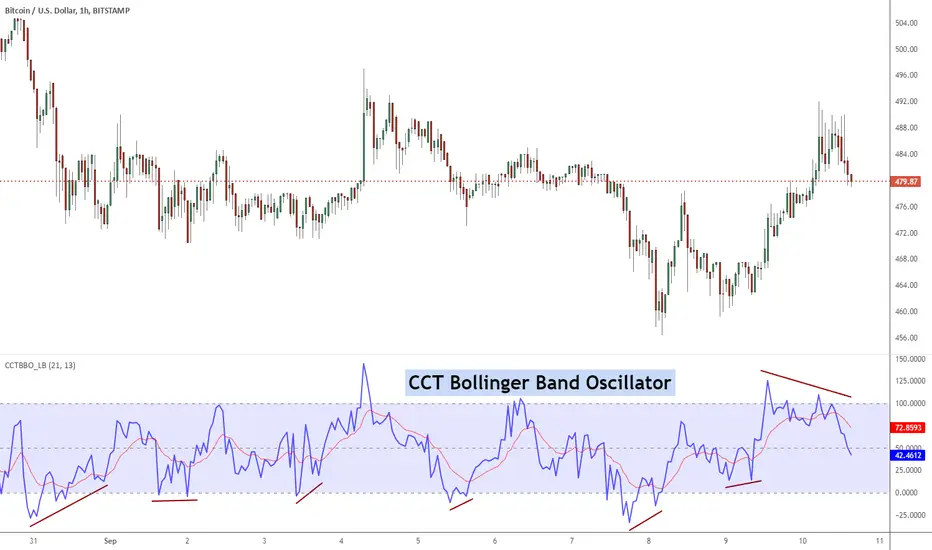
CCT Bollinger Band OscillatorThe CCT Bollinger Band Oscillator (CCTBO), developed by Steve Karnish of Cedar Creek Trading, reconfigures John Bollinger's classic Bollinger Bands (envelopes plotted at two Standard Deviations above and below a moving average) by drawing two parallel lines replacing the envelopes. The parallel lines represent a measurement of two Standard Deviations from the mean and are assigned a value of zero and 100 on the chart.
The indicator represents the price as it travels above and below the mean (50%) and outside the two standard deviations (zero and 100). Penetration of the upper band represents overbought conditions while penetration of the lower band signifies oversold conditions. Usage of the CCT Bollinger Band Oscillator to identify 'failure swings' and 'divergences' can lead to significant reversals.
List of my other indicators:
- Chart:
- GDoc: docs.google.com
SymFlex Band - MAD, RSI, ATRThe SymFlex Band is an adaptive volatility and momentum framework that merges
three independent band models into a unified analytical tool.
• The MAD Band measures deviation from the moving average using Median Absolute Deviation,
providing a stable view of range-based volatility.
• The RSI Momentum Band adjusts its upper and lower boundaries asymmetrically,
expanding in the direction of momentum and contracting against it.
• The ATR Band captures classical volatility expansion for breakout and trend-continuation conditions.
Rather than placing the three indicators separately on a chart, the script synchronizes
their center-line logic, compares their band distances, identifies the nearest active band,
and displays real-time correlation between their dynamic ranges.
This structure helps traders understand whether price behavior is dominated by
range compression, momentum imbalance, or volatility expansion.
The table summarizes:
• active band ranges
• breakout status
• distance from each band
• cross-band correlation
This indicator is designed purely for analysis. It does not generate trade entries.

Opening Candle Zone with ATR Bands by nkChartsThis indicator highlights the opening range of each trading session and projects dynamic ATR-based zones around it.
Key Features
Plots high and low levels of the opening candle for each new daily session.
Extends these levels across the session, providing clear intraday support and resistance zones.
Adds ATR-based offset bands above and below the opening range for volatility-adjusted levels.
Customizable colors, ATR length, and multiplier for flexible use across markets and timeframes.
Adjustable session history limit to control how many past levels remain on the chart.
How to Use:
The opening range high/low often acts as strong intraday support or resistance.
The ATR bands give an adaptive volatility buffer, useful for breakout or mean-reversion strategies.
Works on any market with clear session opens.
This tool is designed for traders who want to combine session-based price action with volatility insights, helping identify potential breakouts, reversals, or consolidation areas throughout the day.
⚠️ Disclaimer: This indicator is for educational purposes only. It does not provide financial advice or guarantee profits. Always perform your own analysis before making trading decisions.

350DMA bands + Z-score (V2)This script extends the classic 350-day moving average (350DMA) by building dynamic valuation bands and a Z-Score framework to evaluate how far price deviates from its long-term mean.
Features
350DMA Anchor: Uses the 350-day simple moving average as the baseline reference.
Fixed Multipliers: Key bands plotted at ×0.625, ×1.0, ×1.6, ×2.0, and ×2.5 of the 350DMA — historically significant levels for cycle analysis.
Z-Score Mapping: Price is converted into a Z-Score on a scale from +2 (deep undervaluation) to –2 (extreme overvaluation), using log-space interpolation for accuracy.
Custom Display: HUD panel and on-chart label show the current Z-Score in real time.
Clamp Option: Users can toggle between raw Z values or capped values (±2).
How to Use
Valuation Context: The 350DMA is often considered a “fair value” anchor; large deviations identify cycles of under- or over-valuation.
Z-Score Insight:
Positive Z values suggest favorable accumulation zones where price is below long-term average.
Negative Z values highlight zones of stretched valuation, often associated with distribution or profit-taking.
Strategic Application: This is not a standalone trading system — it works best in confluence with other indicators, cycle models, or macro analysis.
Originality
Unlike a simple DMA overlay, this script:
Provides multiple cycle-based bands derived from the 350DMA.
Applies a logarithmic Z-Score mapping for more precise long-term scaling.
Adds an integrated HUD and labeling system for quick interpretation.

Fibonacci & Bollinger Bands StrategyTrading System: Fibonacci & Bollinger Bands Strategy
1. Session Timing
Trade only from 1 PM onwards.
Identify the first candle on the 1 PM vertical line to set the market direction.
If it's a bullish candle, look for buy opportunities.
If it's a bearish candle, look for sell opportunities.
2. Fibonacci Retracement as a Measuring Tool
Identify the recent swing high and swing low before the 1 PM session.
Draw Fibonacci retracement levels from low to high (for buys) or high to low (for sells).
Key retracement levels to watch: 0.0%, 50.0%, and 100.0%.
Entries can be placed at 0.0% or 50.0%, aiming for a move toward 100.0% retracement.
3. Bollinger Bands Confirmation
If the Bollinger Bands are above price, expect a downward move (sell).
If the Bollinger Bands are below price, expect an upward move (buy).
Use this as additional confirmation for your Fibonacci-based trade.
4. Entry & Exit Rules
Entry:
If the 1 PM candle confirms a bullish bias, enter long near Fibonacci 0.0% or 50.0%.
If the 1 PM candle confirms a bearish bias, enter short near Fibonacci 0.0% or 50.0%.
Stop Loss: Below (for buys) or above (for sells) the swing low/high used for Fibonacci.
Take Profit: Target 100.0% retracement level or next key resistance/support.
5. Risk Management
Risk 1-2% per trade.
Avoid trading if price is too far from Fibonacci levels.
Confirm setup with Bollinger Bands alignment.

Reverse Double Smoothed Relative Strength Index Bands[CC]The Reverse Double Smoothed Relative Strength Index Bands is a custom script of mine that is another part of my RSI indicator series, which I will be publishing over the next week or so. This takes my Double Smoothed Relative Strength Index script and applies the Reverse RSI formula to create a new Bollinger Bands type indicator. This concept can work for almost any oscillator with some slight tweaking. I have a reverse RSI being calculated for each major RSI level to give you an approximation of what the price would look like if that RSI level was hit. Feel free to tweak the RSI levels of course. I will publish more Reverse indicators since that doesn't seem to be a topic that is touched on very frequently. I have color coded the indicator to show darker colors when it is a strong signal and lighter colors for normal signals. Buy when the lines turn green and sell when they turn red.
This was a custom request from @kerpiciwuasile so let me know if you want to see me publish another custom script!

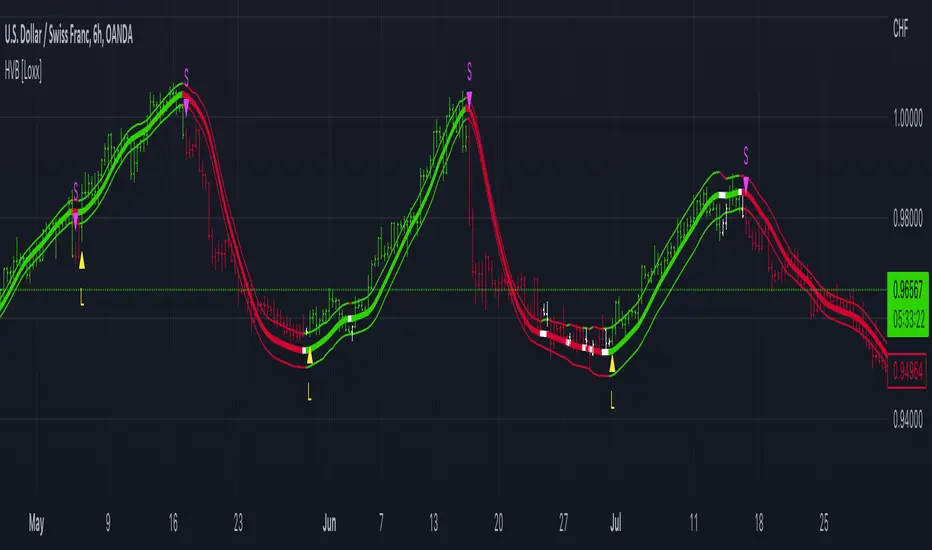
Historical Volatility Bands [Loxx]Historical Volatility Bands are constructed using:
Average as the middle line.
Upper and lower bands using the Historical Volatility for bands calculation.
What is Historical Volatility?
Historical Volatility (HV) is a statistical measure of the dispersion of returns for a given security or market index over a given period of time. Generally, this measure is calculated by determining the average deviation from the average price of a financial instrument in the given time period. Using standard deviation is the most common, but not the only, way to calculate Historical Volatility.
The higher the Historical Volatility value, the riskier the security. However, that is not necessarily a bad result as risk works both ways - bullish and bearish, i.e: Historical Volatility is not a directional indicator and should not be used as other directional indicators are used. Use to to determine the rising and falling price change volatility.
The color of the middle line, unlike the bands colors, has 3 colors. When colors of the bands are the same, then the middle line has the same color, otherwise it's white.
Included
Alerts
Signals
Loxx's Expanded Source Types
Bar coloring
Jurik Bands//A follow up for my JMA script. This script is inspired by (and dedicated to) closure of sales (today, Oct 20 '21) of the famous Jurik Research.
...
Jurik Research, the real people who been doing real things by using the real instruments, while many others been reading books "How to become a billionaire in 2 days", watching 5687 hours videos of how to use RSI , and studying+applying machine learning to everything cuz suddenly it became trendy xD
...
In my JMA script I've said that JMA takes into account volatility. But how exactly? In fact, it's based on smth called Jurik Bands. Thing is they can be/should be used as an independent instrument. I won't lie, I've developed smth very similar myself for mean-reverting purposes, but we ain't gonna talk about this now (my stuff is much simpler, saying bye-bye to entropy).
...
The code is on purpose in Pine4, because lmao I'm not gonna call my stuff "Indicators", they don't "Indicate" anything. And it's on purpose doesn't follow any "coding conventions" made by geeks to make their stuff look more important. My conventions are simple: less code as possible and as simple as possible so we can actually do business based on these instruments.
...
Live Long And Prosper
Box-Cox Log BandsExperimental:
Uses the Box-Cox Transformer with a deflection on the inversion to create log bands.
to be used in log scaled charts.

Combo Backtest 123 Reversal & STARC BandsThis is combo strategies for get a cumulative signal.
First strategy
This System was created from the Book "How I Tripled My Money In The
Futures Market" by Ulf Jensen, Page 183. This is reverse type of strategies.
The strategy buys at market, if close price is higher than the previous close
during 2 days and the meaning of 9-days Stochastic Slow Oscillator is lower than 50.
The strategy sells at market, if close price is lower than the previous close price
during 2 days and the meaning of 9-days Stochastic Fast Oscillator is higher than 50.
Second strategy
A type of technical indicator that is created by plotting two bands around
a short-term simple moving average (SMA) of an underlying asset's price.
The upper band is created by adding a value of the average true range
(ATR) - a popular indicator used by technical traders - to the moving average.
The lower band is created by subtracting a value of the ATR from the SMA.
STARC is an acronym for Stoller Average Range Channels. The indicator is
named after its creator, Manning Stoller.
WARNING:
- For purpose educate only
- This script to change bars colors.

Dual Mean Reversion Channel (adjusted lower band)This is a public and open-source lighter version compared to the "Overextended Price Channel" which is provided complimentaty to the Trend Insight System.
Introduction :
Channels are very useful tools to assess overextended price, volatility and upcoming retracement or impulsive moves (such as Bollinger Band squeezes). It is an indispensable addition to any trader using Mean Reversion theory for a scalp-trade or swing-trade.
This script contains :
- 2 channels Keltner-style, using the True Range for volatility
- customizable volatility (channel width) and smoothing period
- a standard selection of moving average ; SMA, EMA, VWMA
- an embedded readjustment of the lower bands to avoid the drop on a logarithmic scale (see explanation below)
Why another channel indicator ?
I have found most conventional channels to be either not based on "proper" volatility (e.g. standard deviation of price action for Bollinger Band), or the bottom channel to be ill adapted to the logarithmic scale and plunges to 0 on some high volatility periods, messing with readability on logarithmic auto-scaled chart.
Also, I find the channels to be most useful when superimposed with another one of longer length; especially a pair of channels with a 50 and 200 period moving average respectively. Mean Reversion traders that mostly trade the 50 and 200 SMA/EMA know what I am talking about as having a channel helps to have a better visual for a proper of entry and exit point.
Disclaimer :
This indicator was originally intended to be used along with the Trend Insight System to improve performance, and the default configuration mostly backtested on BTCUSD.
Please use with caution, proper risk management and along with your favorite oscillator, candlestick reading and signals system.
Some explanation :
Based on Mean Reversion paradigm, everything has a tendency to revert back to the mean :
- when the price enters the upper channel, it is supposed to be (or start getting) overbought as the market is getting overheated, thus prone to correction,
- on the other hand, when the price enters the lower channel, it is supposed to be (or getting) oversold and the market looks favorable for a buy-in.
Depending on the trading style used, a trader will usually either wait until the price leaves the channel towards the mean before taking action (conservative style) or you will set limit orders inside the channel as you expect a reversion to the mean (more agressive/risky style).
With two channels, more complex (and maybe precise) rules can be built to optimize one's trading strategy.
Important notes :
In the end, sticking with 50/200 length and a single setting on volatility might be wiser, be wary of overoptimization which is risky at best and counter productive at worst (according to legendary traders such as Mark Douglas). Even if, needless to say, the volatility needs to be adjusted between a nascent and volatile market (such as crypto) compared to standard call markets that are much less volatile.
End notes :
It will always be considered a work in progress to help bring out the best of trading with channels, any comment and suggestion are welcomed.

2 Multi-Timeframe Bollinger BandsThis is two separate Bollinger bands in one study. Customizable middle BB line type ( SMA , EMA , VWMA ), legnth, colors, and deviations provided at .5 increments.
Someone else has a very similar Bollinger Band study but the code was hidden, so I figured I would remake as a learning challenge since I'm new to pinescript and this is the best way to learn it imo.
There will be updates to this script in the future but for now it serves its purpose lol. Publishing this version early as I wanted to give some friends access to it
In terms of usage, I like 4h 50 SMA alot . Having two sets of Bollinger bands is nice so you can turn one off or swap between time frames and such. In terms of techniques using both bbands, I haven't really played with it too much yet but simple things like 1h 50sma bbands expanding past the 4h 50sma bbands probably indicate an exaggerated move in that specific time frame, etc etc.
Hope this helps!

Combo Backtest 123 Reversal & Prime Number Bands This is combo strategies for get a cumulative signal.
First strategy
This System was created from the Book "How I Tripled My Money In The
Futures Market" by Ulf Jensen, Page 183. This is reverse type of strategies.
The strategy buys at market, if close price is higher than the previous close
during 2 days and the meaning of 9-days Stochastic Slow Oscillator is lower than 50.
The strategy sells at market, if close price is lower than the previous close price
during 2 days and the meaning of 9-days Stochastic Fast Oscillator is higher than 50.
Second strategy
Determining market trends has become a science even though a high number
or people still believe it’s a gambling game. Mathematicians, technicians,
brokers and investors have worked together in developing quite several
indicators to help them better understand and forecast market movements.
The Prime Number Bands indicator was developed by Modulus Financial Engineering
Inc. This indicator is charted by indentifying the highest and lowest prime number
in the neighborhood and plotting the two series as a band.
WARNING:
- For purpose educate only
- This script to change bars colors.

VIX Implied Move Bands for ES/Emini futuresThis script uses the close of the VIX on a daily resolution to provide the 'implied move' for the E-mini SP500 futures. While it can be applied to any equity index, it's crucial to know that the VIX is calculated using SPX options, and may not reflect the implied volatility of other indices. The user can adjust the length of the moving average used to calculate the bands, the window of days used to calculate the implied move, and the multiplier that effects the width of the bands.

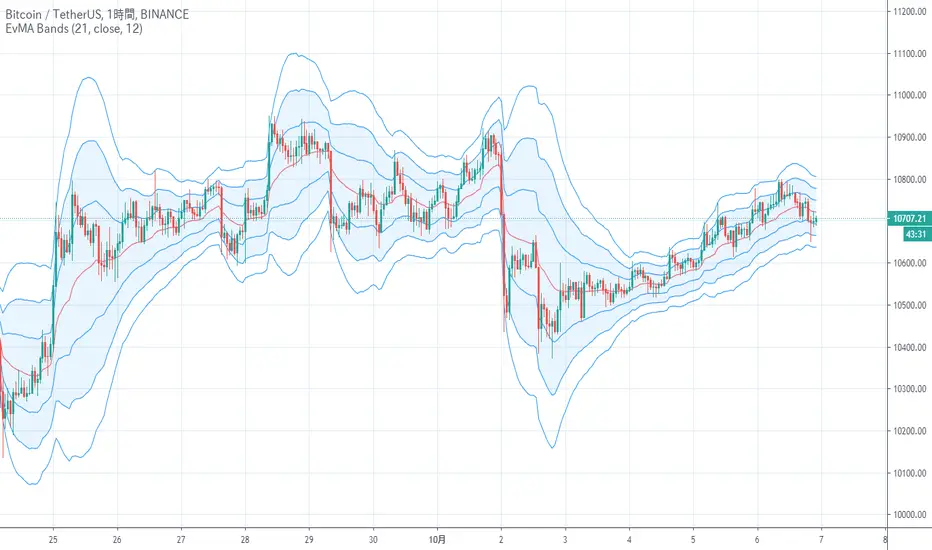
EvMA BandsIt is an index that looks like the final evolution by weighting the Bollinger band with exponential smoothing and volume.
The base Line is my EvMA as volume weighted EMA, so it is quite responsive.
The standard deviation is also exponentially smoothed, and the reaction is too good to handle, so it is further smoothed by EMA.
Charts without volume are not weighted with volume as 1.
It seems that the usage in trading is the same as the Bollinger band
ボリンジャーバンドを指数平滑出来高加重し、最終進化したような指標です
中央線は拙作のEvMAで出来高加重EMAなのでかなり反応が良いです
標準偏差も指数平滑出来高加重して反応が良すぎて扱いにくいのでさらにEMAで平滑化しています
出来高の無いチャートは出来高を1として加重しないようにしています
トレードでの使い方はボリンジャーバンドと同じで良いと思われます