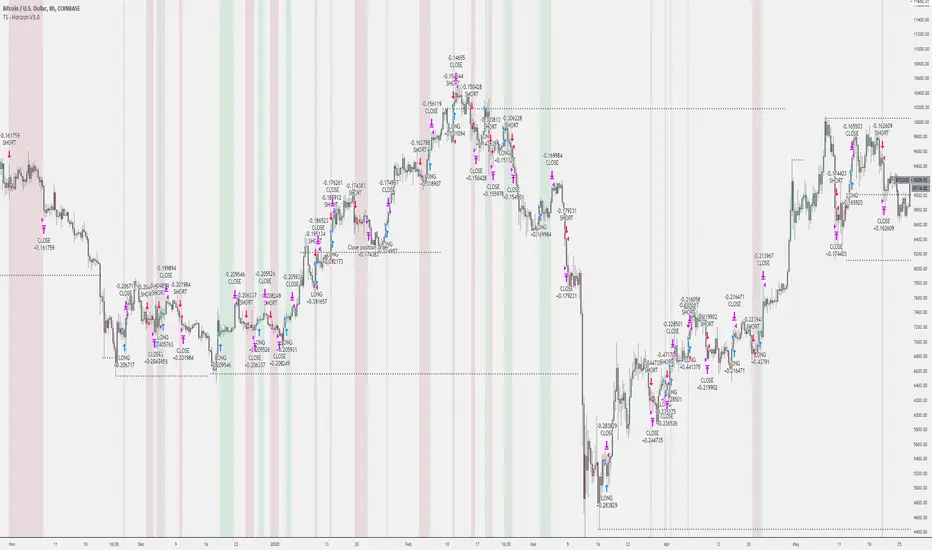
Tradespot Horizon - Strategy & AlertsTradespot - Horizon is a long term trading algorithm that is run at Tradespot to generate consistent performance in all market conditions. Backtests show performance remains consistent in both bull and bear markets dated back to 2015 and has the capabilities to be utilitised in both spot trading or using low leverage (e.g. 3X).
The default settings are built for BTCUSD 8H. Just plug and play, no configuration needed to achieve the exact backtest displayed above.
Features:
Trade following signals generated via our bespoke algorithm
Full customisation to allow a deeper use of the indicator across different assets
Full risk management with take profit and stop loss levels (configurable) built in
Preset for BTCUSD on the 8H timeframes avaliable instantly for your use.
Cornix compatible alerts - with the easiest of configurations you can automate this execution of this strategy.
More features being added all the time, we have great ideas and our only limitation is how fast we can program it.
Can I get a free trial?
Yes! Get in touch for a complimentary 24 hour free trial to the indicator, no strings attached.
Who are you?
Tradespot has been creating scripts for years on TradingView that we use to leverage our social trading and signal group offerings. We currently have over $200K in assets trading with our strategies across over 300 users.
You can learn more about us on our website or DM me directly. Please reach out to me or see the link on our profile.
스크립트에서 "algo"에 대해 찾기
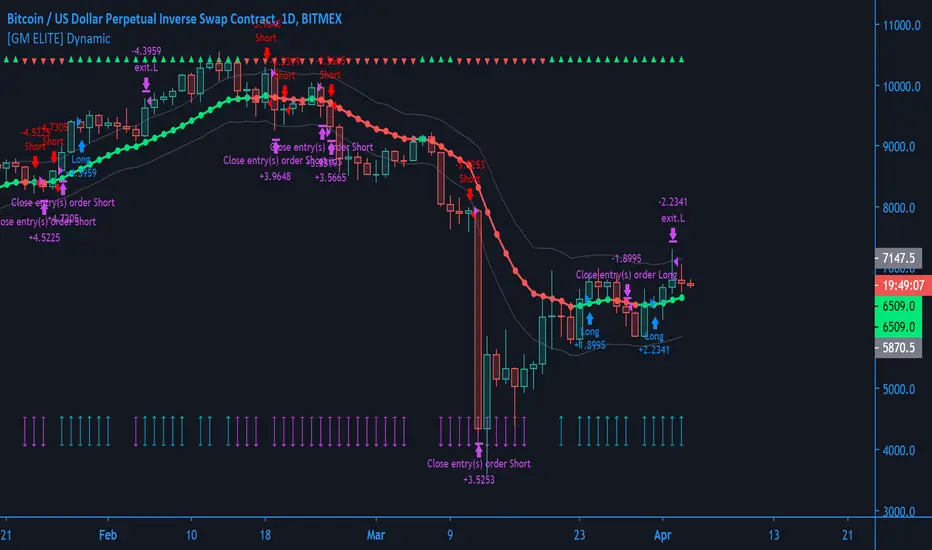
[GM ELITE] Dynamic_Introduction
This is the first of the GM ELITE indicator range. Designed for Algorithmic Traders looking to speed up their process of testing and optimizing their algorithm. This script contains an entire suite of indicators, that work together in unison to find optimal trade entries, based on NNFX rules. There are two versions of this script. One is a strategy and built in back-tester, and the other will update in real time designed for live trading and forward testing.
This script is for live trading/forward testing.
Entries/Exits
The System has 5 indicator slots, and the user can choose one indicator per slot
- Trend Confirmation Indicators to pick when the market has taken off
- Volume and volatility Indicators to determine the strength of the trend or whether the market is ranging.
- Moving Averages for trend bias
- Exit Indicators to signal when to get out!
Money Management
Dynamic allows you to choose your Stop Loss and Take Profit distance based on a multiplier x ATR.
Options to exit the whole trade at TP or at a signal from the exit indicator of your choosing.
Start and End times (Window) to backtest.
Forex - $EVZ
Euro Volatility FX Vix ( aka $EVZ) is built in. You can toggle a filter for low $EVZ or whether or not EVZ is above average. No signals will be given if EVZ is below threshold. EVZ is one of the best indicators of overall forex market volume and volatility .
Customization
Several visual and color customization options. Thousands of possible parameter combinations.
The "bias" or mode of the Confirmation Indicators appears at the top and bottom of the screen as horizontal rows of triangles.
For any two-line Indicator (eg MACD ) if the fast line is above the slow line, the triangles are green, other-wise, they are red.
For any "Level Cross" indicator, when the line is above the level, the triangles are green, otherwise, they are red.
The Arrows at the bottom of the screen determine whether or not there is sufficient volume

[GM ELITE] Dynamic Introduction
This is the first of the GM ELITE indicator range. Designed for Algorithmic Traders looking to speed up their process of testing and optimizing their algorithm. This script contains an entire suite of indicators, that work together in unison to find optimal trade entries, based on NNFX rules. There are two versions of this script. One is a strategy and built in back-tester, and the other will update in real time designed for live trading and forward testing.
Entries/Exits
The System has 5 indicator slots, and the user can choose one indicator per slot
- Trend Confirmation Indicators to pick when the market has taken off
- Volume and volatility Indicators to determine the strength of the trend or whether tha market is ranging.
- Moving Averages for trend bias
- Exit Indicators to signal when to get out!
Money Management
Dynamic allows you to choose your Stop Loss and Take Profit distance based on a multiplier x ATR.
Options to exit the whole trade at TP or at a signal from the exit indicator of your choosing.
Start and End times (Window) to backtest.
Forex - $EVZ
Euro Volatility FX Vix (aka $EVZ) is built in. You can toggle a filter for low $EVZ or whether or not EVZ is above average. No signals will be given if EVZ is below threshold. EVZ is one of the best indicators of overall forex market volume and volatility.
Customization
Several visual and color customization options. Thousands of possible parameter combinations.
The "bias" or mode of the Confirmation Indicators appears at the top and bottom of the screen as horizontal rows of triangles.
For any two-line Indicator (eg MACD ) if the fast line is above the slow line, the triangles are green, other-wise, they are red.
For any "Level Cross" indicator, when the line is above the level, the triangles are green, otherwise, they are red.
The Arrows at the bottom of the screen determine whether or not there is sufficient volume
Out of the Box
The Indicators and parameters out of the box are chosen based on defaults. Please optimize for the market that you trade.My recommendation is to paper trade once you have found a combination of settings with good back-testing results, and have different settings for different markets, as not all markets behave in the same manner.
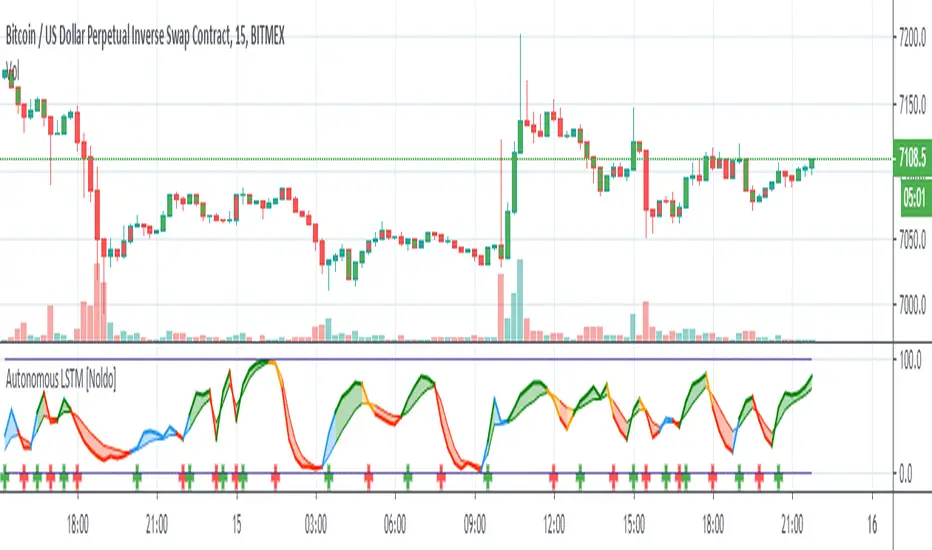
Autonomous LSTM [Noldo] Structure
Feature Layer 1 : Formulation :
The Autonomous LSTM adaptive period equation is a multivariate equation created by averaging a table based on market weights and optimizing it for each time period, by specially Artificial Neural Networks (ANN) training and taking note of the instruments chosen from Foreign exchange instruments, Stock markets , Futures and Commodities , Interest Rates and Yields all over the Global Markets.
Market weights and liquidities were taken into consideration and included in the calculations.
Feature Layer 2: Forecast Algorithm :
When we apply only the first item, we only get the buy and sell signals in reverse.
In other words, since we measure the expectation, the positive signal informs the bear market and the negative scenario informs the bull market.
If we only act according to the expectations market, our system will be very sensitive.
When we associate this with real prices, both our accuracy increases and the reverse market returns to the normal market.
In other words, as in the indicators with standard average, the upward crosses are buy and the downward crosses are sell signal.
Examples:
a -) The normal deep learning script (ANN), which is only created according to expectations:
Unlike standard market, it gives reverse signals.
Original script :
b-) Script with Forecast Algorithm but it only uses valid and standard periods for certain instruments :
Original script :
Feature Layer 3 : Composite of Two Layers : Adaptive Period (Length) Algorithm
This layer is the most important layer.
Outputs the period.
It adjusts itself to market conditions and provides a more agile trading environment under all circumstances.
Display of smart period function and standard period :
Where the market is stagnant, the period increases automatically and reduces unnecessary trade, while in trendy markets the period decreases automatically and allows to see positions first.
The degree of stagnation of the instrument concerned is not calculated solely by volatility.
We may perceive this in relation to several factors, but yes volatility is one of these factors.
When we put the script system under the MACD (Moving Average Convergence Divergence) roof, I did the tests.
Where both averages were positive, they could report accurate harsh trend news, or vice versa.
But I decided to give it up and put it on the Stochastic Money Flow Index .
First of all , Stochastic Money Flow Index function takes the volume into account.
The reason for this is a very important factor, which is naturally contained in the structure of High - Low conditions related codes.
And by using this factor, it could be superfast adaptive in both stagnant and trendy markets.
Feature Layer 4 : High - Low Selection Algorithm
The High-Low Selection Algorithm does not depend on a specific period but scans all periods backwards.(Lookback Function - Lkb )
Outputs the lowest or highest values in the specified new period.
This algorithm was written by me with the concern that if everyone trades according to the same threshold values, it will cause problems and choosing between values of the whole period length will slow down the signals.
This algorithm consists of two functions.
a - Lkb (Lookback Function) :
The lookback function scans back all periods from 0 to Smart Period bars at the same time.
In order to show the effect of the function, it was done between 0 and 84 bars.
However, the scan period of the function is normally at the same time: 0 to adaptive period time.
If the adaptive period includes a fractional day, it can also scan it.
There is no need to be an integer.
All functions are written to make mutable variables appropriate.
And what this function will scan depends on the second feature.
The special selection algorithm is in this function.And the output is given in this function.
b-) High - Low Selection Algorithm
Outputs the lowest or highest values in the specified new period.
This function allows you to select the most advantageous low or high values, even though the adaptive period remains the same.
And the signals are even more accurate.
This is a comparison of the High-Low selection algorithm and the Function: Stochastic Money Flow Index in the standard period.
For the codes of the Stochastic Money Flow Index function:
Speed may not be clear here.
So let's take a look at on chart.
So I would like to show a comparison values of the standard and special selection algorithms on Standard Highest - Lowest Function (All effort goes to RicardoSantos)
Note: This function is the standard function and freed from integer loads.
Blue = Function Highest - Lowest (length = 10 )
Yellow = Smart High-Low Selection Algorithm (length = 10 )
You can better observe the different results in the same period on the chart.
***
4 layers are interdependent.
And when the inter-layer operations are completed, output is given.
*** - Usage of Autonomous LSTM
Plot Rules
Blue Zones = Crossover condition where the average of long and short lines is less than 50.
Orange Zones = Crossunder condition where long and short lines averages more than 50.
Green Zones = Crossover condition where the average of long and short lines is greater than 50.
Red Zones = Crossunder condition where long and short lines averages less than 50.
*** Autonomous LSTM Settings :
It is just the barcolor to be colored according to the crossover and crossunder conditions or not (I / 0) option.
*** Autonomous LSTM Alerts :
As an alert, it only reports crossover and crossunder status as "Long Signal" and "Short Signal" as a warning after the first bar closure.
*** CONCLUSION :
Autonomous LSTM Designed to be used in any time frame.
Does not repaint in any time frame.
Script is independent of constant coefficients.No period adjustment is necessary.
Each layer transfers the information in its own layer to the next layer and the results are reflected in the Stochastic Money Flow Index function built on the resultant.
Regards.
Profitable MAMA & FAMA CrossoverIntroduction
The MESA Adaptive Moving Average (MAMA) was originally presented by John F. Ehlers. By design, it is a special kind of Exponential Moving Average with self-adjusting alpha. Its adaptation is based on the rate change of phase as measured by the Homodyne Discriminator and the alpha parameter is allowed to range between a maximum and minimum value (Fast Limit and Slow Limit).
Key Point: Ehlers suggested the maximum value to be 0.5 and the minimum to be 0.05 .
The variable alpha is computed as the Fast Limit divided by the phase rate of change. If the phase rate of change is large, the variable alpha is bounded at the SlowLimit. Then, this alpha is used to compute MAMA and FAMA (Following Adaptive Moving Average).
Should we rely on Ehlers' suggestions if we want to achieve the best result with MAMA & FAMA crossover system?
Well, he is a good specialist and widely recognized author, I respect him, but the answer is no and you can see results on the chart.
What is our goal?
We want to find the best configuration for MAMA & FAMA Crossover. To achieve that we need to analyze the MAMA's alpha parameter or, more specific, the bounds for this parameter, Fast and Slow Limits.
What is this tool?
This tool is a performance optimizer that uses decision tree-based algorithm under the hood to find the most profitable settings for the MAMA & FAMA Crossover. It analyzes a bunch of different Fast Limits (between 0.01 to 0.8 with step of 0.1 ) and Slow Limits (between 0.01 to 0.6 with step of 0.1 ) and backtests each combination across the entire history of an instrument. If the more profitable parameters were found, the indicator will switch its values to the found ones immediately.
So, instead of manually selecting and testing parameters just apply this indicator to your chart and
relax - the algorithm will find the best parameters for you
Alerts
It has a special alert that notifies when the more profitable settings were detected.
NOTE: It does not change what has already been plotted.
NOTE 2: This is not a strategy, but an algorithmic optimizer.
Reference: www.mesasoftware.com
MAMA & FAMA Crossover can be found here:

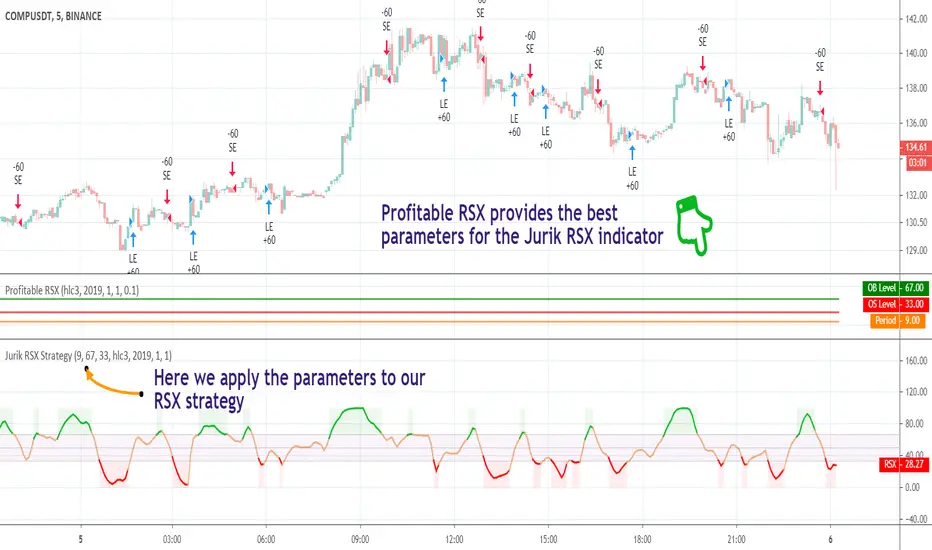
Profitable Jurik RSXIntroduction
As you know the Jurik RSX is a "noise free" smoothed version of RSI (Relative Strength Index), with no added lag.
It was originally developed by Mark Jurik and is used the same way as RSI. To learn more about this indicator see www.jurikres.com
The most basic and common strategy is to use the crossovers between Jurik RSX and its overbought/oversold levels as trade signals:
when RSX crosses above 30, go Long
when RSX crosses below 70, go Short
exit when a crossover occurs in the opposite direction
What is this tool?
This tool is a performance scanner that uses a decision tree-based algorithm under the hood to find the most profitable settings for Jurik RSX. It analyzes the range of periods between 2 to 100 and backtests the Jurik RSX for each period (using the strategy mentioned above) across the entire history of an instrument. If the more profitable parameter was found, the indicator will switch its value to the found one immediately.
So, instead of manually selecting parameters just apply it to your chart and relax - the algorithm will do it for you, everywhere you want.
The algorithm can work in two modes: Basic and Early Switch. The Early Switch algorithm makes some assumptions and activates a set of optimizations to find a better setting DURING the trades, not after they were actually closed.
The difference is illustrated on the screenshot below
But two modes can show identical values depending on timeframe
Additionally you can set up a backtest window through indicator's settings (the optimizers which were published before will get this feature soon).
Alerts
It has a special alert that notifies when a more profitable period was detected.
NOTE: It does not change what has already been plotted.
NOTE 2: This is not a strategy, but an algorithmic optimizer.
Profitable RSI (Relative Strength Index)Introduction
As you know the Relative Strength Index (RSI) was originally developed by J. Welles Wilder and was described in his book "New Concepts in Technical Trading Systems" (1978). It is intended to measure the strength or weakness of an instrument for the specified period.
The most basic strategy is to use the crossovers as trade signals:
when RSI crosses above 30, go Long
when RSI crosses below 70, go Short
Exit when a crossover occurs in the opposite direction
What is this tool?
This tool is a performance scanner that uses a decision tree-based algorithm under the hood to find the most profitable settings for RSI. It analyzes the range of periods between 2 to 100 and backtests the RSI for each period using the strategy mentioned above across the entire history of an instrument. If the more profitable parameter was found, the indicator will switch its value to the found one immediately.
So, instead of manually selecting parameters just apply it to your chart and relax - the algorithm will do it for you.
The algorithm can work in two modes: Basic and Advanced "Early Switch" . The Early Switch algorithm makes some assumptions and activates a set of optimizations to find the better setting DURING the trades, not after they were closed.
The difference is illustrated on the screenshot below:
Additionally you can set up a backtest window through indicator's settings (the optimizers which were published before will get this feature soon).
Alerts
It has a special alert that notifies when a more profitable period was detected.
NOTE: It does not change what has already been plotted.
NOTE 2: This is not a strategy, but an algorithmic optimizer.
Day after day. Night after night.
I've been waiting to program again.
Day after day. Night by to night.
Trading is waiting inside your heart.

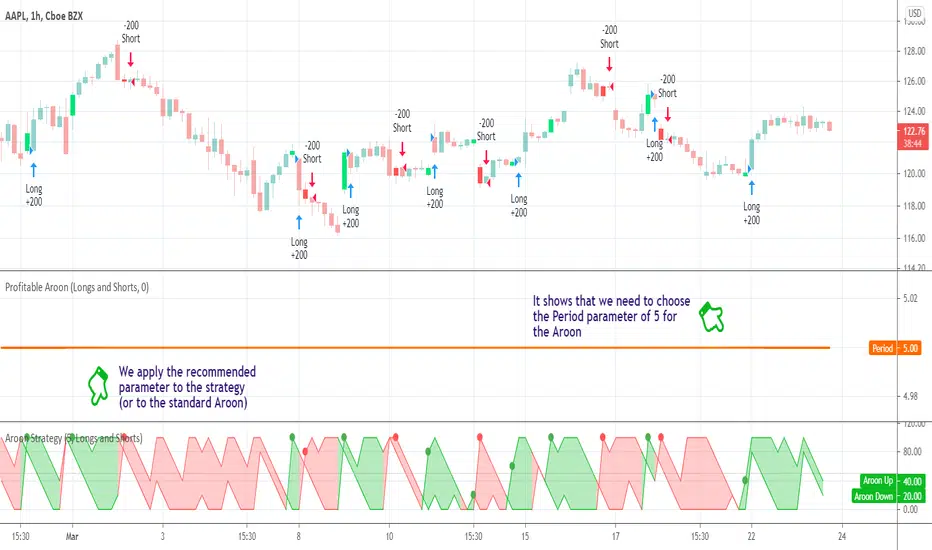
Profitable AroonIntroduction
The Aroon indicator was developed by well-known technical analyst Tushar Chande in 1995 and is used to identify trend changes in the price of an asset, as well as the strength of that trend. The fact that he named the indicator "Aroon" which is Sanskrit for "Dawn’s Early Light" demonstrates his belief in his indicator's trend discovery capabilities.
It is composed of two lines, Aroon Up and Aroon Down .
The most basic strategy is to use the crossovers as trade signals:
when Aroon Up crosses above Aroon Down , go Long
when Aroon Down crosses above Aroon Up , go Short
Exit when a crossover occurs in the opposite direction
What is this tool?
This tool is a performance scanner that uses a decision tree-based algorithm under the hood to find the most profitable period setting for the Aroon. It analyzes the range of periods between 2 to 100 and backtests the Aroon indicator for each period using the strategy mentioned above across the entire history of an instrument. If a more profitable parameter was found, the indicator will switch its value to the found one immediately.
Alerts
It has an alert that notifies when a more profitable period was found.
NOTE : It does not change what has already been plotted.
Good luck and Happy Trading!
Trend Precognition - Mtrl_Scientist (arrow-only)Hey everybody,
Per request, I'm also adding the arrow-version to the updated base algorithm.
However, I advise everyone to also add the indicator version that I published previously.

ICT Macro Tracker - Study Version (Original by toodegrees)This indicator is a modified study version of the ICT Algorithmic Macro Tracker by toodegrees, based on the original open-source script available at The original indicator plots ICT Macro windows on the chart, corresponding to specific time [ periods when the Interbank Price Delivery Algorithm undergoes checks/instructions (aka "macros") for the price engine to reprice to an area of liquidity or inefficiency.
This study version adds functionality to hide bars outside macro periods. When enabled, the indicator draws boxes that cover the full chart height during non-macro periods, obscuring those bars so only macro periods are visible. This helps focus on macro-only price action. The feature is configurable, allowing users to enable or disable it and customize the box color. All original functionality remains intact.

RiskyInvesting Algo v1.0.0 FREEA multi‑layer trend‑following and momentum‑confirmation system designed around dual adaptive baselines, Heikin‑Ashi structure, and smart candle‑strength filtering. This strategy blends volatility‑based trailing logic with macro trend bias tools (EMA + SMMA) to identify clean directional flips and filter out weak signals.
This model uses 5 parameters, while the Pro uses 9 parameters. For more info, follow me on Twitter/X
Disclaimer:
- You must use the Heikin-Ashi candle type for this indicator.
- Please use this in conjunction with your trading system. Labels are not meant to be used as financial advice.
Core features include:
- Heikin‑Ashi Transformation: Smooths price action for more reliable trend identification.
- Two Adaptive Trailing Baselines: ATR‑adjusted equations (Parameter 1 & 2) that flip direction based on baseline breaks.
- Directional Shift Detection: Buy signals on bullish dual‑baseline flip; sell signals on bearish dual‑baseline flip.
- Trend Bias Filtering: Uses EMA vs SMMA relationship to color signals and provide market bias context.
- Candle Strength Filter: Ensures signals only trigger on meaningful momentum candles relative to ATR.
- Clean Visual Display: Auto‑coloring buy/sell labels, baseline plots, and signal triangles.
🟩 = Full Position
🟦 = Half Position
🟥 = Full Position
🟧 = Half Position
Built for traders who want a structured trend‑flip system that avoids noise, highlights strong directional moments, and maintains visual clarity even on volatile intraday charts.

Sigma-X Algo [Main] - SMC & Volume Heatmap
**简介 / Short Description:**
A professional institutional trading system combining Statistical Mean Reversion (Sigma), Smart Money Concepts (SMC), and Volume Analysis. Designed for XAUUSD and BTC M5 scalping.
一套结合了统计学均值回归、SMC机构订单流以及量能热力图的专业交易系统。专为黄金(XAUUSD)和比特币(BTC)的M5短线交易设计。
**详细描述 / Description:**
---
### ** 中文说明**
**Sigma-X Algo** 是一套为高波动市场(如黄金、比特币)量身定制的狙击型交易系统。它不预测行情,而是通过捕捉价格的**“统计学极值”**与**“机构订单痕迹”**,寻找高胜率的反转机会。
#### **核心功能 (Core Features)**
1. **📊 统计学均值回归 (Sigma Extremes):**
* 基于 **TRIMA** 算法计算价格偏离度。
* 当价格触及 **3.0σ** 极值时,图表会出现 **钻石信号**。
* **S+ (彩色钻石):** 顺势极值,胜率加成。
* **Risk (灰色钻石):** 逆势极值,提示风险。
2. **🏛️ 多周期 SMC 订单块 (MTF Order Blocks):**
* **4H OB (绿色/橙色):** 大级别“城墙”,也是核心反转区。
* **1H OB (蓝色/红色):** 短线“战术掩体”,用于日内观察。
* **逻辑:** 采用“穿透即删除”逻辑,只保留未被截取 (Unmitigated) 的有效结构。
3. **🔥 量能热力图 (Volume Heatmap):**
* 通过 K 线染色识别主力行为。
* **亮紫色/亮黄色 K 线:** 代表成交量超过平均值的 **2.0倍**。这是机构入场护盘或出货的关键信号。
4. **🌊 趋势过滤器 (Trend Filter):**
* 内置 **EMA 50/144** 斐波那契均线组,自动判定当前是顺势还是逆势。
#### **实战策略 (How to Trade)**
* **做多狙击 (Long Setup):**
1. 价格回踩 **4H 看涨 OB (绿色框)**。
2. 主图出现 **绿色 S+ 钻石** 信号。
3. **K 线变色 (亮紫)**,确认主力爆量承接。
* **做空狙击 (Short Setup):**
1. 价格反抽 **4H 看跌 OB (橙色框)**。
2. 主图出现 **红色 S+ 钻石** 信号。
3. **K 线变色 (亮黄)**,确认主力出货。
---
### ** English Description**
**Sigma-X Algo** is a sniper-style trading system tailored for high-volatility assets like Gold (XAUUSD) and Bitcoin (BTC). Instead of predicting, it identifies high-probability reversals by combining **Statistical Extremes** with **Institutional Footprints**.
#### **Key Features**
1. **📊 Statistical Mean Reversion (Sigma Extremes):**
* Calculates price deviation based on the **TRIMA** algorithm.
* **Diamond Signals** appear when price hits the **3.0σ** extreme.
* **S+ (Colored Diamond):** Trend-following signals (High Probability).
* **Risk (Gray Diamond):** Counter-trend signals (Caution required).
2. **🏛️ MTF Smart Money Concepts (SMC):**
* **4H Order Blocks (Green/Orange):** The "HTF Wall". Primary reversal zones.
* **1H Order Blocks (Blue/Red):** Intraday tactical zones.
* **Logic:** Uses "Delete on Break" logic to keep the chart clean, showing only unmitigated zones.
3. **🔥 Volume Heatmap:**
* Highlights institutional activity by coloring candles.
* **Bright Purple/Yellow Candles:** Indicate volume is **2.0x** greater than average. This confirms "Stopping Volume" or "Climax" behavior.
4. **🌊 Trend Filter:**
* Built-in **EMA 50/144** Fibonacci ribbon to filter noise and identify the dominant trend.
#### **Trading Strategy**
* **Long Setup:**
1. Price dips into a **4H Bullish OB (Green Box)**.
2. A **Green S+ Diamond** appears.
3. **Highlighter Candle (Purple)** appears, confirming institutional absorption.
* **Short Setup:**
1. Price rallies into a **4H Bearish OB (Orange Box)**.
2. A **Red S+ Diamond** appears.
3. **Highlighter Candle (Yellow)** appears, confirming institutional distribution.
---
**Disclaimer:**
Trading involves high risk. This indicator is a tool for analysis, not financial advice. Always use stop losses.
---
# 2. 副图指标说明书 (Sub Indicator)
**标题 / Title:**
**Sigma-X Algo - Divergence & Momentum**
**简介 / Short Description:**
The companion oscillator for the Sigma-X system. Features absolute momentum (TRIMA), structural trend filtering, and automatic divergence detection.
Sigma-X 系统的配套副图指标。包含绝对动能算法、趋势结构过滤以及自动背离检测功能。
**详细描述 / Description:**
---
### ** 中文说明**
这是 **Sigma-X Algo** 系统的专用副图震荡指标,用于辅助主图进行动能确认和背离识别。
#### **核心功能**
1. **动能柱 (Momentum Histogram):**
* 基于价格与 TRIMA 均线的偏离度绘制。
* **实心柱:** 动能增强。
* **空心/浅色柱:** 动能衰竭(这是进场的重要参考)。
2. **👀 自动背离检测 (Auto Divergence):**
* 自动识别价格与动能之间的 **底背离 (Bullish)** 和 **顶背离 (Bearish)**。
* **绿线:** 底背离,提示潜在上涨。
* **红线:** 顶背离,提示潜在下跌。
3. **🦅 鹰眼预警 (Warning Zones):**
* 当动能突破 **1.8σ** 警戒线时,背景会变色,提示即将进入变盘区。
#### **如何配合主图使用**
当主图出现 **S+ 信号** 时,观察副图:
* 如果副图同时出现 **绿线 (底背离)**,胜率极高。
* 如果副图动能柱颜色变浅 (衰竭),确认反转即将发生。
---
### ** English Description**
This is the companion oscillator for the **Sigma-X Algo** system, designed to confirm momentum and identify divergences.
#### **Key Features**
1. **Momentum Histogram:**
* Calculated based on the deviation between Price and TRIMA.
* **Solid Colors:** Momentum is increasing.
* **Pale Colors:** Momentum is exhausting (A key trigger for entry).
2. **👀 Auto Divergence Detection:**
* Automatically plots **Regular Bullish (Green Line)** and **Regular Bearish (Red Line)** divergences between Price and Oscillator.
3. **🦅 Warning Zones:**
* Background changes color when momentum breaches the **1.8σ** warning threshold, signaling potential volatility.
#### **How to Use with Main Chart**
When a **S+ Signal** appears on the Main Chart:
* Look for a **Green Line (Bullish Divergence)** on this oscillator for high-probability confirmation.
* Wait for the histogram bars to fade (exhaustion) before pulling the trigger.
---

ETH INFINITY TREND [1H]: The Institutional Anti-Crash AlgorithmSTOP TRADING AGAINST THE TREND. AUTOMATE YOUR SUCCESS.
Are you tired of strategies that make big gains one month and give it all back the next? Are you looking for an algorithm capable of beating the market while strictly protecting your capital during Crashes?
Discover ETH Infinity Trend , the H1 Swing Trading strategy designed for consistency, safety, and long-term performance.
This is not a nervous scalping bot eaten alive by fees. It is an intelligent Trend Following system, calibrated to capture major Ethereum directional moves while staying liquid (Cash) when the market becomes dangerous.
🏆 WHY IS THIS STRATEGY UNIQUE?
✅ "Bulletproof" History (2017-2025) Unlike the market, which suffered massive losses in 2018 (-80%) and 2022 (-65%), this algorithm successfully protected capital during EVERY major bearish phase.
✅ Bull Run Outperformance The algorithm doesn't just follow; it accelerates gains during parabolic phases (like 2021 and 2025) by staying in position as long as the bullish structure remains intact.
✅ Zero Stress / Zero Overtrading The strategy is patient. It filters out market "noise" to take only high-probability moves. No more stress from holding open positions during crashes.
⚙️ THE "SMART TREND" ENGINE (Proprietary Logic)
This script uses a combination of 3 algorithmic engines to secure your entries. Exact settings are protected to ensure a competitive advantage for members:
Adaptive Trend Engine: Detects flow direction with a wide safety factor to avoid "scam wicks" and stop hunts typical of crypto exchanges. Institutional Long-Term Filter: We only trade in the direction of big investment funds. If the Macro trend is bearish, the algorithm forces a Cash (USDT) position to preserve capital. Dynamic Momentum Filter: The algorithm stays inactive during flat markets (Ranging) to avoid grinding down capital with fees. It only enters if the movement has genuine impulsive strength.
📊 CERTIFIED PERFORMANCE (Historical Backtests)
The numbers speak for themselves. Here is how the strategy behaves under extreme market conditions:
🟢 Current Profitability (2025 YTD): +91% While the classic market (Buy & Hold) shows about +55%, the algorithm massively outperforms by avoiding intermediate corrections.
🛡️ Crash Resistance (2018 Bear Market): +29% This is the most important statistic. In 2018, Ethereum lost -82% of its value. Most traders were wiped out. This strategy not only protected capital but finished the year in profit.
💎 Zero Negative Years (2017-2025) Over a complete 8-year history, including two major market cycles, the strategy has never closed a year with a loss.
📉 RISK MANAGEMENT
Profit Factor: > 2.0 (For every $1 lost, the strategy earns more than $2). Controlled Drawdown: The strategy cuts losing positions quickly using a dynamic Trailing Stop, keeping equity drawdown far below that of the market. Fees Included: All results include transaction fees (Taker) and slippage estimates.
🤖 READY FOR AUTOMATION
This script is turnkey ready to be connected to bots via Webhooks (3Commas, Alertatron, or Custom Python Bot on Vultr/AWS).
No Repainting: Signals are fixed at candle close. What you see is what executes. Clear Signals: Buy (Long) and Exit alerts are fully configurable. Zero Leverage Needed: The strategy is designed to be profitable on Spot or 1x Futures.
🔒 ACCESS & INVITATION
This script is available via Invite Only to guarantee exclusivity and preserve signal quality.
👉 HOW TO GET ACCESS? Send me a private message here on TradingView to inquire about access conditions.
Disclaimer: Past performance is not indicative of future results. Cryptocurrency trading involves risk. Only invest what you can afford to lose.

Swift Algo X🧠 Swift Algo X - Adaptive Volume-Drift & Optimization System
Swift Algo X is a sophisticated quantitative trading system designed to solve a big failure point in technical analysis: Parameter Inefficiency.
While most indicators rely on static input settings that fail when market volatility shifts, Swift Algo X solves this by combining a Volume-Drift Model with an integrated Brute-Force Optimization Engine.
The system does not just guess the trend or entry signals, it runs 24 parallel historical simulations in the background to mathematically identify the optimal settings for the asset you are currently trading.
🔍 How It Works
The algorithm operates on a "Dual-Core" architecture: The Signal Engine generates possible trade setups, while the Optimization Engine validates and ranks them in real-time.
1. The Signal Engine: Volume-Drift Calculation Unlike standard indicators that rely on lagging price averages, Swift Algo X calculates the underlying "Volume Force".
It applies a Z-Score Normalization to measure how far the current volume flow has drifted from its statistical mean.
This creates a "Fair Value Estimate" derived purely from volume pressure rather than just price action.
Signals are generated when price breaks out of the volatility bands surrounding this estimate.
2. The Macro Anchor To filter out lower-timeframe noise: The system anchors all logic to a dynamic Macro Baseline.
Bullish Setups: Valid only when the Volume Estimate is sustaining above the Macro Baseline.
Bearish Setups: Valid only when the Volume Estimate is sustaining below the Macro Baseline.
3. The Optimization Engine (The Core Innovation) This is the distinguishing feature of Swift Algo X. On every bar update, the script utilizes Pine Script to:
- Simulate 24 different permutation sets of Volatility Factors and Periods.
- Backtest every permutation against historical price action in real-time.
- Rank them by Win Rate and display the most profitable mathematical fit on the dashboard.
⚙ Key Features
🚀 Live Strategy Tester: A built-in dashboard displays the Win Rate for your current settings vs. the calculated "Best Settings."
🧠 Self-Optimizing Logic: The system recommends the exact "Multiplier" and "Period" that have historically yielded the highest probability for the specific ticker.
✅ Volume-Weighted Signals: Entries are based on volume accumulation, offering a distinct advantage over price-only indicators.
🎯 Adaptive Bands: The volatility bands expand and contract based on the Z-Score drift, naturally filtering out chop during low-volume consolidation.
📘 How to Use
1) Apply to Chart: Load Swift Algo X on your preferred timeframe (e.g., 15m, 1H, 4H).
2) Consult the Dashboard: Look at the "Backtesting" table in the top right corner.
Row 1 (Current): Shows how your current inputs are performing.
Row 2 (Backtest): Shows the theoretical performance of the optimal settings found by the engine.
3) Align Parameters: If the "Backtest Setting" shows a significantly higher Win %, adjust your Multiplier and Period inputs to match the dashboard's recommendation.
4) Wait for BUY / SELL Labels to appear. Use these as confirmation or as tools within your own strategy.
5) Always complement signals with independent risk management and your own analysis.
💡 Originality & Concept
Swift Algo X innovates by transforming the chart from a passive display into an active Simulation Environment.
While the underlying concept of Trailing Stops is a familiar tool, Swift Algo X’s originality lies in its Permutation Engine. By leveraging complex array sorting and loop structures, the script performs a Historical Analysis inside the indicator itself.
This effectively turns a standard script into a dynamic "Strategy Analyzer," allowing traders to adapt the Volume-Drift model to the specific volatility profile of any asset class (Crypto, Forex, or Indices) instantly without leaving the chart.
⚠ Disclaimer
Swift Algo X is a quantitative analysis tool designed for educational purposes. The "Best Settings" are derived from historical data and do not guarantee future performance. Traders should always apply independent risk management.

PriceLevels GBGoldbach Price Levels – Identify Algorithmic Key Zones
This open-source indicator is designed to help traders identify potential algorithmic key zones by highlighting price levels ending with specific numbers such as 03, 11, 29, 35, 65, and 71. These levels may act as inflection points or hesitation areas based on observed behavioral patterns in price movement.
What It Does:
📌 Scans and plots horizontal price levels where the price ends with one of the selected number combinations
🎯 Toggle on/off visibility for each number ending
🎨 Customize color and thickness for each level
🏷️ Shows price labels at the end of each line
🌗 Label styles (color/transparency) are adjustable for both dark and light chart themes
🧠 Why Use It:
This tool is ideal for discretionary traders who study market structure through static price anchors. It provides a visual reference for recurring numerical levels that may be used in algorithmic trading models or serve as psychological price zones.
⚠️ Disclaimer:
This script is open-source and intended for educational and analytical purposes only. No trading signals or performance guarantees are provided. Please use your own judgment when applying this tool in a trading context.

Dynamic Zone Risk Manager [Algo Seeker]Introduction
The Algo Seeker: Dynamic Zone Risk Manager excels in both ranging and trending market conditions. It merges two critical trading components: a zone identification system that allows traders to anticipate price movement within structured ranges and a dynamic risk assessment table that optimizes position sizing based on account parameters and zone-specific characteristics, while also calculating trade-specific risk and reward.
For traders struggling with consistent risk management and identifying high-probability zones, particularly in challenging ranging market conditions, this tool provides a structured framework that enhances precision in trading decisions and capital allocation — addressing two of the most common challenges in trading.
🟠 Unique Features & Trading Benefits
Advanced Zone Structuring:
🟢 The indicator adapts to different trading styles through Scalp, Swing, and Investor modes. Scalp mode generates tight, precise zones optimized for intraday price movements and quick trades completed within minutes or hours. Swing mode creates intermediate zones calibrated for positions held for the entire day or a few weeks, providing optimal zone structures for medium-term trading approaches. Investor mode establishes broader zones designed specifically for positions spanning a few weeks to a few months, identifying major support and resistance levels for extended holding periods.
🟢 These zones are particularly useful during ranging markets. They define clear price ranges within which movement may oscillate based on the selected trading horizon. Such clarity helps traders anticipate potential bounce areas and manage trades more effectively, even when the market lacks a clear directional trend.
🟢 The system transforms static price levels into comprehensive trading zones with clearly defined boundaries. The multi-dimensional architecture creates actionable entry, exit, and management levels that remain relevant across different market conditions.
Unique Risk Management:
🟢 A dynamic risk table that calculates position sizing based on the trader's actual account size. When traders select Scalp, Swing, or Investor mode, the table automatically computes the optimal capital allocation specifically for that mode and the current zone.
🟢 The table provides exact dollar amounts for both risk and potential reward based on current price position within the zone. If price is already moving through a zone, the table dynamically updates to show how much of the potential reward remains available.
🟢 This precise risk management system gives traders a clear, quantified understanding of exactly how much capital to allocate per trade, the specific dollar amount at risk, and the remaining profit potential—all updating in real-time as price moves through the zones.
Dynamic Cost Basis Analysis:
🟢 Continuously calculates optimal midpoints within each zone, creating additional precision pivot points that traditional tools can lack. These dynamic reference points enhance trade accuracy in ranging markets while providing essential data points for the integrated risk management calculations.
🟠 The Power of Integration: Zones Meet Risk Management
The true power of the Algo Seeker: Dynamic Zone Risk Manager emerges when these components work together as a unified system. The trader-selected strategy zones and dynamic risk table create a complete trading ecosystem that addresses the three critical elements of successful trading:
1. Precision Entry Points: Zone boundaries provide clear entry thresholds optimized for your selected trading mode (Scalp, Swing, or Investor), eliminating guesswork around optimal trade initiation points.
2. Disciplined Risk Control: The risk table's exact dollar calculations remove emotional decision-making from position sizing and stop placement, creating a consistent risk approach regardless of market volatility.
3. Strategic Exit Management: As price moves through zones, both visual cues and quantified metrics guide intelligent profit-taking decisions, preventing the common mistake of exiting too early or holding too long.
This synchronized framework transforms theoretical analysis into practical execution, giving traders a complete toolset for managing the entire lifecycle of each trade with precision and confidence.
🟠 Additional Algo Benefits
Psychological Trading Edge:
The Algo Seeker: Dynamic Zone Risk Manager addresses the most challenging aspect of trading—emotional decision-making. By transforming complex risk/reward calculations into clear, quantified metrics, the system eliminates decision paralysis and reactionary trading. Traders gain immediate clarity during volatile conditions through the visual integration of precise zones and risk parameters. This psychological framework cultivates discipline and confidence when market noise typically triggers impulsive decisions, allowing for consistent execution even during challenging market environments.
Efficiency and Time Value:
The system delivers exceptional time efficiency by eliminating the need for manual risk calculations, zone identification, and position sizing. What typically requires multiple tools and extensive spreadsheet calculations is seamlessly integrated into a unified interface. Traders receive immediate, actionable insights without the cognitive burden of juggling separate indicators. This allows professionals to focus on strategic decisions rather than technical calculations.
Advanced User Customization:
Unlike one-size-fits-all indicators, the Algo Seeker: Dynamic Zone Risk Manager adapts to individual trading methodologies. The system accommodates personalized account parameters and allocates capital differently based on three distinct trading modes—scalping, swing trading, and investing. This flexibility allows professional traders to implement their unique strategy while maintaining precise risk control across different positions and time horizons. The customizable table positioning and color schemes further enhance workflow integration for diverse trading environments.
🟠 How to Use
Initial Setup
1. Lookback Parameter: The Lookback Period determines which candle data the Dynamic Zone Risk Manager uses to establish trading zones:
🟢Lookback = 1 (Default): Uses the most recent closed candle to calculate zones. This provides stable analysis based on completed price action and is recommended for most trading scenarios.
🟢Lookback = 0: Uses the current, still-forming candle. This offers more immediate responsiveness, but zones may change as the candle develops. For consistent zone analysis, Lookback = 1 typically offers a better foundation.
2. Configure Account Parameters: Input your total trading capital in the settings panel to customize risk calculations specific to your account size.
3. Select Trading Mode: Choose between Scalp, Swing, or Investor modes based on your preferred trade style:
🟢Scalp: For intraday movements (minutes to hours)
🟢Swing: For medium-term positions (days to weeks)
🟢 Investor: For longer-term positions (weeks to months)
4. Account Parameters Setup: The risk management component requires your account size to provide accurate position sizing calculations.
🟢Total Account Size: Enter your total trading capital in the "Total Account Size ($)" input. All risk calculations are based on this value.
🟢Trading Allocation Percentages: The system allows you to divide your capital across three trading modes.
1. Scalp Allocation (%): Percentage of capital reserved for short-term trades
2. Swing Allocation (%): Percentage of capital for medium-term positions
3. Invest Allocation (%): Percentage of capital for longer-term investments
These percentages can be customized to match your personal trading strategy and risk tolerance.
Margin Multiplier: Adjust the margin multiplier value based on your broker's requirements and your preferred leverage.
The system uses these parameters to calculate appropriate position sizes for each trading mode, ensuring your risk exposure remains aligned with your capital management plan.
5.Visual Customization: Adjust color schemes and table positions to optimize for your workspace layout and visual preferences.
🟠 Risk Table Explanation
The dynamic risk tables provide real-time position sizing and risk metrics as price moves through different zones:
1. Zone Column: Displays the current zone where price is located.
2. Zone Size: Shows the total price range of the current zone.
3. Trade Type: Indicates the trading style (Scalp, Swing, or Invest).
4. Shares: Displays the calculated position size (number of shares) based on your account parameters and the current zone.
5. Risk($): Shows the approximate dollar amount at risk if the trade moves against you within the zone.
6. Reward($): Displays the potential dollar return if price moves completely through the zone in your favor.
7. Left: Indicates how much potential movement remains within the current zone based on the latest price.
The table updates dynamically as price moves, giving you real-time risk/reward information. Each trading style is displayed separately, allowing you to compare potential position sizes across different trade modes while maintaining consistent risk management.
🟠 Strategic Execution
Strategy Usage Example
The Algo Seeker: Dynamic Zone Risk Manager provides a complete framework for precise trading decisions. Here's how you might leverage its power:
1. Zone-Based Trading: The indicator identifies key zones and levels that serve as powerful pivot points. These are not arbitrary levels but mathematically derived zones where price is likely to react. Use these zones directly for your trading decisions.
2. Precision Entries: For long positions, enter near the lower boundary of a zone with targets at the upper boundary. For shorts, enter near the upper boundary with targets at the lower boundary. These levels identify potential entry points based on the underlying market structure.
3. Risk Management: The zone, level, or cost basis below your entry (for longs) or above your entry (for shorts) can serve as logical places to set stop losses, helping you define your risk on each trade.
4. Position Sizing Precision: Use the exact share/contract quantities displayed in the risk table. This eliminates guesswork in position sizing and provides both risk and profit calculations that align perfectly with your capital management strategy.
5. Strategic Exits: Take profits at the target zone boundaries identified by the indicator. These levels represent mathematical points where price may encounter resistance or support, providing potential exit opportunities.
6. Advanced Strategy Options:
🟢Consider taking partial profits at cost basis (midpoint) levels
🟢Trade from zone to zone using the defined boundaries
🟢Scale in or out at specific zone transitions
🟢Set trailing stops at subsequent zone boundaries as price progresses
The strength of this indicator lies in its ability to provide all the critical decision points needed for a complete trade - from entry to exit, with precise position sizing - all derived from its sophisticated algorithmic analysis rather than subjective interpretation.
🟠 Alert Configuration
1. Zone Crossovers: Set alerts for when price transitions between key zones.
2. Cost Basis Interactions: Configure notifications for when price approaches optimal entry points.
The Algo Seeker Wizard Ultra Risk represents years of development and refinement in professional trading environments. Its integration of sophisticated zone identification with precise risk management creates a comprehensive framework that transforms theoretical market analysis into actionable trading decisions with quantified risk parameters.

tabbys star [Algo Seeker]Tabbys Star Mission:
Identifying key supply and demand areas for entries, identifying trends for holding positions, and locating potential re-entry or exit points is incredibly useful for traders and investors. This algorithm is designed to simplify these critical processes by providing actionable and intuitive tools directly on the chart.
🟢 Supply & Demand Zones (S&D)
The algorithm identifies key entry points by creating supply and demand blocks that automatically expand across the chart. These blocks remain active until invalidated, helping traders maintain awareness of significant price levels. When a new pivot point is identified, the algorithm generates a new supply or demand block that starts expanding from that pivot. This functionality enables traders to monitor evolving zones while referencing older ones, which might still act as weaker pivot points. These areas are incredibly unique and useful for traders, as they dynamically adapt to price action and provide clear visual cues for decision-making.
🟢 Continuation and Exit Signals
The algorithm also highlights areas for potential re-entries or exits. When the price moves beyond a supply or demand block, arrows are displayed to signal that this area may now be optimal for re-entering a trade or exiting a position.
Separating this logic from supply and demand zones offers significant flexibility for traders. For example, those who wish to hold positions initiated at an order block can confidently wait for these signals before taking profits. Similarly, traders who missed the initial opportunity at an order block can use these signals to evaluate new trade opportunities. This feature is incredibly useful for adapting to evolving market conditions.
🟩 Important Note
Arrow/triangle signals are not definitive indicators of upward or downward movement; they serve as calls to attention. These signals should be analyzed in conjunction with supply and demand zones.
For example, if a signal suggests bullish movement but the price falls below the current supply or demand zone, the signal was merely a call to attention. In such cases, it may indicate the need to set a stop loss or even consider a bearish trade below the zone.
Signals should be viewed as one of several factors to consider and should never be traded on in isolation.
🟢 Trendlines for Additional Confluence
In addition to supply and demand zones, the algorithm generates trendlines to help traders better visualize market trends. These trend lines are drawn from pivot points within the supply and demand blocks, providing an additional layer of confluence. For traders who rely on trendline breaks to make decisions, this feature enhances the overall analysis and adds value to the trading strategy.
🟢 Candle Color Coding
To further enhance clarity, the algorithm color-codes candles based on their position relative to the most recent order block:
Bullish: When the price is above the most recent order block.
Neutral: When the price is within the order block.
Bearish: When the price is below the order block.
This color-coding offers a unique and useful visual representation of the current market sentiment, allowing traders to assess price action at a glance.
Settings Overview
🟢Calculation Strength
This setting allows the user to choose how strict the algorithm should be when calculating data. The Standard option generates more entry and exit signals because the calculations are more lenient.. The Restrictive option uses stricter calculations, resulting in fewer signals for entries and exits.
🟢Use Current Bar:
If checked, the conditions will act on the current bar (real-time updates). If unchecked, the conditions will act after the bar closes. For a non-repainting indicator, leave this unchecked.
🟢Session Type:
Both:
Includes market and after-market hours.
RTH:
Regular trading hours only.
🟢Max Trend Lines:
"1": No trend lines will be shown.
"2" or higher: Displays trend lines based on pivot points.
🟢Bar Color:
Allows selection of candle colors based on the parameters discussed above.
🟢Signal Colors:
As described earlier.
🟢Alerts
For when a signal is created.
Conclusion
This tool is designed to hopefully assist investors and traders by:
Identifying key supply and demand areas for entries.
Highlighting trends for holding positions.
Pinpointing potential re-entry or exit points.

Universal Algo [Coff3eG]Universal Algo By G
Overview:
Universal Algo By G is a comprehensive LONG-ONLY trading strategy specifically designed for medium to long-term use in cryptocurrency markets, particularly Bitcoin. This algorithm can be manually adjusted to fit the volatility of specific coins, ensuring the best possible results. While it does not generate a large number of trades due to the nature of bull and bear market cycles, it has been rigorously backtested and forward-tested to ensure the strategy is not overfitted.
Core Features:
Integrated Systems: Universal Algo is built around five core systems, each contributing unique analytical perspectives to enhance trade signal reliability. These systems are designed to identify clear trend opportunities for significant gains while also employing logic to navigate through ranging markets effectively.
Optional Ranging Market Filter: Helps filter out noise, potentially enhancing signal clarity.
Market State Detection: Identifies four distinct market states:
Trending
Ranging
Danger (Possible top)
Possible Bottom
Global Liquidity Indicator (GLI) Integration: Leverages GLI values to identify positive liquidity trends.
Volatility Bands: Provides insights into market volatility.
Top and Bottom Detection: Shows possible bottoms with green backgrounds and red backgrounds for possible top detection.
The Market State Detection, GLI, Volatility Bands, and Top and Bottom Detection feature all serve as an expectation management feature.
Additional Features:
Optional Metrics Table: Displays strategy metrics and statistics, providing detailed insights into performance.
Customization Options: The script offers a range of user inputs, allowing for customization of the backtesting starting date, the decision to display the strategy equity curve, among other settings. These inputs cater to diverse trading needs and preferences, offering users control over their strategy implementation.
Operational Parameters:
Customizable Inputs: Users can adjust thresholds to match the coin's volatility, enhancing strategy performance.
Transparency and Logic Insight: While specific calculation details and proprietary indicators are integral to maintaining the uniqueness of Universal Algo, the strategy is grounded on well-established financial analysis techniques. These include momentum analysis, volatility assessments, and adaptive thresholding, among others, to formulate its trade signals. Notably, no single indicator is used in isolation; each indicator is combined with another to enhance signal accuracy and robustness. Some of the indicators include customized versions of the TEMA, Supertrend, Augmented Dickey-Fuller (ADF), and Weekly Positive Directional Movement Index (WPDM), all integrated together to create a cohesive and effective trading strategy.
System Operation:
Universal Algo works by taking the average score of the five core systems used for the signals. Three of these systems have been lengthened out to function as longer-term systems, while the remaining two operate at a slightly faster speed. This combination and averaging of systems help to balance the overall strategy, ensuring it maintains the right amount of speed to remain effective for medium to long-term use with minimal noise. The average score is then compared against customizable thresholds. The strategy will go long if the average score is above the threshold and short if it is below the threshold. This averaging mechanism helps to smooth out individual system anomalies and provides a more robust signal for trading decisions.
Originality and Usefulness:
Universal Algo is an original strategy that combines multiple proprietary and customized indicators to deliver robust trading signals. The strategy integrates various advanced indicators and methodologies, including:
System Indicator: Calculates a cumulative score based on recent price movements, aiding in trend detection.
Median For Loop: Utilizes percentile rank calculations of price data to gauge market direction.
Volatility Stop: A modified volatility-based stop-loss indicator that adjusts based on market conditions.
Supertrend: A customized supertrend indicator that uses percentile ranks and ATR for trend detection.
RSI and DEMA: Combines a modified RSI and DEMA for overbought/oversold conditions.
TEMA: Uses 3 different types of MA for trend detection and standard deviation bands for additional confirmation.
Detailed Explanation of Components and Their Interaction:
RSI (Relative Strength Index): Used to identify overbought and oversold conditions. In Universal Algo, RSI is combined with DEMA (Double Exponential Moving Average) to smooth the price data and provide clearer signals.
ATR (Average True Range): Used to measure market volatility. ATR is incorporated into the Volatility Stop and Supertrend indicators to adjust stop-loss levels and trend detection based on current market conditions.
DEMA (Double Exponential Moving Average): Provides a smoother price trend compared to traditional moving averages, reducing lag and making it easier to identify trend changes.
Modified TEMA (Triple Exponential Moving Average): Similar to DEMA but provides even greater smoothing, reducing lag further and enhancing trend detection accuracy.
Volatility Stop: Utilizes ATR to dynamically set stop-loss levels that adapt to changing market volatility. This helps in protecting profits and minimizing losses.
Customized Supertrend: Uses ATR and percentile ranks to determine trend direction and strength. This indicator helps in capturing major trends while filtering out market noise.
Median For Loop: Calculates percentile ranks of price data over a specified period to assess market direction. This helps in identifying potential reversals and trend continuations.
HMA (Hull Moving Average): A fast-acting moving average that reduces lag while maintaining smoothness. It helps in quickly identifying trend changes.
SMA (Simple Moving Average): A traditional moving average that provides baseline trend information. Combined with HMA and other indicators, it forms a comprehensive trend detection system.
Universal Algo offers a sophisticated blend of advanced indicators and proprietary logic that is not available in free or open-source scripts. Here are some reasons why it is worth paying for:
Customization and Flexibility: The strategy provides a high degree of customization, allowing users to adjust various parameters to suit their trading style and market conditions. This flexibility is often not available in free scripts.
Proprietary Indicators: The use of proprietary and customized indicators such as the TEMA, Supertrend, ADF, and WPDM ensures that the strategy is unique and not replicable by free or open-source scripts.
Integrated Systems: The strategy combines multiple systems and indicators to provide a more comprehensive and reliable trading signal. This integration helps to smooth out anomalies and reduces noise, providing clearer trading opportunities.
Rigorous Testing: Universal Algo has undergone extensive backtesting and forward-testing to ensure its robustness and reliability. The results demonstrate its ability to perform well under various market conditions, offering users confidence in its effectiveness.
Detailed Metrics and Analysis: The optional metrics table provides users with detailed insights into the strategy's performance, including metrics like equity, drawdown, Sharpe ratio, and more. This level of detail helps traders make informed decisions.
Value Addition: By providing a strategy that combines advanced indicators, customization options, and thorough testing, Universal Algo adds significant value to traders looking for a reliable and adaptable trading tool.
Realistic Trading Conditions:
Backtesting and Forward-Testing: Rigorous testing ensures performance and reliability, with a focus on prudent risk management. Default properties include an initial capital of $1000, 0 pyramiding, 20 slippage, 0.05% commission, and using 5% of equity for trades.
The strategy is designed and tested with a focus on achieving a balance between risk and reward, striving for robustness and reliability rather than unrealistic profitability promises. Realistic trading conditions are considered, including appropriate account size, commission, slippage, and sustainable risk levels per trade.
Concluding Thoughts:
Universal Algo By G is offered to the TradingView community as a robust tool for enhancing market analysis and trading strategies. It is designed with a commitment to quality, innovation, and adaptability, aiming to provide valuable insights and decision support across various market conditions. Potential users are encouraged to evaluate Universal Algo within the context of their overall trading approach and objectives.

Market Structure AlgoThe "Market Structure Algo" (MS Algo) is a comprehensive tool developed by OmegaTools. This advanced indicator is designed to analyze the market's structure through a combination of pivot highs and lows, creating a nuanced understanding of potential market movements.
Core Functionality:
- Internal and External Market Structure (MS): The MS Algo differentiates between internal and external market structures by analyzing pivot points over different periods. This dual analysis allows for a deeper understanding of short-term and long-term market trends.
- Zone Distance and Visualization: The indicator introduces a novel approach to visualizing potential areas of interest or 'zones' around pivot points, adjustable through the 'Zone Distance' setting. This feature enhances the visual representation of zone created on the chart that can be used as a support and resistance area.
- Dynamic Signal Generation: Utilizing a comprehensive algorithm, the MS Algo identifies potential signals for entering and exiting trades based on the internal market structure. These signals are visually represented on the chart, aiding in decision-making. These signals are based on the acceptance and confirmed breakout or the refusal of the pivot points by the price.
Operational Mechanism:
- The MS Algo calculates pivot highs and lows over specified periods (input by the user) to determine the market's current structure. It then evaluates the market's position relative to these pivot points to assign a market structure score, which can range from bullish to bearish extremes.
- Signals for long and short positions, as well as exits, are generated based on the interaction between the close price and these pivot points.
- Additionally, the indicator plots zones around the moving average, adjusted for the ATR and the specified 'Zone Distance,' providing a visual guide to areas where the market might find support or resistance.
Usage Guidelines:
- To apply the MS Algo to your TradingView charts, adjust the 'Internal MS' and 'External MS' settings to align with your analysis preferences. The 'Zone Distance' input allows for customization of the zone visualization feature.
- The color-coded signals and zone fillings serve as guides to understanding the current market structure and potential areas of interest. These should be interpreted within the context of a broader trading strategy and risk management framework.
Understanding the Indicator's Originality:
The MS Algo stands out due to its unique blend of pivot analysis and zone visualization, providing traders with a detailed view of the market's structure that goes beyond traditional indicators. Its originality lies in the methodological integration of these components to offer a tool that enhances market analysis.
Responsible Use Disclaimer:
The financial markets are unpredictable, and the MS Algo is designed to serve as an analytical tool within a trader's arsenal, not a standalone solution for trading decisions. Traders should use this tool judiciously, alongside comprehensive market analysis and sound risk management practices. It's important to understand that the MS Algo does not guarantee trading success nor does it claim to predict specific price movements. Trading involves risks, including the potential loss of capital.

Heiken Ashi Algo v6The Heiken Ashi Algo Oscillator v6, introduces a refined approach to technical analysis applicable across various markets. Central to this algorithm is the integration of the Relative Strength Index #RSI, a staple indicator renowned for its effectiveness in measuring momentum.
The RSI - Tried and True:
By incorporating the #RSI, traders gain valuable insights into the speed and strength of price movements, aiding in the identification of potential #trend #reversals and #continuations.
Why Heiken Ashi Candles:
Additionally, the utilization of #Heiken Ashi candles within this algorithm offers a smoother representation of price action, reducing noise and enhancing clarity in trend analysis. This feature is particularly advantageous in volatile markets, where traditional candlestick patterns may produce false signals. By employing Heiken #Ashi candles, traders can more accurately identify underlying trends and make informed decisions based on reliable price data.
Combining RSI and Heiken Ashi:
The synergy between the RSI and Heiken Ashi candles in the Heiken Ashi Algo Oscillator v6 provides traders with a comprehensive perspective on both momentum and trend direction. This combination allows for a nuanced analysis of market dynamics, enabling traders to navigate various market conditions with greater confidence.
Heiken Ashi Candle Sizes:
The size of the Heiken Ashi candles serves as a visual indicator of the distance the RSI has moved between closing prices, offering additional insights into momentum shifts.
Not your average Heiken Ashi Candles:
Ive taken the time to do some serious custom coding for these particular Heiken Ashi Candles.
They do NOT color as the normal ones do. There is a setting in the inputs tab of the indicator that allows you to color them according to my secret code where its looking for Breaks of Structure on lower timeframes based on Heiken Ashi Candle calculations.
Turning on this feature gives you a more promising array of candle colors telling you about false or positive breakouts and trends.
Why choose this tool:
CoffeeShopCrypto's Heiken Ashi Algo Oscillator v6 offers a balanced and effective tool for traders across different markets. By leveraging the power of the RSI and Heiken Ashi candles, traders can enhance their decision-making process, identify trading opportunities with greater precision, and ultimately improve their overall trading performance.
------------------------------------------HOW TO USE IT------------------------------------------
Inflow / Outflow (accumulation and distribution) Ribbon
In trading we know liquidity means volume and volume is orders. This ribbon shows you when orders are entering, exiting, filling or flat in the market.
The Liquidity Ribbon is a visual representation of whats happening with accumulation and distribution in the market.
It acts as a dynamic area of support and resistance for the RSI (momentum).
Once the RSI breaks above or below the full area of the ribbon, you have an overturned short term market.
Breaking this area isn't easy because of the one sided thick line known as the PoC line or Point of Control Line.
This line changes between a rising and falling color to tell you what side of the market has the most resistance or support.
Custom HA candles
The common way for HA candles to be colors is green for bullish and red for bearish.
These candles color differently according to market dynamics vs how the current candle closes.
This is helpful to keep you from taking longs or shorts when the momentum just doesn't have the move.
How it all works together: Taking entries and failed breakouts.
In the image below (left to right) you can see the following take place:
Short Entry:
HA Candles push down through the ribbon breaking below its low side (Support Ribbon Broken)
Following this the RSI RANGE is broken to the down side.
This is a good setup for a short breakout
Retrace to false breakout:
After this price retraces and so does momentum.
HA Candles attempt to but fail to break through the top of the ribbon and push back down . This is a false breakout.
Bullish Divergence to Long Entry:
The Heiken Ashi Algo forms a bullish divergence and HA candles push back up into the ribbon. Without a change in candle structure the RSI breaks the top of the ribbon where the control line sits as well as breaking through the top of the RANGE area and
This is a promising setup for a long trade.
Rally Base Rally: (into secondary long trade)
As price is rising, it retraces until HA candles are within the RANGE. No candle closes or has a low below the RSI midline.
HA Candles are forming a consolidation. After consolidation the RSI breaks out the top of the ribbon and the top of the RANGE allowing a secondary long entry.
-----------------------------------------------------------------------------------------
Im not gonna lie. Ive written a lot of tutorials but this one was probably the most exciting to describe.
If you have any questions please do ask below.

YinYang RSIYinYang RSI is a Momentum Oscillator. It is loosely based on the standard RSI but uses our Custom True Value Zone Algorithm. Essentially it is a stronger, more accurate RSI that isn't manipulated by consolidation. YinYang RSI moves slightly slower than the standard RSI but when it does move it is much more accurate.
Why do we deem YinYang RSI to be a more accurate RSI? Well, let's discuss some of the underlying logic behind it. YinYang RSI is derived from the High and Low data from multiple Security Requests, we send that data into a modified Donchian Channel to calculate its Basis. That basis is then taken and averaged between multiple different VWMA calculations to ‘Smooth’ it out before we send it into an RSI calculation and display the final results.
This may sound a little confusing and you may be wondering, why bother doing this? The main reason we created the YinYang RSI is to remove the fact that consolidation causes Regular RSI to go down in index value. In our opinion RSI shouldn’t go down due to consolidation. By removing consolidation from RSI it innately made the RSI more smooth and since it became more smooth there were less times it crossed the RSI Moving Average (MA). In turn, since it crosses the RSI MA less, it means when it does cross the RSI MA, it is a much stronger more accurate signal; but don’t just take our word for it! Let’s get into some examples to show you exactly how it works:
Our RSI is very smooth, because of the way we apply VWMA to it, it keeps it from being a jagged line like the regular RSI is:
Our Indicator features 3 RSI’s in it: YinYangRSI, Regular RSI and YinYang Stoch RSI. The reason there are 3 is not only for the Information Tables (we will talk about this later), but also for the fact that you can overlay them on top of each other.
Here is the same dates but with Regular RSI:
Hopefully you can see how different they are and how smooth ours is, but if not, lets overlay them so you get a better idea:
When the YinYang RSI and Regular RSI are overlaid on top of each other, the Regular RSI’s colors change for easier readability. The Regular RSI turns Pink and the Regular RSI MA turns Orange. As you can see here, they function much differently and it is quite clear that the YinYang RSI holds itself during consolidation and is more smooth.
You may be asking yourself, this is great and all, but how does it help me trade?
Well, now that you understand the difference between YinYang and Regular RSI let's discuss exactly that!
So as you can see in the image above, when the RSI crosses the RSI MA it represents a strong movement in price is likely about to occur. When the RSI is very low (20 or less) and it crosses ABOVE the RSI MA, this represents a BUY/LONG signal. When the RSI is very high (80 or above) and it crosses BELOW the RSI MA, this represents a SELL/SHORT signal.
There are times where it is a good time to buy or sell, but the RSI may not be in the right place. This is rare but it does happen. We marked a location that did exactly that with an Orange circle in the picture above. These things happen, however we don’t recommend you act on them. The main reason is that they are much more risky. Nothing will ever be 100% accurate, but the key is making decisions that are more in your favor than not. When the RSI and RSI MA cross and the RSI is near 50, it's much less accurate, however, not impossible for it to be a good signal.
Now you may be wondering, how come I see 2 SELL or 2 BUY signals before the RSI moves a lot? This is quite normal. Based on the picture above, all of the BUY and SELL signals are accurate, but not all of them have insane price movements. However, they all did feature SOME price movements. Just because a BUY or SELL (RSI and RSI MA crossing) happens, doesn’t mean the RSI is going to move all the way from 80 to 20, sometimes the price only moves a bit and then corrects back. This is completely normal.
The part that is up to you is knowing when to exit these trades. You can use the YinYang RSI to see entry locations for Long/Short, but it can be risky to assume that you can go from a BUY right to a SELL and vice versa.
Don’t fret, there is a reason we have our YinYang Stoch RSI within this indicator and its not just because we felt like it! When you overlay the YinYang RSI and YinYang Stoch RSI on top of each other, you can get a very good idea of when a signal may be over and likely it’s a good time to get out. However, first, just so you understand what our YinYang Stoch RSI does, let's take a quick look at it.
At first glance, the YinYang Stoch RSI can look pretty strange and even overwhelming, this is completely normal. It features drastic movements, but only when there is good reason to! When the blue line (K) crosses the orange line (D) it represents momentum in price. So when the blue line crosses above the orange line it means BUY and when the blue line crosses below the orange line it means SELL.
How it works with the YinYang RSI is simple, lets toggle the two of them on together in the settings:
It may look a little confusing at first, and we don’t necessarily recommend you do it for your entry as it can be a little too much and sometimes confusing, but it can be very helpful for understanding your exit and if the momentum has changed/died down. Here's an example based on our initial BUY/SELL image above:
So since we’re talking about the double SELL signal and how to know if its momentum is ending we’ve zoomed in on this example. Here we can see where the pink circle is, that the YinYang Stoch RSI has gained buy momentum and the sell momentum has likely ended here. This is canceled out however, by the fact that shortly after we see another SELL signal combined with the Stoch RSI crossing under and also showing SELL momentum. The blue Vertical lines are to show visually where the stoch crossed over/under as they can be a little hard to see visually. Also, based on this example, you can see where the orange circle is that was clearly a very good buy location and also has the stoch crossover in that location too. So even though the RSI isn’t very low, there is still a decent amount of bullish momentum in that location. Is this enough for you to make a purchase on? In our opinion, it’s still a little too risky, but maybe it fits your trading style, or maybe you decide its a good time to Dollar Cost Average / purchase just a small amount.
Now, you may be wondering, as we mentioned it early, what are those Information Tables that have been sitting on the right of every example?
These Information Tables are there to display very important Time Frame data for you. Not only can you see 6 Different Time Frames, which you can customize within your Settings. You also get to see the level of RSI and RSI MA for YinYang, Regular and YinYang Stoch RSI. Being able to see this data on multiple different Time Frames without having to change the Time Frame you are on can be very helpful, especially if you’re trading on a lower Time Frame like 15 minutes. The color of the box is based on if the RSI has crossed the MA or not. When the box is Green, the RSI is greater than the MA (Bullish). When the box is Red, the RSI is less than the MA (Bearish).
This concludes our Tutorial on how to use YinYang RSI, below you will see all of our current Settings, what they all mean and how you can customize them.
Settings:
1. Show Signals:
Signals are when the RSI crosses the RSI MA (for any RSI TYPE active). When these crosses happen, it will make a plot on the chart that represents Buy and Sell Signals. These signals have alerts that correspond with them, but you will manually need to set up these alerts yourself through the indicator. Please refer to TradingView for how to set up alerts.
2. RSI Type:
We have 3 types of RSI’s within this Indicator:
YinYang RSI
Regular RSI
YinYang Stoch RSI
These RSI’s can be used individually or overlaid on top of each other for easier comparison. It can be useful to go back and forth between indicators or have them overlaid to get a better understanding of what's going on.
2.1. YinYang RSI:
Our YinYang RSI is our custom RSI that is based on our True Value Zone Algorithm. It is the main purpose of this Indicator but can be used in conjunction with Regular RSI and YinYang Stoch RSI. YinYang RSI is a much more smooth, slow moving form of RSI that doesn’t go down from consolidation and therefore makes the RSI and RSI MA crosses much more accurate.
2.2. Regular RSI:
This is a regular RSI that is within our indicator so you can make comparisons and also overlay on top of our YinYang RSI and/or YinYang Stoch.
2.3. YinYang Stoch RSI:
This is a Stoch RSI that is calculated with our YinYang RSI’s values to create a very unique Stoch RSI. Our YinYang Stoch RSI moves very drastically and quickly when there is true momentum swings but it never really hovers in the middle. It makes its way from 0-100 and 100-0 within 2-3 candles usually and if it makes it all the way, you know there is momentum backing this price movement.
3. Information Tables:
3.1. Show Information Tables:
Our Information tables display 6 different Time Frame resolutions to give you the data of YinYang RSI/MA, Regular RSI/MA and Stoch RSI/MA over multiple different Time Frames so you don’t constantly have to keep changing yours and can focus on the trade at hand.
You can choose to display:
‘All’,
‘None’,
‘YinYang RSI’,
‘Regular RSI’,
‘YinYang Stoch RSI’
and/or any combination of the three so you can see all the data you want to your liking.
3.2. Display Tables Direction:
Since there are 6 different Time Frames shown, and you have the ability to display all 3 RSI and MA values, this table can get pretty big. If you have a large monitor and not too many indicators active it's no big deal and a vertical display is likely what you’ll want. However, if you have a smaller monitor or many Indicators active, it will scrunch this Indicator and make it difficult to see all of your Time Frames in the tables. For this reason, we have the option to display them ‘Horizontally’.
3.3. Res1 / Res2/ Res3 / Res4 / Res5 / Res6:
These represent the different resolutions (Time Frames) being used in your information tables and can be modified to display whatever resolution works best for your trading style. By default they are:
Res1: Current Timeframe
Res2: 15 Minute
Res3: 1 Hour
Res4: 4 Hour
Res5: 1 Day
Res6: 1 Week
Backup Res (not changeable): 5 Minute (this is only used if your Current Timeframe in Res1 is a duplicate of one of the other resolutions)
Alerts are available and customizable within the Indicator. You can set up an alert for any of the RSI crossing Signals.
If you have any Questions or Concerns, don’t hesitate to contact us.
HAPPY TRADING!

Risk Reward Calculator [lovealgotrading]
OVERVIEW:
This Risk Reward Calculator strategy can help you maximize your RR value with help of algorithmic trading.
INDICATOR:
I wanted to setup my trades more easier with this indicator, I didn't want to calculate everytime before orders, with help this indicator we can calculate R:R value, avarage price, stoploss price, take-profit price, order prices, all position cost and more ...
Our strategy is a risk revard calculation indicator that is made easy to use by using visualized lines and panels, and also has algorithmic trading support.
With the help of this indicator, we can quickly and easily calculate our risk reward values and enter the positions.
If we want to ensure that our balance grows regularly while trading in the stock market, we need to manage the risks and rewards otherwise we may fall below our initial balance at the end of the day, even if we seem to be winning.
What is the Risk-Reward value ?
This value is a value that shows how many times the amount of risk we take when entering the position is successful, we will earn.
- For example, you risked $100 while entering the trade, so if your trade stops, you will lose 100 $.
Your Risk-Reward(RR) value is 2 means that if your position is successful, you will have 200 $ in your pocket.
A trader's success is determined by the amount of R he earns monthly or yearly, not how much money he makes.
What is different in this indicator ?
I want to say thank you to © EvoCrypto. His Calculator (weighted) – evo indicator helped me when I was developed my indicator.
I want to explain what I have improved:
1-In this strategy, we can determine the time period in which we want to open our positions.
2-We can open a maximum of 4 positions in the same direction and close our positions at a single level. StopLoss or TakeProfit
3-This indicator, which works in the form of a strategy, shows where our positions have been opened or closed. With the help of this, it helps us to determine our strategy in our future positions more accurately.
4-The most important improvement is that we do not miss our positions with the help of alarms (WEB HOOK). if we want, we receive by quickly connecting all these positions to our robot, the software can enter and exit the position while we are busy.
IMPLEMENTATION DETAILS – SETTINGS:
1 - We can set the start and end dates of the positions we will take.
2- We can set our take profit, stoploss levels.
3- If your trade is stopped, we can determine the amount of the trade that we will lose.
4- We can adjust our entry levels to positions and our position sizes at entry levels.
(Sum of positions weight must be 100%)
5- We can receive our positions even if we are busy with the help of algorithmic trading. For this, we must paste our Jshon codes into the fields specified in the settings panel.
6- Finally, we can change the settings we want and don't want to have in our visual elements.
Let's make a LONG side example together
We have determined our positions to enter stoploss, take profit and long positions. We did not forget to set the start time of our strategy
Our strategy appear on the graph as follows.
Our strategy has calculated the total position size, our R-R value, the distance of the current price to the stop and take profit levels, in short, a lot of things we could look visually.
Notes:
If you're going to connect this bot to an automatic Long or Short direction,
Don’t forget! you need to Webhook URL,
Don’t miss paste this code to your message window {{strategy.order.alert_message}}
ALSO:
If you have any ideas what to add to my work to add more sources or make calculations cooler, feel free to write me.

Cloud X MesoHello there fellow Traders!
Thanks for stopping by, so today I will be covering everything you need to to know about this TradingView strategy.
Below I will discuss everything you need to know about this strategy so you can get a full grasp of what the strategy is, the features, what it does, how it works, the benefits of how this strategy can help you, and the results.
What is Cloud X Meso?
-Cloud X Meso is a strategy that consists of 7 indicators to all line up for total confluence to take a buy or sell once all 6 indicators conditions are met. This strategy does not repaint and doesn't require any technical analysis to be used. The strategy can be used on any timeframe, and any instrument.
-I have optimized many different variations for different types of trading instruments of this strategy ready to be used. The difference of this strategy is that these variations do not need any reoptimization to keep up with recent market conditions since there are hardly any inputs used, which prevents common overfitting problems. The main goal was for this strategy to be automated, as well as plug and play or you can officially consider this as set and forever forget.
What does this strategy do?
-The main goal for this strategy is to catch long or short term trends by waiting for all 7 indicators to line up as well as using customized trading times to trade certain sessions where there is high amounts of volume in the market. This strategy doesn't always need to have a clear trending market, since it can also catch short term trends in choppy markets as well. Overall, the strategy tell you when it buys, sells, and exits after all conditions are met.
How does the strategy work?
-The way that this strategy works is when all of the indicators confluences are met. Next, a buy or sell label will print and the candles colors will color blue or red to show that the trade is in the buy or sell position followed along with a magenta colored line which is the trailing stop to follow the trade until the trade exits from the trailing stop being hit or if the strategies exit condition is met.
-The strategy does have a set Take Profit target since it relies on the trailing stop to end the trade. This is beneficial so you can catch any size of a trend move when the strategy is in high volume market sessions. You catch these trends by customizing the settings to toggle on or off certain indicators, functions, configuring a customized trading time, and toggling on or off certain trading days to make a specific approach for fine tuning a pair to trade in a certain time window with high amounts of volume to catch trending moves whether it be a long or short term trend.
Below I will explain each functionality of the strategy for you to better understand the different ways you can adjust the settings of this strategy.
Backtest Settings:
-You can use these settings to determine a start / end date of what results you would like to see in the strategy tester.
-You can determine the $ amount you would like to see on strategy testers results to be in terms of net profit and max drawdown.
-You can choose whether you want the strategy to take buys only, sells only, or buys and sells.
Automation:
-Compatible with Pine Connectors to fully automate this strategy for MT4/5
-It uses a % based risk when placing trades so you won't have to calculate a proper lot size or dollar amount.
-You can also put the symbol of what that strategy will be trading on so you know what pair its trading.
Custom Trading Times:
-When you customize a trading time for the strategy to trade in, the background will turn blue for that specific time window, and you can use the "Session Exit" function to have trades close once the time window ends when toggled on, or you can have the existing trades close on their own when "Session Exit" is toggled off.
Dynamic Trailing:
-The algorithm uses a volatility based indicator to determine proper stop loss placement depending on how volatile the market is. This will prevent you from guesstimating if your stop loss is too big or too small.
-When Dynamic trailing is off, then the strategy will use a Risk Reward based stop loss to trail everytime the trades hits a new Risk Reward target.
-You can also toggle on or off for the stop loss to go to break even once the trade hits a 1:1 Risk Reward.
Directional Bias Settings:
-This indicator is the main directional bias that uses a multi timeframe function to determine the directional bias, you can also use the Exponential Moving Average as a form of directional bias instead, or you can use both of them to work together to find the directional bias. You can also toggle each one on or off
Entry / Exit Settings:
-This indicator also uses a multi timeframe function but it determines the entry and exit for a trade when all confluences are met. You can also toggle the entry and exit functions on or off.
1 Candle Rule:
-This feature is inspired by No Nonsense Forex (NNFX) the main function of this is if your entry doesn't meet all the entry conditions, then the strategy will wait 1 more candle to meet all the entry conditions to take a trade.
No Trade Zone:
-This feature will uses a Volume based indicator to filter out low volume markets. The candles will turn grey to indicate the algorithm not to take trades, and you can also customize the sensitivity of how strong this indicator will filter out the low volume in the markets.
Indicator functions
Each indicator plays a certain role and also meets certain conditions when a buy or sell trade is placed. I will reveal 3 out of 7 of the indicators used to preserve the uniqueness of this strategy but overall, the logic of this strategies main goal is to ride long or short terms trends while getting dynamic Risk Reward trades.
-The first indicator that the strategy uses an Exponential Moving Average that is customizable, and is used as a form of a filter for either a long or short term directional bias to filter out false signals to help the algorithm trade with the trend.
-The second indicator that the strategy uses is an Oscillator which is the Wavetrend and this indicators functionality for the algorithm is used for the its buy and sell signals to line up with all the other indicators for confluence. This indicator can also be toggled on or off for you own preference
-The third indicator used is the Volume indicator, and this is used to give the other indicators the green light to enter a trade if there are high amounts of volume in the market.
What are the benefits of using this algorithm?
Stress Free Trading:
-Once automated, you will no longer need to stare at the charts all day, as well as trying to execute the trades on time or worried that you missed a setup. Or you can choose to take trades manually when a buy or sell signal comes up
Stress Free Risk Management:
-All you have to do is provide a risk % and the algorithm will do the rest of the work calculating the stop loss, exiting trades, etc. No more needing to find the right lot size, or dollar amount, all in all the strategy will manage the trades for you.
Psychology:
-when you choose to have a systematic trading approach, it eliminates a lot bad habits from human nature
What are the results like?
-I have multiple different variations of results of this strategy, but I will share one of the results.
Here is a screenshot below of what this strategy can do from just one of the variations.
The backtest below was done with another variation on simulating a 100k account risking 0.50% per trade.
Thank you for taking the time to read through this whole guide, and I hope this helped you better understand the strategy.
