FVG + Bank Level Targeting w/ Alert TriggerDescription:
FVG + Bank Level Targeting w/ Alert Trigger is an intraday trading tool that combines Fair Value Gap (FVG) detection with dynamic institutional targeting using prior-day, weekly, and monthly high/low "Bank Levels." When a Fair Value Gap is detected, the script projects a logical target using the closest bank level in price's direction, and visually extends that level on your chart.
This tool is designed to help traders anticipate where price is most likely to move after an FVG appears — and alert them when price breaks through key target zones.
How It Works:
* Bank Level Calculation:
The indicator calculates Daily, Weekly, and Monthly high and low levels from the previous bar of each respective timeframe.
These are optionally plotted on the chart with a slight tick offset to avoid overlap with price.
* FVG Detection:
Bullish FVGs are defined by a gap between the low of the current candle and the high two candles prior, with a confirming middle candle.
Bearish FVGs follow the reverse pattern.
Once detected, the script finds the nearest unbroken institutional level (Bank Level) in the direction of the FVG and anchors a target line at that price level.
* Target Line Projection:
The script draws a persistent horizontal line (not just a plotted value) at the selected bank level.
These lines automatically extend a set number of bars into the future for clarity and trade planning.
* Breakout Detection:
When price crosses above a Bull Target or below a Bear Target, the script triggers a breakout condition.
These breakouts are useful for trade continuation or reversal setups.
* Alerts:
Built-in alert conditions notify you in real time when price crosses above or below a target.
These can be used to set TradingView alerts for your preferred Futures symbols or intraday pairs.
Parameters:
Tick Offset Multiplier: Adds distance between price and plotted levels.
Show Daily/Weekly/Monthly Levels: Toggle for each institutional level group.
FVG Extend Right (bars): Controls how far the target lines extend into the future.
Color Controls: Customize colors for FVG fill and target lines.
Use Case:
This indicator is designed for traders who want to:
Trade continuation or reversal moves around institutional price zones
Integrate Fair Value Gap concepts with more logical, historically anchored price targets
Trigger alerts when market structure evolves around key levels
It is especially useful for intraday Futures traders on the 15-minute chart or lower, but adapts well to any instrument with strong reactionary behavior at prior session highs/lows.
스크립트에서 "alert"에 대해 찾기

Close alertingThis script generates alerts when the current candle CLOSES ABOVE the previous candle's HIGH, or CLOSES BELOW the previous candle's LOW.
✅ Works on ANY timeframe you are viewing (1m, 5m, 15m, 1h, 4h, etc.)
✅ Alerts can be created:
- "Close Above Previous High"
- "Close Below Previous Low"
The script is lightweight and works purely on current chart timeframe. No need to adjust or configure — just add to chart and set Alerts.
Enjoy and safe trading! 🚀

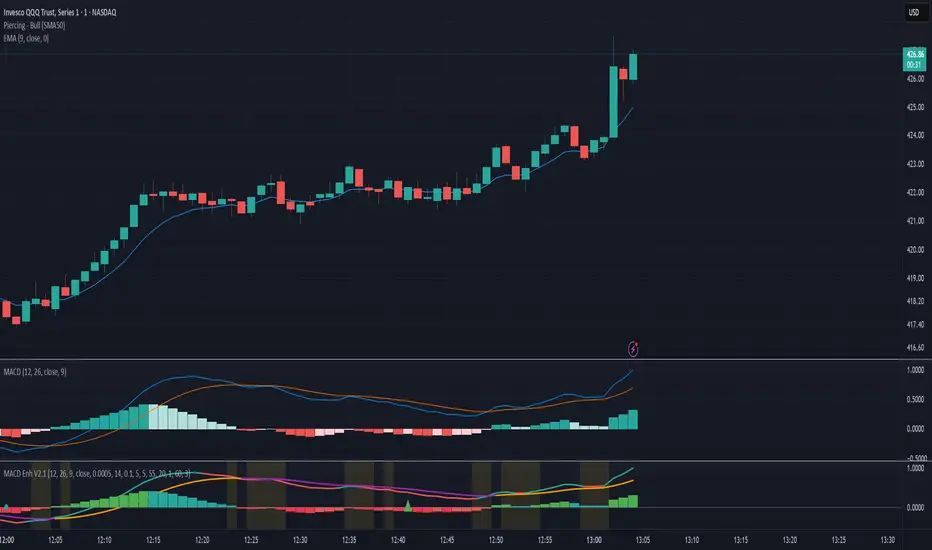
MACD Crossover + AlertMACD Proximity & Crossover Alert Script
This script is designed to help traders stay ahead of MACD crossovers by providing:
Early alerts when the MACD and Signal lines are getting close (within a customizable threshold)
Instant alerts when a bullish or bearish crossover occurs
Whether you're swing trading or scalping, this tool gives you advanced notice to prepare — and a confirmation signal to act on. It works on any timeframe and helps avoid late entries by alerting you when momentum is shifting.
Features:
Customizable MACD settings (fast, slow, signal length)
Adjustable "proximity" threshold
Visual background highlight when lines are close
Built-in alert conditions for:
MACD crossing above Signal (bullish)
MACD crossing below Signal (bearish)
MACD and Signal getting close (early warning)
Perfect for traders who want a heads-up before momentum shifts — not just a reaction afterward.
Price Alert Indicator with TableIndicator Description: Price Alert Indicator with Table
The Custom Price Alert Indicator with Table is a TradingView script designed to help traders monitor and react to significant price levels during the Asian and London trading sessions. This indicator provides visual alerts and displays relevant session data in a user-friendly table format.
Key Features:
User-Defined Session Times:
Users can specify the start and end hours for both the Asian (default: 8 AM to 2 PM) and London (default: 2 PM to 8 PM) trading sessions in their local time zone.
This flexibility allows traders from different regions to customize the indicator according to their trading hours.
Real-Time Highs and Lows:
The indicator calculates and tracks the high and low prices for the Asian and London sessions in real-time.
It continuously updates these values as new price data comes in.
Touch Notification Logic:
Alerts are triggered when the price touches the session high or low points.
Notifications are designed to avoid repetition; if the London session touches the Asian high or low, subsequent touches are not alerted until the next trading day.
Interactive Table Display:
A table is presented in the bottom right corner of the chart, showing:
The Asian low and high prices
The London low and high prices
Whether each price level has been touched.
Touched levels are visually highlighted in green, making it easy for traders to identify relevant price actions.
Daily Reset of Notifications:
The notification statuses are reset at the end of the London session each day, preparing for the next day’s trading activity.
Use Cases:
Traders can utilize this indicator to stay informed about pivotal price levels during important trading sessions, aiding in decision-making and strategy development.
The clear visual representation of price levels and touch statuses helps traders quickly assess market conditions.
This indicator is particularly beneficial for day traders and those who focus on price movements around key high and low points during the trading day.

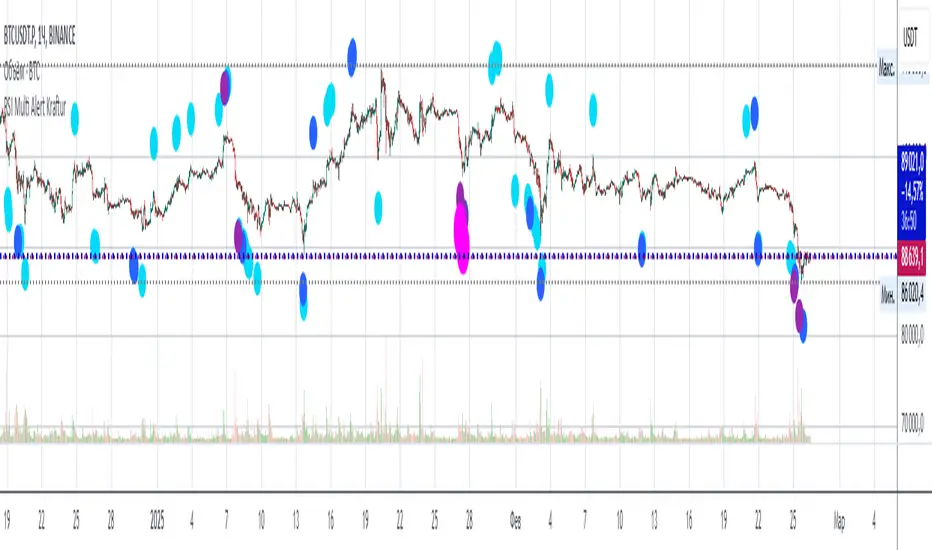
RSI Multi Alert KrafturRSI Multi Alert Kraftur
Description
The "RSI Multi-Level Signals" indicator is designed to help traders identify potential buy and sell opportunities based on RSI (Relative Strength Index) crossings of multiple customizable levels. Unlike traditional RSI indicators that focus on single overbought/oversold thresholds (e.g., 70/30), this script stands out by offering four distinct buy and sell levels for enhanced flexibility and precision. It plots signals directly on the price chart and provides real-time alerts when RSI crosses these levels, making it a powerful tool for spotting entry and exit points.
Key Features
Multi-Level RSI: Configurable buy levels (e.g., 30, 25, 20, 15) and sell levels (e.g., 70, 75, 80, 85) to capture varying degrees of overbought and oversold conditions.
Visual Signals: Buy signals are marked with circles below the bars, and sell signals above the bars, each color-coded for easy identification.
Real-Time Alerts: Generates alerts once per bar when RSI crosses a level, with a filter to prevent duplicate signals during oscillations.
Customizable: Adjustable RSI length, timeframe, and level colors to suit different trading strategies.
Recommended Usage
This indicator is best used as a scanning tool for finding entry points across multiple assets. Set up alerts for your entire watchlist of coins or stocks to detect when RSI crosses the configured levels in real time. It’s particularly effective in volatile markets or for traders employing multi-timeframe analysis. Combine it with other indicators (e.g., support/resistance or trend filters) to confirm signals and improve accuracy.
How to Use
Apply the indicator to your chart.
Customize the RSI length, timeframe, and signal levels to match your trading style.
Set up alerts for the indicator and apply them to your watchlist of assets.
Monitor the chart for buy (green) and sell (red) signals, or rely on alert notifications.
Perfect for scalpers, swing traders, or anyone looking to automate signal detection across a portfolio!
RSI Alerts – Live & ConfirmedThe RSI Alerts – Live & Confirmed indicator enhances the traditional Relative Strength Index (RSI) by providing real-time alerts and confirmed breakout signals when RSI reaches key levels. It also features a dynamic RSI line color change for better visualization.
Key Features:
✅ Live & Confirmed Alerts:
Live Alert Mode: Triggers when RSI touches overbought (70) or oversold (30).
Confirmed Alert Mode: Triggers only when RSI closes above/below these levels, reducing false signals.
✅ Dynamic RSI Line Coloring:
Above 70: RSI turns green, indicating an overbought condition.
Below 30: RSI turns red, indicating an oversold condition.
Between 30 and 70: RSI remains blue, its normal color, ensuring no color leaks into invalid zones.
✅ Customizable RSI Settings:
Adjustable RSI length, overbought/oversold levels, and alert preferences.
Mid-Level (50) line for trend bias reference.
This indicator is perfect for traders who rely on RSI signals and want clear visual cues and real-time alerts for improved decision-making.

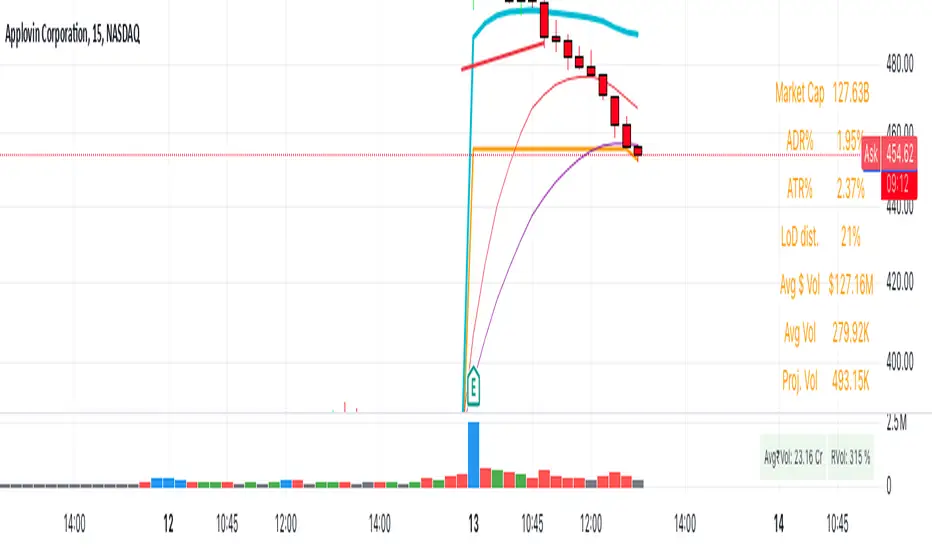
New Daily Low with Offset Alert FeatureThis indicator plots the current day’s low as a horizontal line on your chart and provides an optional offset line above it. It’s designed for traders who want to monitor when price is near or breaking below the daily low. You can set alerts based on the built-in alert conditions to be notified whenever the market approaches or crosses below these key levels.
How to Use With Alerts:
1. Add the indicator to your chart and choose a timeframe (e.g., 15 minutes).
2. In the script inputs, enable or adjust the daily low line and any offset percentage if desired.
3. Open the “Alerts” menu in TradingView and select the corresponding alert condition:
• Cross Below Daily Low to detect when price dips below the day’s low.
• Cross Below Daily Low + Offset if you prefer a small cushion above the actual low.
4. Configure the alert’s frequency and notifications to stay updated on potential breakdowns.
This setup helps you catch new lows or near-breakdowns quickly, making it useful for both intraday traders and swing traders watching key support levels.
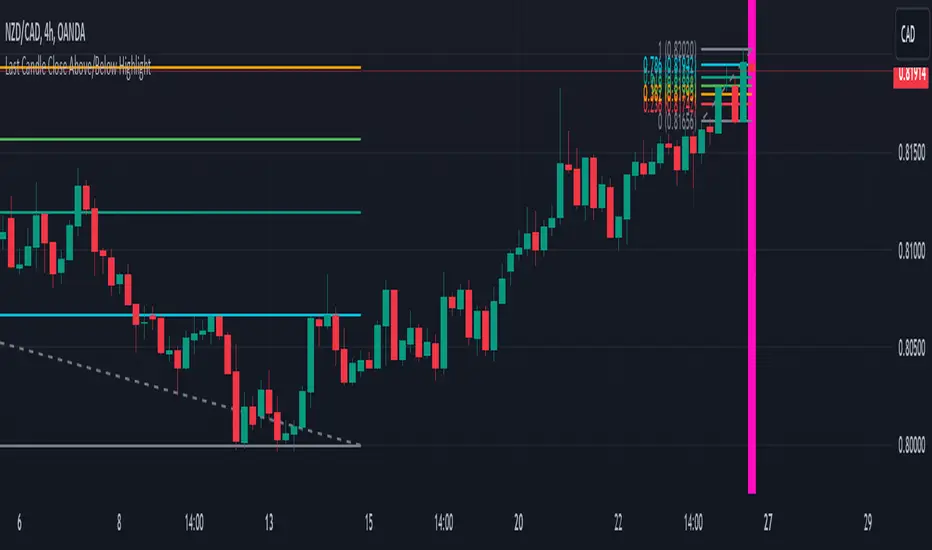
Last Candle Close Above/Below AlertHow it works:
The script calculates whether the close of each candle is above or below the close of the previous candle, same as the initial code.
isLastBar is checked and the last candle to be created is the only one that will receive the condition from this variable.
If a highlight is needed it will use this criteria and apply the correct color for the last candle only, and any other candle will not be colored.
If alerts are enabled they will only work for the last bar too.
How to Use:
Add this script to your TradingView chart.
Use the inputs to set the desired timeframe to analyze, whether you want an alert for candles closing above or closing below and the background colors.
The last candle will highlight yellow when the close is higher or lower than the previous candle.
Alerts will be triggered on the last candle if you enable the alert conditions.
Key Features:
Timeframe Selection: You can choose a different timeframe in the settings.
Candle Highlight: Candles that close above or below the previous candle are highlighted in yellow.
Alerts: Alerts are configurable to trigger for "Close Above" or "Close Below" conditions, based on your selection in the settings.
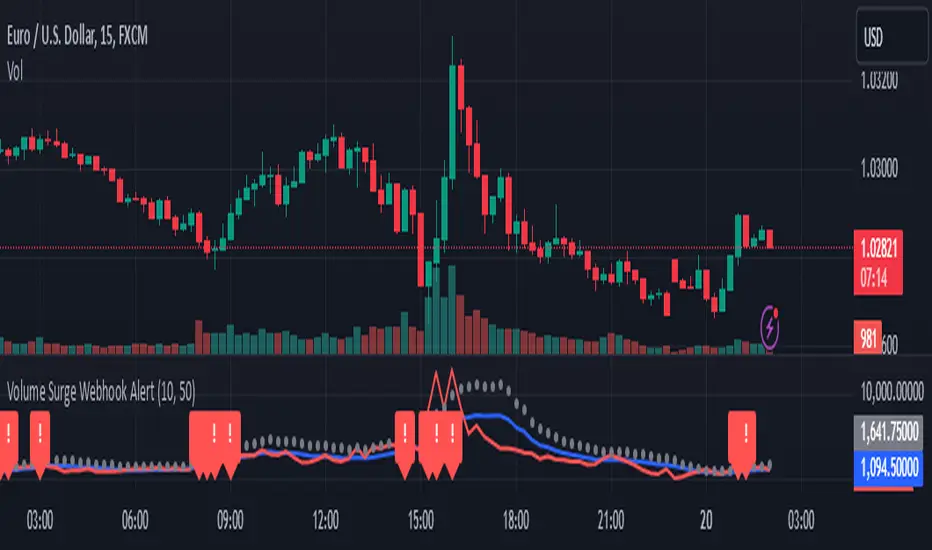
Volume Surge Webhook AlertThis TradingView indicator, named "Volume Surge Webhook Alert," is designed to find significant increases in trading volume and send out alerts with key information. It works by looking back at the volume over a certain number of past candlesticks, which you can set using the "Lookback Period" input. The indicator calculates the average volume during this period. Then, it sets a threshold for what counts as a "volume surge." This threshold is a percentage increase over the average volume, and you can adjust this percentage using the "Volume Surge Threshold (%)" input.
When the current candlestick's volume is higher than this threshold, the indicator considers it a volume surge. To help you see this visually, the indicator plots three lines on a separate chart: the average volume (in blue), the current volume (in red), and the threshold volume (in gray circles).
If a volume surge happens, the indicator creates a webhook alert. This alert sends a message in a structured format (like a digital envelope) that contains the following information: the symbol of the stock or cryptocurrency, the timeframe of the chart you're looking at, the current volume, the average volume, the threshold volume, and a simple message saying a volume surge was detected. This alert is sent only once when the candlestick closes with a volume surge.
Additionally, when a volume surge is detected, a small red exclamation mark "!" will appear above that candlestick on the main price chart.
Essentially, this indicator helps traders spot times when trading volume is unusually high, which can sometimes be a sign of important price movements. You can customize how sensitive the indicator is by changing the "Lookback Period" and the "Volume Surge Threshold (%)". The webhook alerts allow you to be notified automatically when these surges occur, so you don't have to constantly watch the charts.
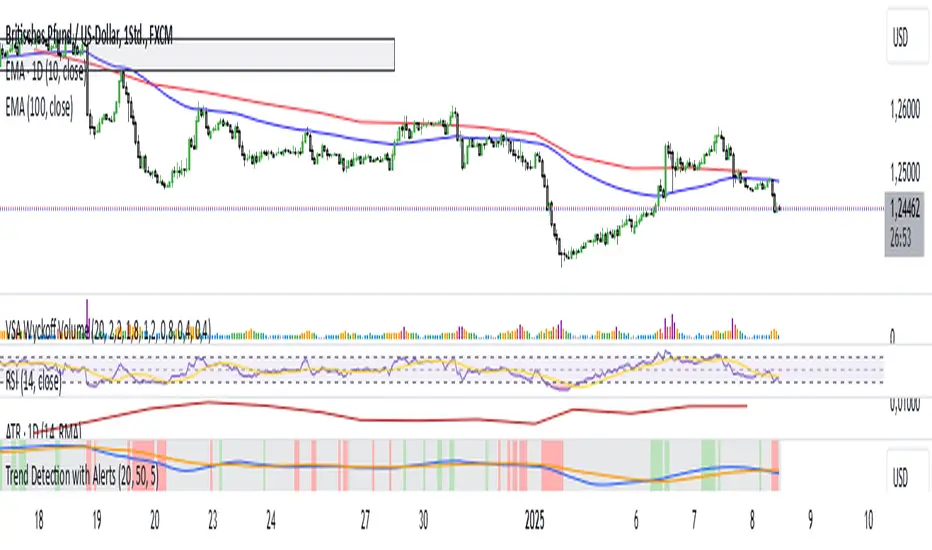
Trend Detection with AlertsPurpose of the Script
The script identifies trends on a chart (uptrend, downtrend, or sideways trend) and provides both visual cues and alerts when a trend changes. It uses two methods for trend detection:
Moving Averages (MA): It compares a short-term moving average (fast) with a long-term moving average (slow).
An uptrend occurs when the short-term MA is above the long-term MA.
A downtrend occurs when the short-term MA is below the long-term MA.
Price Action:
Higher highs (HH) indicate bullish momentum.
Lower lows (LL) indicate bearish momentum.
When these methods align, the script determines the trend and notifies the user of any trend changes.
Key Features
Moving Average Calculation:
A short-term moving average and a long-term moving average are calculated to determine the overall trend direction.
Trend Determination:
An uptrend is detected when the short-term MA is above the long-term MA and higher highs are present.
A downtrend is detected when the short-term MA is below the long-term MA and lower lows are present.
Otherwise, the trend is classified as sideways.
Alerts for Trend Changes:
Alerts are triggered when the trend changes from one state to another (e.g., sideways to uptrend).
Custom messages indicate the type of trend detected.
Background Colors:
The script changes the chart’s background color based on the current trend:
Green for uptrends.
Red for downtrends.
Gray for sideways trends.
Visualization of Moving Averages:
The moving averages are plotted on the chart for visual reference.
How It Works
Inputs for Flexibility:
The user can configure the lengths of the short-term and long-term moving averages.
A lookback period is used to determine higher highs or lower lows for additional confirmation.
Trend Logic:
The script checks the relationship between the moving averages to identify general trends.
It also evaluates price action to confirm trend strength (e.g., whether a higher high or lower low occurred).
Alert System:
When the detected trend changes (e.g., from sideways to uptrend), an alert is triggered. This ensures the user is notified of important market movements.
Dynamic Background Coloring:
The background color of the chart changes to reflect the current trend, making it easy to interpret the trend visually.
Use Cases
Trend Identification: Helps traders quickly identify market trends for decision-making.
Alerts for Trend Changes: Notifies traders when a new trend begins, ensuring they don’t miss key opportunities.
Visual Assistance: Makes it easier to interpret trends through color-coded backgrounds and moving average overlays.
Customization Options
Adjust Moving Average Lengths: Users can modify the short-term and long-term moving averages to suit their trading strategies.
Change Lookback Period: The sensitivity of higher highs and lower lows can be adjusted.
Personalized Alerts: Alerts can be customized for different trading scenarios.
Summary
This script provides an intuitive way to detect and visualize market trends while offering real-time alerts for trend changes. It’s an excellent tool for traders who want to stay informed about market conditions and make data-driven decisions.
ADX with Alerts for Strong Trending ConditionsMad Props to Chat GPT. Basically, this thing lets you set alerts on the ADX being Above 20 AND the Positive or Negative Directional Movement Line being Above the ADX. Useful for being alerted when a strong trend is in place to look for the pullback.
Description
The ADX with Custom Alerts indicator is designed to assist traders in identifying trends and potential trading opportunities based on the Average Directional Index (ADX) and Directional Indicators (DI+ and DI-). This tool provides a clear visual representation of market strength and directional movement, enhancing decision-making in trading.
Features
ADX Calculation:
The ADX measures the strength of a trend, regardless of its direction. The indicator calculates the ADX using a configurable length and a smoothing parameter, allowing traders to customize it based on their trading preferences.
Directional Indicators:
DI+: Represents bullish momentum.
DI-: Represents bearish momentum.
The indicator plots both DI+ and DI- alongside the ADX to give a complete picture of market direction.
Alert Conditions:
The indicator includes custom alert conditions that notify traders when:
Condition 1: The ADX rises above the defined threshold (default set at 20) and DI+ is above the ADX, indicating potential bullish momentum.
Condition 2: The ADX rises above the defined threshold and DI- is above the ADX, indicating potential bearish momentum.
Visual Representation:
The ADX line is plotted in blue, with the DI+ line in green and the DI- line in red.
A dotted horizontal line represents the ADX threshold, providing a clear visual cue for trend strength.
Background Highlighting:
The indicator uses background coloring to enhance visual analysis:
Green shading indicates when DI+ is above the ADX, suggesting bullish conditions.
Red shading indicates when DI- is above the ADX, suggesting bearish conditions.
Customizable Parameters:
Traders can adjust the length of the ADX calculation, the smoothing factor, and the threshold level to suit their trading strategies and timeframes.
Usage
This indicator is particularly useful for traders looking to:
Identify strong trends and potential entry points based on trend strength.
Make informed decisions using alerts that signal important market conditions.
Enhance their trading strategies with clear visual cues and customizable parameters.

FVG Alerts (Vortus)What are Fair Value Gaps (FVGs)?
Fair Value Gaps (FVGs) represent price inefficiencies where buying and selling volumes are imbalanced, creating gaps between the wicks of consecutive candles. These gaps often act as magnets for price, as markets tend to "fill" these gaps before resuming their trend.
FVGs can signal potential entry or exit points, making them a valuable tool for traders looking to exploit these price inefficiencies.
How to Use the Script to Add Alerts:
1. Add the Script to Your Chart:
Load the script into TradingView by pasting it into the Pine Script Editor, then apply it to your chart.
2. Adjust Your Settings:
In the "FVG Settings" section, decide whether you want gaps to be removed after their midpoint or full fill. You can also choose to identify gaps only after a candle has closed, adding a level of confirmation to your strategy.
Customize the colors for Bullish and Bearish FVGs under "Visual Settings" to match your chart's theme.
3. Set Up Your Alerts:
After adding the script to your chart, go to the "Alerts" section in TradingView.
Select either "Bullish FVG Filled" or "Bearish FVG Filled" from the "Condition" dropdown menu.
Configure the alert parameters such as frequency, expiration, and notification method according to your trading strategy.
4. Stay on Top of the Market:
Once set up, the script will automatically notify you when a Fair Value Gap is filled, keeping you informed of potential reversal or continuation opportunities without needing to constantly monitor the charts.
Feedback is Welcome

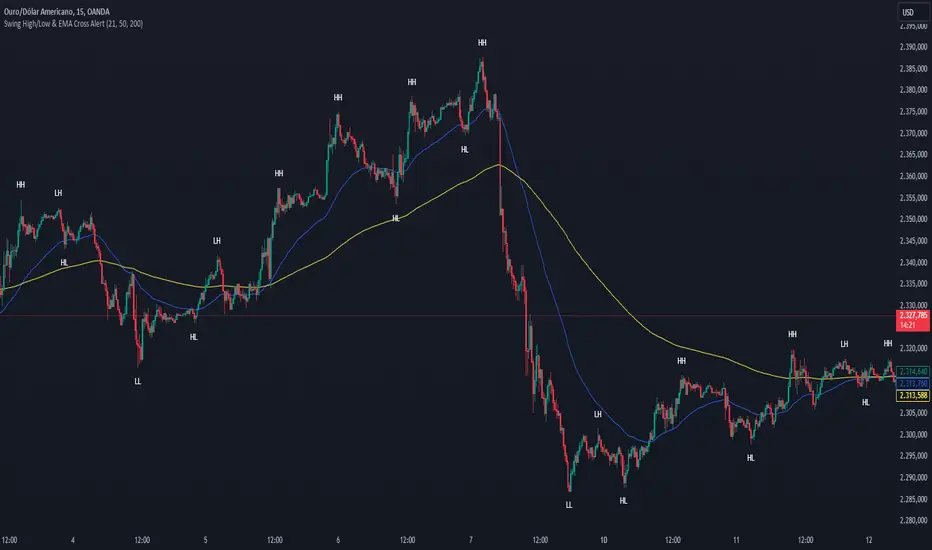
Swing High/Low & EMA Cross AlertScript Description:
This script on TradingView combines the detection of Swing High/Low points with exponential moving average (EMA) crossovers to provide buy and sell alerts and to mark swing points on the chart.
What the Script Does:
Swing High/Low Detection:
Uses the ta.pivothigh function to detect significant high points and the ta.pivotlow function to detect significant low points.
For each detected point, the script checks if it is a new higher high (HH) or lower high (LH) for the highs, and a new lower low (LL) or higher low (HL) for the lows.
Creates visual labels to identify these points on the chart, helping traders to visualize potential reversal points.
EMA Crossover:
Calculates two EMAs: a fast EMA (fastEMA) with a default period of 50 and a slow EMA (slowEMA) with a default period of 200.
Detects bullish crossovers (when fastEMA crosses above slowEMA) and bearish crossunders (when fastEMA crosses below slowEMA).
Generates buy and sell alerts based on these crossovers.
How the Script Works:
EMA Calculation: EMAs are calculated using the closing prices and user-defined periods.
Swing High/Low Detection: Uses the high and low values from the previous length bars to determine the swing points.
Alert Generation: Alerts are triggered when crossovers between the EMAs occur.
How to Use the Script:
Add to Chart: Insert the script into TradingView and apply it to the desired chart.
Configure Parameters:
Adjust the detection period for swing points (length).
Configure the periods for the EMAs (fastLen and slowLen).
Customize the colors for the swing point labels as per your preference.
Monitor Alerts: Use the EMA crossover alerts to make buy or sell decisions. Observe the swing point labels to identify potential trend reversals.
Justification for the Combination:
EMAs: Widely used to identify trend direction. Combining a fast EMA with a slow EMA helps capture both short-term and long-term trend changes.
Swing High/Low: Identifies reversal points in price, which are crucial for determining potential entry and exit points in trades.
Combination:
Combining EMAs and Swing High/Low provides a comprehensive view of price behavior, helping traders to effectively identify trends and reversal points.
This script is useful for traders who want to combine trend analysis (via EMAs) with the identification of reversal points (Swing High/Low), providing a more complete view of price behavior on the chart.
EMA Scalp Alerts by Sabir KhanThis TradingView indicator, developed by Sabir Khan, is designed for scalping strategies based on Exponential Moving Averages (EMAs). The indicator visually represents three EMAs with customizable parameters and provides alerts for potential trading signals.
Key Features:
Fast EMA: User-configurable fast EMA with default period set to 21.
Slow EMA: User-configurable slow EMA with default period set to 55.
Third EMA: User-configurable third EMA with default period set to 200.
Line Width: Adjustable line width for the fast and third EMAs, allowing customization for better visibility.
Color Customization: Choose colors for each EMA to suit your chart preferences.
Alerts: Automatic alerts for potential trading signals:
Long Signal: Triggered when the fast EMA crosses above the slow EMA.
Short Signal: Triggered when the fast EMA crosses below the slow EMA.
All EMAs Crossover: Triggered when all three EMAs cross over, indicating a potentially strong trend.
Usage:
Users can observe the visual representation of the three EMAs on the chart.
Alerts are generated for potential long, short, or strong trend signals based on EMA crossovers.
The indicator's parameters, including EMA periods, line widths, and colors, are customizable to fit individual preferences.
Alert Message Format:
The alert message provides essential information about the detected signal, including the signal type (Long, Short, None), the involved symbol, timeframe, open, close, high, low, and whether a strong crossover is detected.
Note: This indicator is particularly suitable for traders employing scalp trading strategies focusing on short-term market movements.
*Disclaimer: Trading involves risk, and users should conduct their own research and analysis before making any trading decisions based on this indicator.*

Crypto Spot/Futures Dominance Indicator with AlertsFutures/Spot Dominance Indicator:
Overview:
The futures/spot dominance indicator is a versatile tool used by traders and analysts to assess the relative strength or dominance of the futures market in relation to the spot (or cash) market for a specific asset. It offers insights into market sentiment, potential arbitrage opportunities, and risk management while incorporating the VWAP indicator for added context.
How It Works:
This indicator automatically detects and adapts to the futures symbol applied to the chart, simplifying the setup for traders. However, it still necessitates manual input of the corresponding spot pair to ensure accuracy.
Automatic Futures Symbol Detection: The indicator starts by automatically detecting the futures symbol on the trading chart, eliminating the need for manual configuration. This ensures that the indicator is applied to the correct futures contract.
Manual Spot Pair Entry: To provide a reliable reference point for the comparison, traders must manually input the corresponding spot symbol via the indicator's inputs. For instance, if the indicator detects the BTCUSDT.P futures symbol, traders would manually enter the BTCUSDT spot symbol.
Gathering Data: The indicator collects historical price data for both the detected futures contract and the manually specified spot symbol. This data includes open, high, low, and close prices, as well as trading volume.
VWAP Calculation: To gain a deeper understanding of price trends and market dynamics, the indicator calculates the VWAP (Volume Weighted Average Price) for both the futures and spot markets. The VWAP places more weight on prices with higher trading volume, offering a weighted average that reflects market consensus.
Premium/Discount Calculation: By subtracting the VWAP of the spot market from the VWAP of the futures market, the indicator quantifies the premium or discount of the futures price concerning the spot price. A positive value indicates a premium, while a negative value suggests a discount.
Plotting: The premium/discount value is displayed as a line on the chart, often alongside moving averages or other smoothing techniques for improved trend analysis.
Alerts: In addition to its analysis capabilities, this indicator now includes alerts to enhance your trading experience. It alerts you in the following scenarios:
Premium Above Average: Notifies you when the premium crosses above the average line.
Premium Below Average: Alerts you when the premium crosses below the average line.
Premium Above Zero: Provides an alert when the premium crosses above the zero line.
Premium Below Zero: Generates an alert when the premium crosses below the zero line.
Benefits of the Futures/Spot Dominance Indicator:
Sentiment Analysis: Traders use the indicator to assess market sentiment. A futures premium might signify bullish sentiment, while a discount could indicate bearish sentiment.
Arbitrage Opportunities: Identifying price discrepancies between futures and spot markets can help traders spot arbitrage opportunities, where they can profit from price differentials.
Risk Management: The indicator assists in evaluating risks associated with futures positions, helping traders manage their exposure effectively.
Trend Confirmation: When used in conjunction with other technical indicators, futures/spot dominance, along with VWAP, can provide additional confirmation of price trends.
Hedging: Investors and corporations use this tool to gauge the effectiveness of hedging strategies based on futures contracts.
Speculative Trading: Traders and investors use the indicator to inform speculative positions, aligning their trades with perceived market strength or weakness.
Insightful Analysis: Futures/spot dominance analysis, enriched by VWAP data, offers insights into market behavior during specific events or changes in economic conditions.
In summary, the futures/spot dominance indicator, with its integration of VWAP and automatic futures symbol detection, provides traders and investors with a comprehensive tool to assess market dynamics. It aids in sentiment analysis, risk management, and trend confirmation while offering potential arbitrage opportunities. The newly added alerts enhance the indicator's functionality, providing timely notifications of key market events. However, it relies on manual input of the corresponding spot pair to ensure precise comparisons between futures and spot markets. It should be used alongside other analysis techniques for a well-rounded view of the market.

Southern Star Shadows with AlertThe "Southern Star Shadows with Alert" indicator in Pine Script is designed to identify and visually represent a specific candlestick pattern known as the "Southern Star Shadows" pattern on a TradingView chart. This pattern can provide traders with potential signals for both bullish and bearish market conditions.
Here's a short description of how the indicator works:
Pattern Identification: The indicator scans price data to identify the conditions that constitute a "Southern Star Shadows" pattern. It checks for a combination of factors, including the relationship between the current and previous candle's high, low, open, and close prices.
Signal Generation: The indicator assigns a signal based on the identified pattern. It generates a "1" for a bullish signal and "-1" for a bearish signal. If the pattern conditions are not met, it assigns a "0," indicating no clear signal.
Visualization: The indicator visually represents the signals by coloring the price bars. Bullish signals are typically colored in blue, while bearish signals are colored in red.
Triangle Plots: Additionally, the indicator plots small triangle shapes above the respective candles to highlight where the pattern occurred. Green triangles are used for bullish signals, and red triangles are used for bearish signals.
Alerts: Traders can set up alerts based on the indicator. When the pattern is detected and a signal is generated, the indicator sends an alert message, providing traders with a timely notification of potential trading opportunities.
Overall, the "Southern Star Shadows with Alert" indicator helps traders identify and react to potential trend reversal or continuation opportunities in the market by recognizing specific candlestick patterns and providing visual and alert-based signals.

Price Change AlertsThis purpose of this indicator script is to reduce time traders spend staring on the charts.
For example if you're trading BTCUSD you can set alerts to be trigered by desired delta amount, for example 50. Then you can receive push notifications on your phone (need to install the tradinview app) and on your desktop computer every time price changes by amount of 50. Simple and easy.
To enable alerts do this:
- Click on alerts clock icon in top right corner of the screen
- Click on "Create alert button"
- In Condition dropdown select "alerts"
- In the next dropdown select "Any alert function() call" and click on "Create" button
Script uses repainting on purpose to display daily percentage changes since the previous day's closing and to triger alerts.

Relative Volume Screener AlertsThis script will screen 12 different stocks and current chart (13 in total) for entry points from my relative volume indicator.
1. Enter in any ticker ID's from charts you wish to scan in the settings.
2. Go to desired timeframe.
3. Click add alert button at top toolbar.
4. Select RVOL Screener Alerts indicator, input alert notification settings and/or change alert name and click create.
The script will then scan the stocks and alert you of any entry points from the timeframe you set the alerts.
A new alert needs to be created for each timeframe you wish to screen.
You can find my relative volume indicator here:

Multiple Screeners with AlertsI already published few version of my custom screeners. Unfortunately, because of TradingView's security function call limit you can't use more than 40 stocks in 1 screener.
Fortunately, you can compute multiple values in your function and screen few indicators at once.
In this script I show how you can compute 5 indicators at the same time for 40 instruments. I display then in different labels.
Every label consist of list of instruments satisfying current indicator conditions and a value for it. It can be absolute value as for RSI or -1/1 representing Bullish/Bearish event.
Also you can create 1 alert with result of all screeners inside.
In this example I took 5 indicators with following conditions:
RSI - "RSI < 30" or "RSI > 70"
TSI - "TSI < -30" or "RSI >30"
ADX - "ADX > 40"
MACD - "MACD Bullish Cross" or "MACD Bearish Cross" (1 and -1 in screener)
AO - "AO Crosses 0 UP" or "AO Crosses 0 DOWN" (1 and -1 in screener)
Params
- bars_apart - this parameter define how may bars apart you labels are on your chart. If you see labels overlapping, increase this number.
- Parameters for all used indicators
- 40 symbol inputs for instruments you want to use in this screener
Alerts
You can create an alert from it easily by selecting screener name from the list and then selecting "Any alert() function call".
No additional configuration is required, message and alert on close is generated in the code.
You should better change default name for your alert. Sometimes because of big amount of inputs you might receive an error.
Disclaimer
Please remember that past performance may not be indicative of future results.
Due to various factors, including changing market conditions, the strategy may no longer perform as good as in historical backtesting.
This post and the script don’t provide any financial advice.

Custom Screener with Alerts [QuantNomad]Some time ago I published an example of simple custom screener in PineScript:
The only thing this screener did is created a dynamic label with screener output.
Recently TradingView announced alerts from the strategy with the possibility to add custom messages to alerts.
So using it I was able to create a bit more advanced screener which sends results as alert messages. With tools like Alertatron, you can easily redirect them to Telegram if you want.
It works for 40 symbols (limitation of the number of security calls).
To create your own screener you need to change only screenerFunc. The logic of this function is very simple, it outputs value you want to display in screener and condition based on which your screener should filter your stocks.
To create alerts for this screener create an alert from strategy and use {{strategy.order.alert_message}} as alert message.
Do you know now how to make this screener better? Let me know.
Disclaimer
Please remember that past performance may not be indicative of future results.
Due to various factors, including changing market conditions, the strategy may no longer perform as good as in historical backtesting.
This post and the script don’t provide any financial advice.

W/D/4HR OTE Aligner (V6) - Alerts This indicator is a multi-timeframe (MTF) alignment and Optimal Trade Entry (OTE) alert tool designed for discretionary manual trading on the 15-minute timeframe.
Here is a description of its core functionality:
W/D/4HR OTE Aligner (V6) - Alerts
This custom TradingView indicator assists manual traders by identifying high-probability trading setups that meet specific structural and momentum criteria across multiple timeframes. It does not place trades automatically but generates a "Trade Signal" used for setting up reliable alerts.
Key Features:
Multi-Timeframe Bias Confirmation: The indicator uses a 50-period Exponential Moving Average (EMA) to confirm that the Weekly, Daily, and 4-Hour timeframes are all aligned in the same direction (all above for bullish, all below for bearish). This provides a strong directional bias.
OTE Zone Identification: It dynamically calculates recent swing highs and lows on the 4-hour chart (using reliable pivot detection) and highlights the Optimal Trade Entry (OTE) zone, typically centered around the 0.618 Fibonacci Retracement level.
15-Minute Entry Signal: Once price enters the OTE zone within the aligned trend direction, the indicator looks for a confirmation entry signal on the 15-minute chart, specifically a 9-period EMA crossing the 20-period EMA.
Manual Alert System: A transparent "Trade Signal" plot provides the trigger source for a manual TradingView alert, notifying the user exactly when all criteria are met for a potential long or short trade entry.
This indicator is a tool for finding precise entry points within dominant, confirmed trends.
for clarity i built this using Google AI to help with being away from the charts it reflects how i wish to progress on my journey so any tips or feed back with me much appreciated

ADR Dashboard with Move, Left and AlertsIndicator Name: ADR Dashboard with Move, Left and Alerts
Overview
The ADR Dashboard is a powerful real-time trading tool that tracks how much a stock, crypto, or other asset has moved today relative to its Average Daily Range (ADR). It provides a clear visual representation of:
1. Today’s price movement (Move)
2. Remaining potential movement left to reach ADR (Left)
3. Percentage of ADR covered (% Covered)
4.Additionally, it provides automated alerts for key movement thresholds.
A) What it Does
1.Calculates the Average Daily Range (ADR):
2. Uses True Range over a user-defined lookback period (default 14 days).
3. ADR measures typical daily volatility.
B) Tracks Today’s Move:
1. Move = Current Price – Today’s Open (Realtime)
2. Positive → bullish move, Negative → bearish move
C) Tracks Remaining Potential (Left):
1. Left = ADR – |Move| (Realtime)
2. Shows how much of the ADR is still available for today’s move
3. Percentage Covered:
4. % Covered = |Move| / ADR × 100
D) Color-coded for visual clarity:
1. Green (<50%) → small move, plenty of range left
2. Yellow (50–80%) → moderate move, watch for acceleration
3. Orange (80–100%) → strong move, ADR almost reached
4. Red (>100%) → ADR exceeded, momentum may be exhausted
E) Dashboard Table:
1. Columns: ADR | Move | Left | % Covered
2. Position: middle-right of the chart
F) Left column color-coded:
1. Green → some ADR left
2. Red → ADR fully reached or exceeded
3. Move column: usually yellow for visibility, but could be enhanced for positive/negative moves
G) Alerts
The indicator provides directional alerts:
Bullish Alerts (upward moves):
1. 90% ADR warning: fires when Move ≥ 90% of ADR → early warning of strong bullish momentum
2. 100% ADR breach: fires when Move ≥ ADR → full daily range reached
Bearish Alerts (downward moves):
1. 90% ADR warning: fires when Move ≤ -90% of ADR → early warning of strong bearish momentum
2. 100% ADR breach: fires when Move ≤ -ADR → full daily range reached
All alerts are unique and fire once per session per threshold.
H) How Traders Can Use This Indicator
Momentum Trading:
1. Identify strong intraday moves approaching ADR.
2. Enter positions early at 90% ADR warning or take profits near 100% ADR.
Scalping & Intraday Trading:
1. Gauge how much of today’s range is left for quick entries/exits.
2. Avoid trades when ADR is almost fully consumed → reduces risk of reversals.
Swing Trading:
1. Combine with trend indicators to see if today’s move is significant relative to historical volatility.
I) Risk Management:
1. Set profit targets or stop-loss levels based on Move and Left values.
Visual Efficiency:
At-a-glance view of Move, Left, % Covered, and alert status without manual calculations.
Key Features
1. Real-time Move and Left updates
2. Color-coded % Covered and Left for quick visualization
3. Alerts for 90% and 100% ADR levels, bullish and bearish
4. Clean dashboard table at middle-right of the chart
5. Works across stocks, crypto, forex, and other markets
J) Why This Indicator is Powerful
1. Combines volatility (ADR) with real-time price tracking
2. Provides visual clarity and actionable alerts
3. Helps traders stay ahead of intraday moves, manage risk, and time entries/exits effectively

Order Flow Analysis [Master Alert]This script is a custom modification of the original "Order Flow Analysis" indicator by kingthies.
I have taken the original code and engineered a "Master Alert" system into it. Here is the breakdown of what this specific script does:
1. The Core Purpose: "One Ring to Rule Them All"
In the original script, if you wanted to catch every move, you would have to set up separate alerts for Divergences, Absorptions, Crosses, etc. This modified script combines all 8 possible signals into a single "Master Trigger."
2. What triggers the Alert?
The alert will fire if ANY of the following 4 events happen on a candle:
Divergence (The Arrows):
Green Arrow: Price makes lower low, Pressure makes higher low (Bullish).
Red Arrow: Price makes higher high, Pressure makes lower high (Bearish).
Absorption (The Transparent Bars):
Bull Absorption: Huge volume + Price won't drop (Hidden Buying).
Bear Absorption: Huge volume + Price won't rise (Hidden Selling).
Zero Line Crosses (The Sentiment Flip):
Bull Cross: Pressure score flips from Negative to Positive.
Bear Cross: Pressure score flips from Positive to Negative.
Strong Zones (Turbo Mode):
Strong Bull: Pressure score breaks above +50.
Strong Bear: Pressure score breaks below -50.
3. How to Use It
Add the script to your chart.
Create an Alert.
Select "Order Flow Master" as the Condition.
Select "MASTER ALERT (All Signals)".
Now, you will get a notification for every single significant event this indicator detects, without needing multiple alert slots.
