DojiCandle body size RSI-SMMA filter MTF
DojiCandle body size RSI-SMMA filter MTF
Hi. I was inspired by a public script written by @ahmedirshad419, .
I thank him for his idea and hard work.
His script is the combination of RSI and Engulfing Pattern.
//------------------------------------------------------------
I decided to tweak it a bit with Open IA.
I have changed:
1) candle pattern to DojiCandle Pattern;
2) I added the ability for the user to change the size of the candlestick body;
3) Added SMMA 200;
4) Changed the colour of SMMA 200 depending on price direction;
5) Added a change in the colour of candlesticks, depending on the colour of the SMMA 200;
6) Added buy and sell signals with indicator name, ticker and close price;
7) Added ability to use indicator on multi time frame.
How it works
1. when RSI > 70 > SMMA 200 and form the bullish DojiCandle Pattern. It gives sell signal
2. when RSI < 30 < SMMA 200 and form the bearish DojiCandle Pattern. It gives buy signal
settings:
basic setting for RSI, SMMA 200 has been enabled in the script to set the levels accordingly to your trades
Enjoy
스크립트에서 "ai"에 대해 찾기

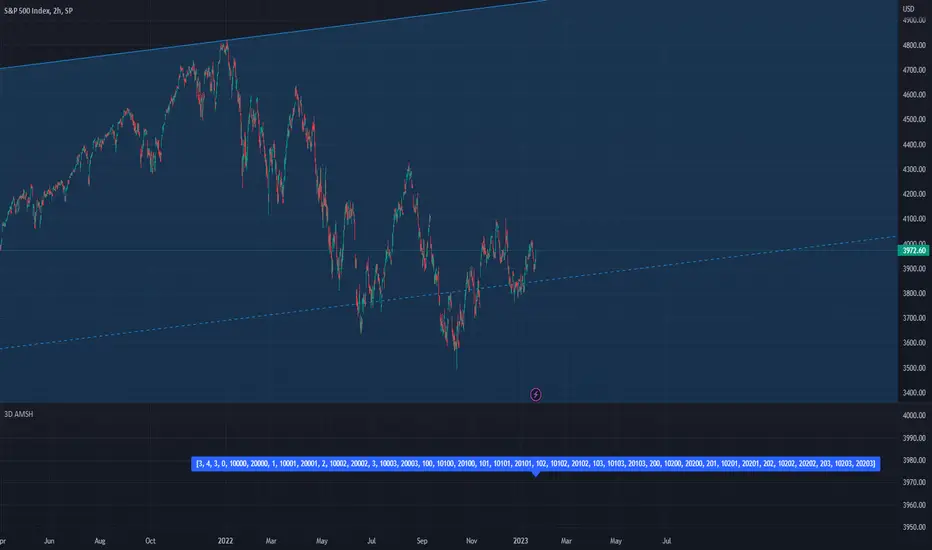
PSv5 3D Array/Matrix Super Hack"In a world of ever pervasive and universal deceit, telling a simple truth is considered a revolutionary act."
INTRO:
First, how about a little bit of philosophic poetry with another dimension applied to it?
The "matrix of control" is everywhere...
It is all around us, even now in the very place you reside. You can see it when you look at your digitized window outwards into the world, or when you turn on regularly scheduled television "programs" to watch news narratives and movies that subliminally influence your thoughts, feelings, and emotions. You have felt it every time you have clocked into dead end job workplaces... when you unknowingly worshiped on the conformancy alter to cultish ideologies... and when you pay your taxes to a godvernment that is poisoning you softly and quietly by injecting your mind and body with (psyOps + toxicCompounds). It is a fictitiously generated world view that has been pulled over your eyes to blindfold, censor, and mentally prostrate you from spiritually hearing the real truth.
What TRUTH you must wonder? That you are cognitively enslaved, like everyone else. You were born into mental bondage, born into an illusory societal prison complex that you are entirely incapable of smelling, tasting, or touching. Its a contrived monetary prison enterprise for your mind and eternal soul, built by pretending politicians, corporate CONartists, and NonGoverning parasitic Organizations deploying any means of infiltration and deception by using every tactic unimaginable. You are slowly being convinced into becoming a genetically altered cyborg by acclimation, socially engineered and chipped to eventually no longer be 100% human.
Unfortunately no one can be told eloquently enough in words what the matrix of control truly is. You have to experience it and witness it for yourself. This is your chance to program a future paradigm that doesn't yet exist. After visiting here, there is absolutely no turning back. You can continually take the blue pill BIGpharmacide wants you to repeatedly intake. The story ends if you continually sleep walk through a 2D hologram life, believing whatever you wish to believe until you cease to exist. OR, you can take the red pill challenge, explore "question every single thing" wonderland, program your arse off with 3D capabilities, ultimately ascertaining a new mathematical empyrean. Only then can you fully awaken to discover how deep the rabbit hole state of affairs transpire worldwide with a genuine open mind.
Remember, all I'm offering is a mathematical truth, nothing more...
PURPOSE:
With that being said above, it is now time for advanced developers to start creating their own matrix constructs in 3D, in Pine, just as the universe is created spatially. For those of you who instantly know what this script's potential is easily capable of, you already know what you have to do with it. While this is simplistically just a 3D array for either integers or floats, additional companion functions can in the future be constructed by other members to provide a more complete matrix/array library for millions of folks on TV. I do encourage the most courageous of mathemagicians on TV to do so. I have been employing very large 2D/3D array structures for quite some time, and their utility seems to be of great benefit. Discovering that for myself, I fully realized that Pine is incomplete and must be provided with this agility to process complex datasets that traders WILL use in the future. Mark my words!
CONCEPTION:
While I have long realized and theorized this code for a great duration of time, I was finally able to turn it into a Pine reality with the assistance and training of an "artificially intuitive" program while probing its aptitude. Even though it knows virtually nothing about Pine Script 4.0 or 5.0 syntax, functions, and behavior, I was able to conjure code into an identity similar to what you see now within a few minutes. Close enough for me! Many manual edits later for pine compliance, and I had it in chart, presto!
While most people consider the service to be an "AI", it didn't pass my Pine Turing test. I did have to repeatedly correct it, suffered through numerous apologies from it, was forced to use specifically tailored words, and also rationally debate AND argued with it. It is a handy helper but beware of generating Pine code from it, trust me on this one. However... this artificially intuitive service is currently available in its infancy as version 3. Version 4 most likely will have more diversity to enhance my algorithmic expertise of Pine wizardry. I do have to thank E.M. and his developers for an eye opening experience, or NONE of this code below would be available as you now witness it today.
LIMITATIONS:
As of this initial release, Pine only supports 100,000 array elements maximum. For example, when using this code, a 50x50x40 element configuration will exceed this limit, but 50x50x39 will work. You will always have to keep that in mind during development. Running that size of an array structure on every single bar will most likely time out within 20-40 seconds. This is not the most efficient method compared to a real native 3D array in action. Ehlers adepts, this might not be 100% of what you require to "move forward". You can try, but head room with a low ceiling currently will be challenging to walk in for now, even with extremely optimized Pine code.
A few common functions are provided, but this can be extended extensively later if you choose to undertake that endeavor. Use the code as is and/or however you deem necessary. Any TV member is granted absolute freedom to do what they wish as they please. I ultimately wish to eventually see a fully equipped library version for both matrix3D AND array3D created by collaborative efforts that will probably require many Pine poets testing collectively. This is just a bare bones prototype until that day arrives. Considerably more computational server power will be required also. Anyways, I hope you shall find this code somewhat useful.
Notice: Unfortunately, I will not provide any integration support into members projects at all. I have my own projects that require too much of my time already.
POTENTIAL APPLICATIONS:
The creation of very large coefficient 3D caches/buffers specifically at bar_index==0 can dramatically increase runtime agility for thousands of bars onwards. Generating 1000s of values once and just accessing those generated values is much faster. Also, when running dozens of algorithms simultaneously, a record of performance statistics can be kept, self-analyzed, and visually presented to the developer/user. And, everything else under the sun can be created beyond a developers wildest dreams...
EPILOGUE:
Free your mind!!! And unleash weapons of mass financial creation upon the earth for all to utilize via the "Power of Pine". Flying monkeys and minions are waging economic sabotage upon humanity, decimating markets and exchanges. You can always see it your market charts when things go horribly wrong. This is going to be an astronomical technical challenge to continually navigate very choppy financial markets that are increasingly becoming more and more unstable and volatile. Ordinary one plot algorithms simply are not enough anymore. Statistics and analysis sits above everything imagined. This includes banking, godvernment, corporations, REAL science, technology, health, medicine, transportation, energy, food, etc... We have a unique perspective of the world that most people will never get to see, depending on where you look. With an ever increasingly complex world in constant dynamic flux, novel ways to process data intricately MUST emerge into existence in order to tackle phenomenal tasks required in the future. Achieving data analysis in 3D forms is just one lonely step of many more to come.
At this time the WesternEconomicFraudsters and the WorldHealthOrders are attempting to destroy/reset the world's financial status in order to rain in chaos upon most nations, causing asset devaluation and hyper-inflation. Every form of deception, infiltration, and theft is occurring with a result of destroyed wealth in preparation to consolidate it. Open discussions, available to the public, by world leaders/moguls are fantasizing about new dystopian system as a one size fits all nations solution of digitalID combined with programmableDemonicCurrencies to usher in a new form of obedient servitude to a unipolar digitized hegemony of monetary vampires. If they do succeed with economic conquest, as they have publicly stated, people will be converted into human cattle, herded within smart cities, you will own nothing, eat bugs for breakfast/lunch/dinner, live without heat during severe winter conditions, and be happy. They clearly haven't done the math, as they are far outnumbered by a ratio of 1 to millions. Sith Lords do not own planet Earth! The new world disorder of human exploitation will FAIL. History, my "greatest teacher" for decades reminds us over, and over, and over again, and what are time series for anyways? They are for an intense mathematical analysis of prior historical values/conditions in relation to today's values/conditions... I imagine one day we will be able to ask an all-seeing AI, "WHO IS TO BLAME AND WHY AND WHEN?" comprised of 300 pages in great detail with images, charts, and statistics.
What are the true costs of malignant lies? I will tell you... 64bit numbers are NOT even capable of calculating the extreme cost of pernicious lies and deceit. That's how gigantic this monstrous globalization problem has become and how awful the "matrix of control" truly is now. ALL nations need a monumental revision of its CODE OF ETHICS, and that's definitely a multi-dimensional problem that needs solved sooner than later. If it was up to me, economies and technology would be developed so extensively to eliminate scarcity and increase the standard of living so high, that the notion of war and conflict would be considered irrelevant and extremely appalling to the future generations of humanity, our grandchildren born and unborn. The future will not be owned and operated by geriatric robber barons destined to expire quickly. The future will most likely be intensely "guided" by intelligent open source algorithms that youthful generations will inherit as their birth right.
P.S. Don't give me that politco-my-diction crap speech below in comments. If they weren't meddling with economics mucking up 100% of our chart results in 100% of tickers, I wouldn't have any cause to analyze any effects generated by them, nor provide this script's code. I am performing my analytical homework, but have you? Do you you know WHY international affairs are in dire jeopardy? Without why, the "Power of Pine" would have never existed as it specifically does today. I'm giving away much of my mental power generously to TV members so you are specifically empowered beyond most mathematical agilities commonly existing. I'm just a messenger of profound ideas. Loving and loathing of words is ALWAYS in the eye of beholders, and that's why the freedom of speech is enshrined as #1 in the constitutional code of the USA. Without it, this entire site might not have been allowed to exist from its founder's inceptions.
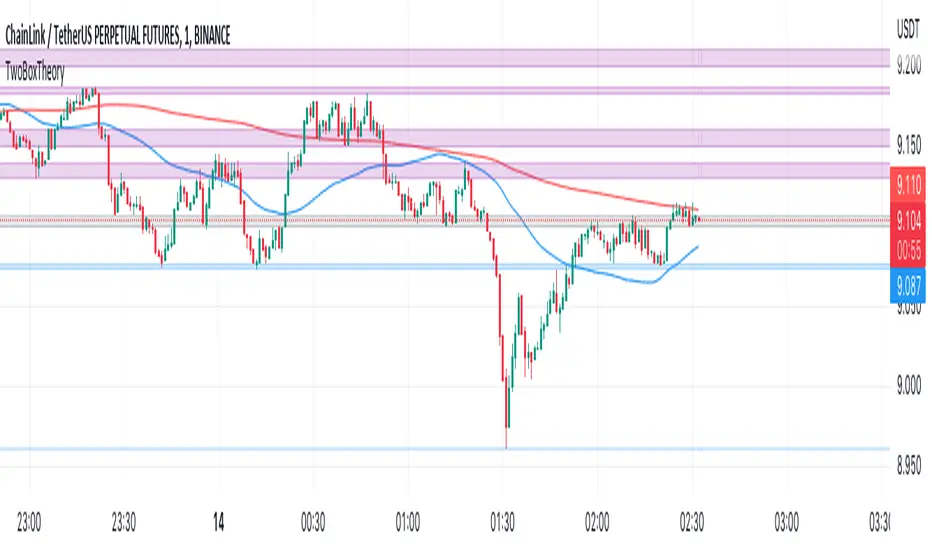
Two Box TheoryA channel is where the price action travels between two rectangular boxes. The Purple box line is treated as resistance and the Blue box line is treated as support.
Two Box Theory is a TradingView TM indicator that automatically locates and prints key support and resistance levels.
Its responsibility lies in its capacity to offer real-time visualisation to support your trade.
It is a flexible indicator that can be used for short or long time frames and has a precision of 8 decimal points, making it appropriate for all types of markets.
You can choose to get alerts immediately because each condition has its own set of alerts.
Two Box Theory has been tried, true, and tested for more than a year and has already earned the faith of those who have used it.
Two Box Theory has what it takes to take your trading to the next level, whether it's used as a stand-alone method or as an addition to your current approach.
Read the description to better understand the functions of this indicator.
1- It will automatically find Pivot Points to determine support and resistance by calculating extensive amount of data.
2- When it calculates new Pivot Points it will remove previous ones and the support/resistance channels will be updated.
3- For every upcoming Pivot Point it scans all previous Pivot Points in its channel horizontally.
4- It will show a different box (grey) when price action goes sideways. This is when the coin is in a no trade zone.
5- After breaking that level(grey box) upwards, it will change colour of its box to make support channel.
6- It will also alert you when the support or resistance breaks, you can set the alerts in the settings.
7- It also includes two Simple Moving Averages for further confirmations.
Here are some screenshots to understand how it functions:
The Auto-Support/Resistance feature in this indicator uses Artificial Intelligence (AI) to automatically plot the support/resistance levels and show them based on the strength of different levels to perform analysis.
AI is used to detect the support/resistance levels and rated based on the following factors:
i- Number of touches
ii- Length of the line
iii- Recency of the line
iv- Violations of the line
You can manage risk according to the support and resistance to set Stop-Loss and the potential take-profit based on the nearest support/resistance levels
Stop loss and take profit levels are made easy on this indicator and if you follow the instructions properly, your accuracy rate should lie between 85-95%
For example:
Support indications:
Resistance Indications and trading technique:
Resistance convert into support:
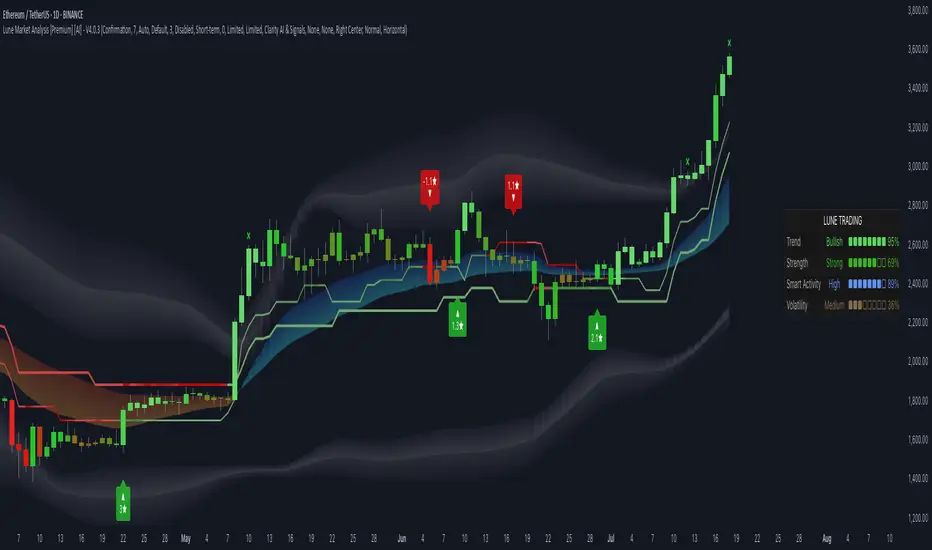
Lune Market Analysis Premium- Version 0.9 -
Lune Algo was developed and built by Lune Trading, utilizing years of their trading expertise. This indicator works on all stocks, cryptos, indices, forex, futures , currencies, ETF's, energy and commodities. All the tools and features you need to assist you on your trading journey. Best of all, Lune Algo is easy to use and many of our tools and strategies have been thoroughly backtested thousands of times to ensure that users have the best experience possible.
Overview
Trade Dashboard—Provides information about the current market conditions, Such as if the market is trending up or down, how much volatility is in the market and even displays information about the current signal.
Trade Statistics—This tool gives you a breakdown of the Statistics of the current selected strategy based on backtests. It tells you the percentage of how often a Take Profit or Stop Loss was hit within a specific time period. Risk and Trade management is very important in trading, and can be the difference between a winning and losing strategy. So we believe that this was mandatory.
Current Features:
Advanced Buy and Sell Signals
Exclusive built-in Strategies
Lune Confidence AI
EK Clouds
Reversal Bands
Vray (Volume Ray)
Divergence Signals
Reversal Signals
Support/Resistance Zones
Built-in Themes
Built-in Risk Management system (take profit/stop loss)
Trade Statistics
Trade Assistance
Trade Dashboard
Advanced Settings
+ More coming soon, Big plans!
Features Breakdown:
Lune Confirmation—Used to help you confirm your trades and trend direction. It uses unique calculations, and its settings can be adjusted to allow traders to adapt the settings to fit their trading style.
Lune Confidence AI—All strategies are equipped with our exclusive built-in Confidence AI. This feature tells you how much confluence there is in a trade. It uses a rating system where signals are given a number from 0 to 5. A rating of 0 indicates that there is not a lot of confluence or confidence in the signal, while a rating of 5 indicates that there is a lot of confidence in the trade. This feature is not perfect and will be improved overtime.
Support/Resistance Zones—Calculates the most important support/resistance levels based on how many times a level has been used as support or resistance. Traders also refer to these as supply and demand zones and key levels.
EK Clouds—Used to further help you confirm trend and was optimized to also be used as support and resistance. This feature is powered by custom moving averages.
Reversal Bands—An optimized and improved version of the infamous Bollinger Bands. When price action takes place within the Reversal Bands it usually indicates that the current symbol is overextended and a reversal is possible.
Vray—Also Known as "Volume Ray", Assists you in better visualizing volume. This helps you find key levels and areas of support that you wouldn't be able to see otherwise. It helps you trade like the institutions.
This indicator's signals DO NOT REPAINT.
If you are using this script you acknowledge past performance is not necessarily indicative of future results and there are many more factors that go into being a profitable trader.
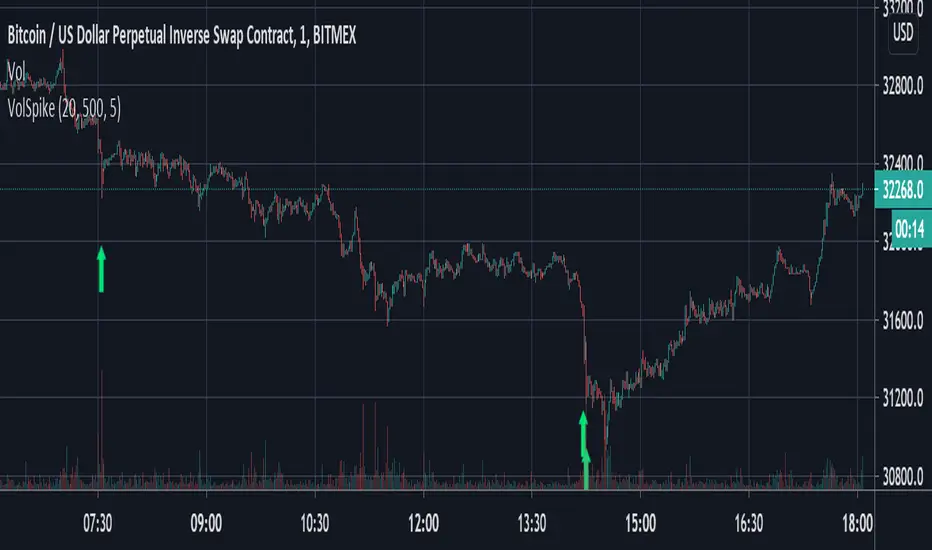
Volume Spike Strategy This is a Pine Script implementation of “Capitalize AI: Volume Spike Strategy" by Bitcoin Trading Challenge (copied with permission).
Original Capital AI formula :
If BTC/USD 1 minute volume > BTC/USD average volume in 20-1m bar by at least 500% and if BTC/USD is below the MA (5,1m,close) of BTC/USD then buy 10,000 USD WORTH of BTC/USD
Tested on XBTUSD 1 minute.
Original strategy is buy-only. Option for sells was added (enable in settings).
First published script -- comments/feedback appreciated
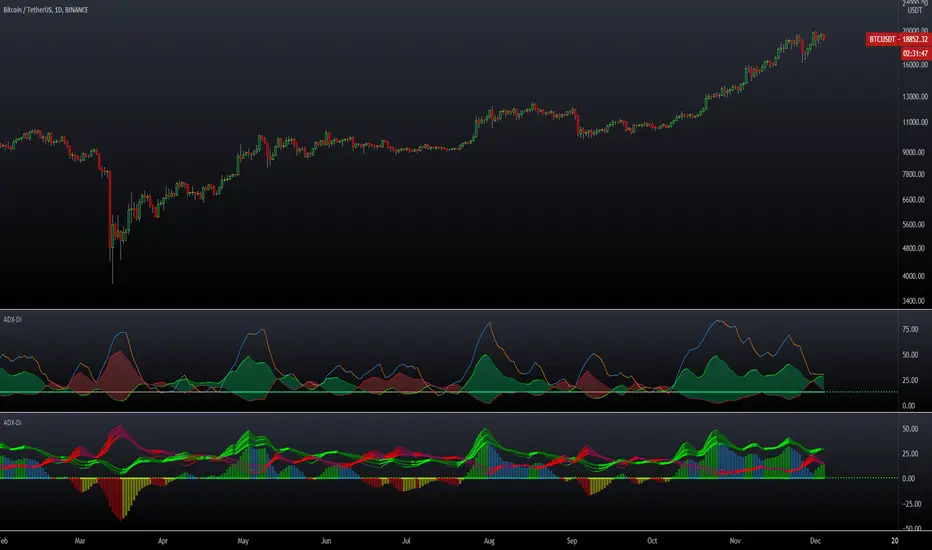
ADX DMI 3x - Dingue- ADX DMI DINGUE -
Français (bottom) / English
The best baddest - The Ultimate ADX DMI indicator for you to use.
Good to clearly see who's in control. Bear Bull
Includes :
- 3x ADX
- 3x DMI
- 3 line system which uses DMI calculation and put it in a single line instead of positive / negative.
Manual or Auto settings which adjusts length based on time frame used on screen.
Color coded for clear direction.
Squeeze shows when both sides are close together and this is when the trend might change or keep going.
Suggestions are welcome, ask below for any questions.
Try my other "DINGUE" indicators.
Thanks.
----------------- Français -----------------
Le meilleur, le plus génial - L'ultime indicateur ADX DMI pour votre utilisation
Très bon pour voir qui est en contrôle.
Inclu :
- 3x ADX
- 3x DMI
- 3 lignes qui remplace les lignes positives négatives du DMI pour une visualisation plus simple.
Paramétrage manuel ou automatique qui ajuste les valeurs selon la grandeur de chandelles utilisée à l'écran.
Codé avec des couleurs pour une visibilités de la direction claire.
Squeeze qui montre quand les 2 côtés sont près l'un de l'autre et quand un changement de contrôle ou une continuation de la tendance se produit.
Suggestions appréciées, pour toutes questions, écrire dans les commentaires plus bas.
Essayez les autres indicateurs "DINGUE".
Merci.
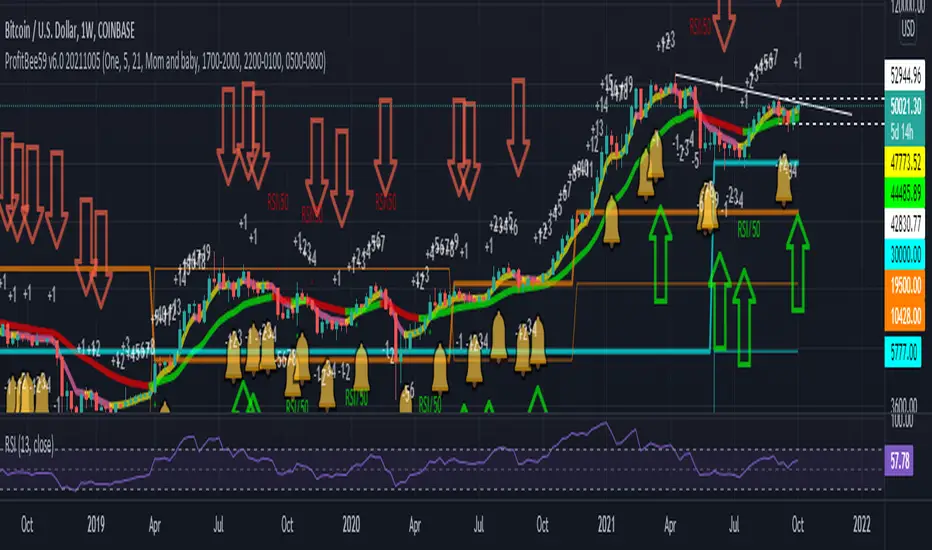
ProfitBee59 v6.0ProfitBee59 v6.0 for TradingView (pb6 ai) helps you do tedious works on your technical charts.
*It does CC59 counting and prints out a positive or negative number on each price bar.
*When the counting arrives at -9 or +9, it creates support and resistance ( SNR ) levels on the chart.
*It draws a pair of fast/slow average lines with pink/red colors for corresponding downtrend and yellow/green for uptrend.
*It shows a crossing point between fast/slow average line with a cream cross sign.
*It analyses and prints Up/Dn arrows base on each of these modes including time, price, average line turnings and crossing, above red/ below green (ARBG) candlesticks.
*It draws lines showing differences between price-fast average, price-slow average, and fast average-slow average.
*In addition, other auxiliary tools such as Max/Min finder used to find the candlesticks with local max/min prices or Gap finder used to locate discontinuity between candlesticks are also provided.
*For Forex trading, other intraday parameters are also available including the day opening level, high/low of previous days as well as intraday brown background marking overlapping sessions for Sydney-Tokyo, Tokyo-London and London-New York markets.
*Smart phone/tablet and PC notifications of events occurring in the chart can be sent to you by server-side alerts so that you don't have to stay in front of the screen all the time.
------------------------------
How to install the script:
------------------------------
*Go to the bottom of this page and click on "Add to Favorite Scripts".
*Remove older version of the script by clicking on the "X" button behind the indicator line at the top left corner of the chart window.
*Open a new chart at and click on the "Indicators" tab.
*Click on the "Favorites" tab and choose "ProfitBee59 v6.0".
*Right click anywhere on the graph, choose "Color Theme", the select "Dark".
*Right click anywhere on the graph, choose "Settings".
*In "Symbol" tab, set "Precision" to 1/100 for stock price or 1/100000 for Forex and set "Time Zone" to your local time.
*In "Scales" tab, check "Symbol Name Label" and "Indicator Last Value Label".
*In "Events" tab, check "Show Dividends on Chart", "Show Splits on Chart" and "Show Earnings on Chart".
*At the bottom of settings window, click on "Template", "Save As...", then name this theme of graph setting for future call up such as "Stock pb6" or "Forex pb6".
*Click OK.
==========================================
ProfitBee59 v6.0 for TradingView (pb6 ai) is locked and protected.
Please ***do not*** ask for access in the comment section.
Use the link below to obtain access to this indicator.
==========================================
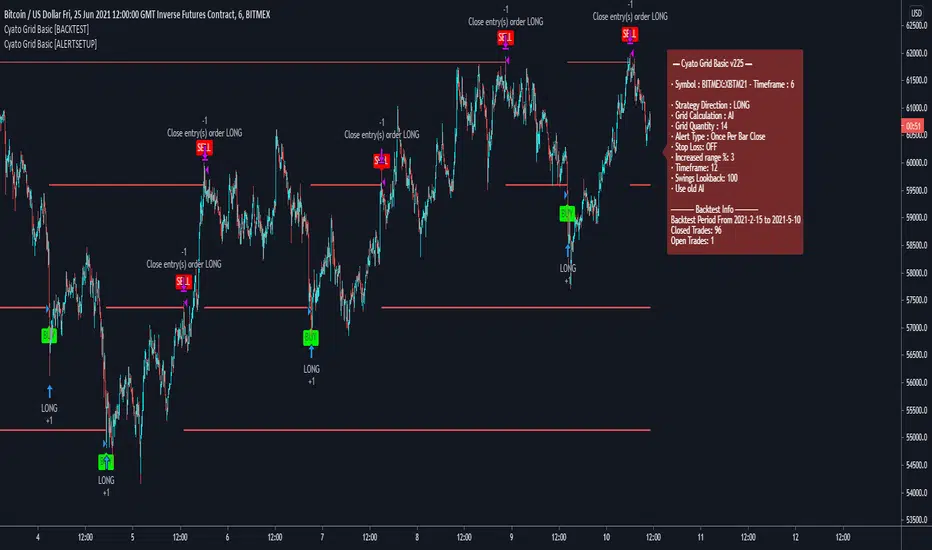
Cyato Grid Basic Buy & Sell [ALERTSETUP]Private indicator
This Grid bot strategy creates buy orders when the price goes down one level or more, and sell order when the price goes up one level or more.
To avoid useless trades, the lastest traded level is disabled until another level is crossed.
To create the grid, one upper level and one lower level is calculated. Those 2 levels are either given by the user using "MANUAL" mode or automatically calculated by an AI. The space between these two levels are then divided equally into several steps, creating the grid. The number of steps is choosen by the user, from 3 to 20.
How it Works
This is the Alert Setup version meaning this is the one you should use to create alerts (more below).
Select either "MANUAL" or "AI" mode.
When using "MANUAL", you have to configure an upper level and a lower level.
When using "AI", the upper and lower level are automatically calculated from last swing high/low.
Select the grid quantity, from 3 to 20.
Example with 3:
Example with 10:
Example with 20:
Creating the Alerts
When opening the alert popup, select "Cyato Grid" in the condition.
Make sure to use the option "Once per bar close" in order to stay in sync with the graphics on chart. (Only use "Once per bar" if you really know what you are doing).
Available alerts:
- BUY : Buy alert. Green label on chart.
- SELL: Sell alert. Red label on chart.
To get this indicator, use the link in my signature below, thanks!
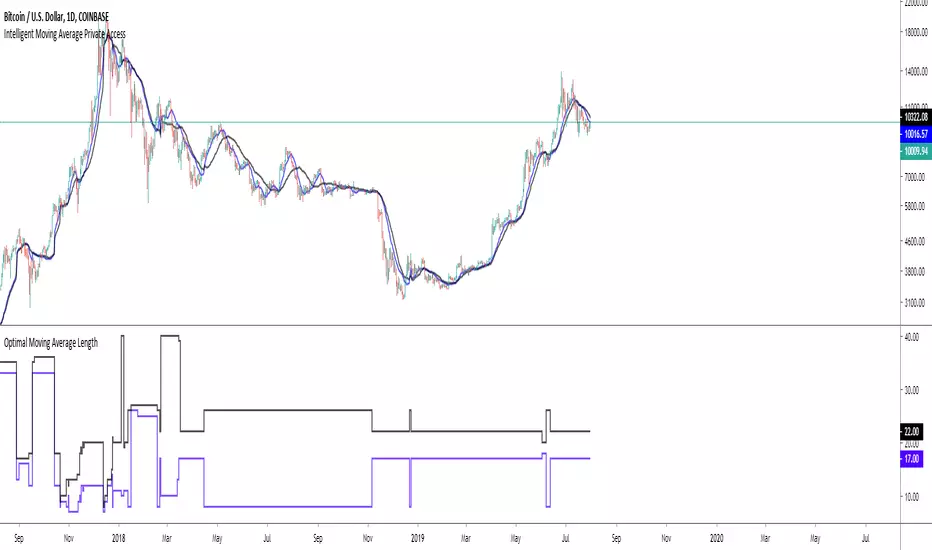
Intelligent Moving Average Private AccessNote: This indicator is intended for those who have been granted private access and may be more frequently updated than the previous versions.
Introduction
This indicator uses machine learning (Artificial Intelligence) to solve a real human problem.
The Moving Average is the most used indicator on the planet, yet no one really knows what pair of moving average lengths works best in combination with each other.
A reason for this is because no two moving averages are always going to be the best on every instrument, time-frame, and at any given point in time.
The " Intelligent Moving Average " solves the moving average problem by adapting the period length to match the most profitable combination of moving averages in real time.
How does the Intelligent Moving Average work?
The artificial intelligence that operates these moving average lengths was created by an algorithm that tests every single combination across the entire chart history of an instrument for maximum profitability in real-time.
No matter what happens, the combination of these moving averages will be the most profitable.
Can we learn from the Intelligent Moving Average?
There are many lessons to be learned from the Intelligent Moving Average. Most will come with time as it is still a new concept.
Adopting the usefulness of this AI will change how we perceive moving averages to work.
Limitations
Ultimately, there are no limiting factors within the range of combinations that has been programmed. The moving averages will operate normally, but may change lengths in unexpected ways - maybe it knows something we don't?
Thresholds
The range of moving average lengths is between 5 to 40.
Additional coverage resulted in TradingView server errors.
Future Updates!
This indicator will be maintained and many updates will come in the near future! Stay tuned.
View the documentation on this indicator here: www.kenzing.com
Well Rounded Moving AverageIntroduction
There are tons of filters, way to many, and some of them are redundant in the sense they produce the same results as others. The task to find an optimal filter is still a big challenge among technical analysis and engineering, a good filter is the Kalman filter who is one of the more precise filters out there. The optimal filter theorem state that : The optimal estimator has the form of a linear observer , this in short mean that an optimal filter must use measurements of the inputs and outputs, and this is what does the Kalman filter. I have tried myself to Kalman filters with more or less success as well as understanding optimality by studying Linear–quadratic–Gaussian control, i failed to get a complete understanding of those subjects but today i present a moving average filter (WRMA) constructed with all the knowledge i have in control theory and who aim to provide a very well response to market price, this mean low lag for fast decision timing and low overshoots for better precision.
Construction
An good filter must use information about its output, this is what exponential smoothing is about, simple exponential smoothing (EMA) is close to a simple moving average and can be defined as :
output = output(1) + α(input - output(1))
where α (alpha) is a smoothing constant, typically equal to 2/(Period+1) for the EMA.
This approach can be further developed by introducing more smoothing constants and output control (See double/triple exponential smoothing - alpha-beta filter) .
The moving average i propose will use only one smoothing constant, and is described as follow :
a = nz(a ) + alpha*nz(A )
b = nz(b ) + alpha*nz(B )
y = ema(a + b,p1)
A = src - y
B = src - ema(y,p2)
The filter is divided into two components a and b (more terms can add more control/effects if chosen well) , a adjust itself to the output error and is responsive while b is independent of the output and is mainly smoother, adding those components together create an output y , A is the output error and B is the error of an exponential moving average.
Comparison
There are a lot of low-lag filters out there, but the overshoots they induce in order to reduce lag is not a great effect. The first comparison is with a least square moving average, a moving average who fit a line in a price window of period length .
Lsma in blue and WRMA in red with both length = 100 . The lsma is a bit smoother but induce terrible overshoots
ZLMA in blue and WRMA in red with both length = 100 . The lag difference between each moving average is really low while VWRMA is way more precise.
Hull MA in blue and WRMA in red with both length = 100 . The Hull MA have similar overshoots than the LSMA.
Reduced overshoots moving average (ROMA) in blue and WRMA in red with both length = 100 . ROMA is an indicator i have made to reduce the overshoots of a LSMA, but at the end WRMA still reduce way more the overshoots while being smoother and having similar lag.
I have added a smoother version, just activate the extra smooth option in the indicator settings window. Here the result with length = 200 :
This result is a little bit similar to a 2 order Butterworth filter. Our filter have more overshoots which in this case could be useful to reduce the error with edges since other low pass filters tend to smooth their amplitude thus reducing edge estimation precision.
Conclusions
I have presented a well rounded filter in term of smoothness/stability and reactivity. Try to add more terms to have different results, you could maybe end up with interesting results, if its the case share them with the community :)
As for control theory i have seen neural networks integrated to Kalman flters which leaded to great accuracy, AI is everywhere and promise to be a game a changer in real time data smoothing. So i asked myself if it was possible for a neural networks to develop pinescript indicators, if yes then i could be replaced by AI ? Brrr how frightening.
Thanks for reading :)

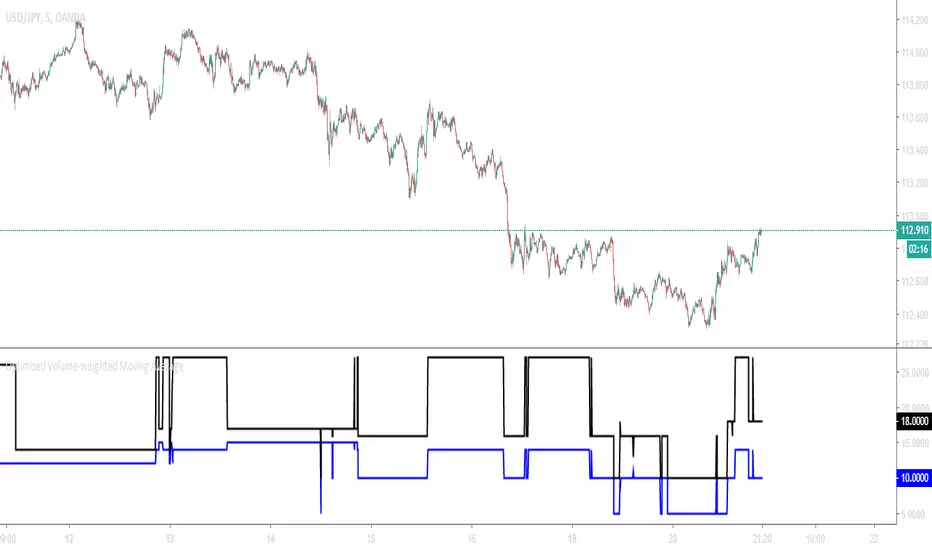
Optimised Volume-weighted Moving AverageAbout
This tool measures the profitability of every volume-weighted moving average length combination for the entire history of the instrument that it is applied,
and only displays the most profitable combination in real-time which means that this indicator is fully functional for trading.
The Optimised Volume-weighted Moving Average can be tested using a Volume-weighted Moving Average Strategy and the Strategy Tester panel on any instrument or time-stamp. It will always display the lengths of the most profitable exponential moving average lengths at the current moment in time.
This can be used on its own, or paired with the Intelligent Volume-weighted Moving Average (AI) for a better understanding of the indicators movements.
The Intelligent Volume-weighted Moving Average (AI) uses this tool as a predictive method for machine learning.
Optimised Exponential Moving AverageAbout
This tool measures the profitability of every exponential moving average length combination for the entire history of the instrument that it is applied and only displays the most profitable combination in real-time meaning that this indicator is fully functional for trading.
The Optimised Exponential Moving Average can be tested using an Exponential Moving Average strategy and the Strategy Tester panel on any instrument or time-stamp. It will always display the lengths of the most profitable exponential moving average lengths at the current moment in time.
This can be used on its own, or paired with the Intelligent Exponential Moving Average (AI) for a better understanding of the indicators movements.
The Intelligent Exponential Moving Average (AI) uses this tool as a predictive method for machine learning.

Marketscannerpros Auto Fib Tool MarketScanner Pros Auto Fib Tool intelligently detects swing highs and lows in real-time and plots fully dynamic Fibonacci retracement and extension levels.
It automatically flips between up-legs and down-legs, locks onto current swings when needed, and even highlights the Golden Pocket Zone for high-probability reversal areas.
Core Features
✅ Automatic Swing Detection (uses customizable left/right pivot bars)
✅ Lock Current Swing mode – freeze the active fib while analyzing other setups
✅ Dynamic Retracements & Extensions (0 – 161.8 %)
✅ Golden Pocket Highlight (0.618 – 0.65 range)
✅ Real-time Alerts when key levels are touched (38.2 %, 50 %, 61.8 %)
✅ Adaptive labeling shows leg direction and price levels
✅ Perfect for trend reversals, retracement entries, and confluence zones
How to Use
1️⃣ Adjust Pivot Left and Pivot Right to control how far back the tool looks for major swings.
2️⃣ Leave Lock Current Swing off for automatic updates – enable it to freeze the current leg.
3️⃣ Watch for alerts when price hits key fib levels or the Golden Pocket Zone.
4️⃣ Use confluence with RSI, MACD, and Trend lines for higher-probability setups.
About MarketScanner Pros
MarketScanner Pros delivers next-gen technical tools for traders who demand precision and clarity. From automated fib analysis to multi-time-frame scanners and AI-driven signal engines, our goal is to empower you with data-driven edge and visual clarity directly on your chart.
🌐 Visit app.marketscannerpros.app
for the full suite of tools and community access.

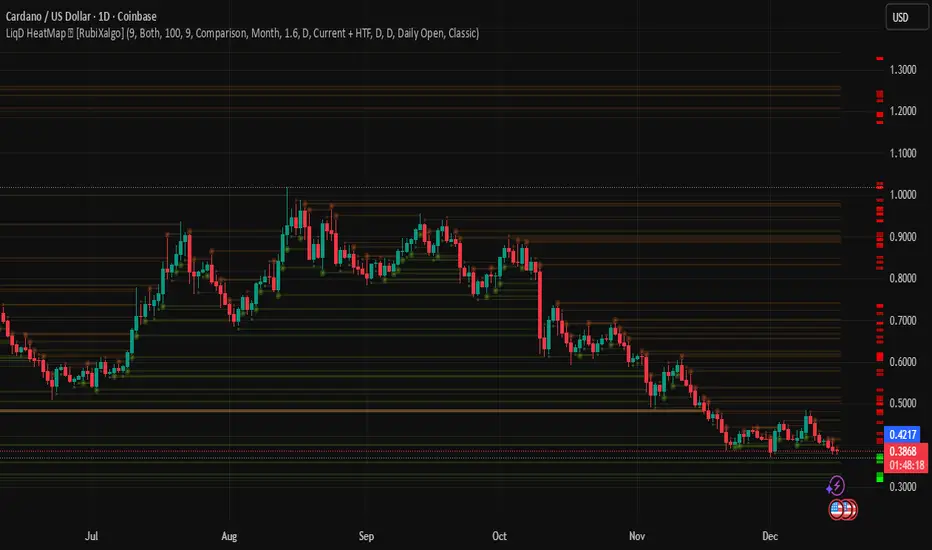
LiqD HeatMap [RubiXalgo]LiqD HeatMap 👑 – Advanced Liquidation & Liquidity Visualizer
Discover potential liquidation zones with this powerful AI-enhanced heatmap indicator. It visualizes high-volume liquidity pools where price may attract or reverse, using dynamic bubbles, horizontal levels, and gradient colors for intuitive signals.
Key Features:
• Liquidation Heatmap Bubbles — Circles plotted above/below bars indicate potential long/short liquidation clusters. Larger/darker bubbles highlight stronger volume-based zones.
• Multi-Timeframe Liquidity Levels — Horizontal lines from 30min to Monthly timeframes (thicker/brighter for higher TFs) mark key support/resistance where liquidations often occur.
• Dynamic Color Gradients — Green/teal for bullish bias, red/purple for bearish, yellow/orange for max-volume hotspots. Adjustable intensity for clearer signals.
• Additional Tools:
- Customizable VWAP with ATR bands for directional bias.
- A.I. Volume Profit-Trend polyline predictions.
- Stochastic Money Flow & Bollinger Band Width percentages.
- Daily 0.618 Fibonacci Range Expansion projections.
• Filters & Customization — Market bias (Long/Short/Both), leverage scaling, dynamic lookback, and color themes (Classic or Crypto).
How to Trade with It:
Long Signals: Look for dark green bubbles below price or price bouncing/breaking thick green MTF levels → strong bullish liquidation potential.
Short Signals: Dark red bubbles above price or breakdowns of thick red levels → bearish liquidation zones.
Yellow/orange highlights max-volume areas often acting as magnets or reversal points.
Perfect for crypto, forex, or futures traders seeking volume-driven edge without clutter. 👑 Powered by RubiXalgo logic.
Call-Put Cross Strike Match [Pro]📊 Call-Put Cross Strike Match - Professional Options Trading Indicator
Advanced NSE Options Analysis with AI-Powered Trading Signals & Dynamic Display
🎯 Overview
The Call-Put Cross Strike Match is an institutional-grade options analysis tool designed exclusively for NSE NIFTY and BANKNIFTY traders. Built on Pine Script v6, this indicator combines sophisticated cross-strike matching algorithms with intelligent trading signal generation to identify optimal options trading opportunities in real-time.
What makes it unique:
Analyzes 25 call-put combinations simultaneously
Generates actionable BUY/SELL signals using professional strategies
Fully customizable display with 9 table positions and 6 size options
Simplified setup with semi-automatic ATM detection
Clean, clutter-free interface with only essential information
Perfect for intraday scalpers, premium sellers, and positional options traders.
✨ Key Features
1. 🔍 Advanced Cross-Strike Matching Algorithm
The indicator calculates price differences for all 25 combinations (5 call strikes × 5 put strikes) and identifies the best matches based on put-call parity.
How it works:
Compares each call option price with every put option price
Calculates absolute difference: |Call - Put |
Ranks all 25 combinations from lowest to highest difference
Highlights top 3 or top 5 matches with visual checkmarks
Visual indicators:
✓✓ (Double check) = Best match (lowest price difference)
✓ (Single check) = Good matches (top 3 or top 5)
Empty cells = No match (significant price difference)
Why this matters:
When Call ≈ Put at same strike, it indicates fair pricing and synthetic position opportunities. The indicator automatically finds these opportunities across different strike combinations.
2. 🎯 Intelligent Trading Signals (Last Column)
The indicator generates professional trading recommendations based on Call-Put price difference analysis:
Signal Types:
BUY CE - Long call opportunity (bullish)
SELL CE - Short call opportunity (premium selling)
BUY PE - Long put opportunity (bearish/hedge)
SELL PE - Short put opportunity (premium selling)
BULL - Moderate bullish bias
BEAR - Moderate bearish bias
ATM - Neutral market (near parity)
NEUTRAL - No clear bias
Color-Coded for Quick Decisions:
🟩 Green = Long opportunities (BUY CE, BULL)
🟥 Red = Short call opportunities (SELL CE)
🟧 Orange = Long put opportunities (BUY PE)
🟫 Maroon = Short put opportunities (SELL PE)
⬛ Gray = Neutral zones (ATM, NEUTRAL)
3. 🤖 Three Professional Signal Modes
SMART Mode (Recommended) 🎯
Context-aware institutional strategy that considers strike position relative to spot price.
Signal Logic:
text
OTM Call Expensive (C-P > threshold, Strike > Spot):
→ SELL CE (Premium selling opportunity)
ITM Call Underpriced (C-P > threshold, Strike < Spot):
→ BUY CE (Synthetic long opportunity)
OTM Put Expensive (C-P < -threshold, Strike < Spot):
→ SELL PE (Premium selling opportunity)
ITM Put Underpriced (C-P < -threshold, Strike > Spot):
→ BUY PE (Protection or synthetic short)
Near Parity (|C-P| < threshold/4):
→ ATM (Neutral market, straddle/strangle zone)
Moderate Imbalance:
→ BULL or BEAR (Directional bias without extreme pricing)
Best for: Professional traders, option writers, synthetic position builders
MOMENTUM Mode 📈
Trend-following strategy that rides market momentum.
Signal Logic:
text
Calls Expensive (C-P > threshold):
→ BUY CE (Follow bullish momentum)
Puts Expensive (C-P < -threshold):
→ BUY PE (Follow bearish momentum)
Near Parity:
→ NEUTRAL (No clear trend)
Best for: Intraday scalpers, directional traders, swing traders
MEAN REVERSION Mode 🔄
Counter-trend strategy focused on premium selling.
Signal Logic:
text
Calls Overpriced (C-P > threshold):
→ SELL CE (Collect inflated premium)
Puts Overpriced (C-P < -threshold):
→ SELL PE (Collect inflated premium)
Near Parity:
→ ATM (Fair value, no edge)
Best for: Option writers, theta decay strategies, credit spread traders
4. 🎨 Fully Customizable Display
Dynamic Table Positioning (9 Options):
Top: left, center, right
Middle: left, center, right
Bottom: left, center, right
Choose position based on your chart layout and other indicators.
Dynamic Table Sizing (6 Options):
Auto - Adapts to content
Tiny - Minimal space (for cluttered charts)
Small - Default, best balance
Normal - Medium size (1080p monitors)
Large - Big text (4K monitors)
Huge - Maximum size (presentations)
Text scales intelligently:
Headers, data, and checkmarks adjust proportionally
Checkmarks remain visible even in tiny mode
Info row stays readable at all sizes
5. ⚙️ Simplified Input System
Auto Mode (Recommended):
Enter just 5 strikes once at market open - used for both calls and puts.
Example for NIFTY at 25,900:
text
Strike 1: 25850 (ATM - 100)
Strike 2: 25900 (ATM - 50)
Strike 3: 25950 (ATM)
Strike 4: 26000 (ATM + 50)
Strike 5: 26050 (ATM + 100)
Manual Mode (Advanced):
Enter separate call and put strikes for cross-strike arbitrage analysis.
Why this matters:
50% fewer inputs compared to traditional indicators
One-time setup at market open
Rarely needs updating (only if market moves 100+ points)
6. 🎛️ Semi-Automatic ATM Detection
The indicator automatically:
Detects current NIFTY/BANKNIFTY spot price
Calculates ATM strike (rounded to nearest 50 or 100)
Marks ATM strikes with *ATM in the table
Displays ATM and spot price in info box
No manual recalculation needed!
7. 📊 Clean Information Display
Main Table (Top/Middle/Bottom):
CE \ PE matrix showing all strike combinations
Checkmarks (✓✓ and ✓) highlighting best matches
SIGNAL column with color-coded trading recommendations
Best Match footer showing optimal combination
Info row displaying symbol, signal mode, and spot price
Info Box (Bottom Left):
Symbol (NIFTY/BANKNIFTY)
Signal Mode (Smart/Momentum/Mean Reversion)
Current Spot Price
Detected ATM Strike
Best Matched Call Strike
Best Matched Put Strike
Match Difference
C-P value for best match
📋 Quick Setup Guide (3 Steps)
Step 1: Add Indicator
Open NIFTY or BANKNIFTY chart on TradingView
Add "Call-Put Cross Strike Match " from indicators
Step 2: Configure Basic Settings
text
Symbol Detection: Auto (reads from chart)
Expiry Date: 251219 (format: YYMMDD for 19-Dec-2025)
Strike Mode: Auto
Strike Interval: 50 (for NIFTY) or 100 (for BANKNIFTY)
Step 3: Enter Strikes
At market open (9:15 AM), check current price and enter 5 strikes:
text
Example: NIFTY at 25,937
Strike 1: 25850 (ATM - 100)
Strike 2: 25900 (ATM - 50)
Strike 3: 25950 (ATM) ← Rounded to nearest 50
Strike 4: 26000 (ATM + 50)
Strike 5: 26050 (ATM + 100)
That's it! The indicator handles everything else automatically.
💡 Real-World Use Cases
1. 📉 Premium Selling (Mean Reversion Mode)
Scenario: Looking for overpriced options to write
How to use:
Set Signal Mode to "Mean Reversion"
Set Threshold: 30 (NIFTY) or 75 (BANKNIFTY)
Look for SELL CE or SELL PE signals with ✓ or ✓✓
Sell naked options or credit spreads at those strikes
Target 30-50% profit or 3-5 days theta decay
Perfect for: Credit spreads, iron condors, covered calls, naked puts
2. 📈 Directional Trading (Momentum Mode)
Scenario: Scalping intraday moves
How to use:
Set Signal Mode to "Momentum"
Set Threshold: 15 (aggressive) or 25 (conservative)
BUY CE signal + ✓✓ = Long call entry
Enter with tight stop (20% of premium)
Target 30-50% gain within 1-2 hours
Perfect for: Intraday scalping, swing trading, trend following
3. 🔄 Synthetic Positions (Smart Mode)
Scenario: Building synthetic long/short with defined risk
How to use:
Set Signal Mode to "Smart"
Look for BUY CE at ITM strike + SELL PE at OTM strike
Both should have ✓ indicator (good parity)
Creates synthetic long position
Lower capital than buying futures
Perfect for: Professional traders, arbitrage, capital efficiency
4. ⚖️ ATM Strategy Optimization (Smart Mode)
Scenario: Finding optimal strikes for straddle/strangle
How to use:
Identify strike marked *ATM
Check if signal shows ATM (balanced market)
If BULL/BEAR → Market has directional bias, adjust accordingly
✓✓ indicates best matched strike for neutral strategies
Perfect for: Volatility trading, earnings plays, event trading
5. 🛡️ Hedging Optimization (Smart Mode)
Scenario: Protecting long equity positions
How to use:
Look for BUY PE signals (protection signals)
Avoid strikes with SELL PE (expensive hedges)
✓✓ shows best value for hedge entry
Optimize hedge timing and strike selection
Perfect for: Portfolio hedging, risk management, protective puts
⚙️ Settings Guide
Symbol Settings
Symbol Detection: Auto (recommended) or Manual
Manual Symbol: NIFTY or BANKNIFTY
Expiry Date: Format YYMMDD (e.g., 251219 = 19-Dec-2025)
Update every Thursday after 3:30 PM for next week's expiry
Strike Settings
Strike Mode: Auto (recommended) or Manual
Strike Interval:
50 for NIFTY
100 for BANKNIFTY
Trading Signals
Signal Mode: Smart / Momentum / Mean Reversion
Smart: Professional institutional strategy (default)
Momentum: Trend-following for scalpers
Mean Reversion: Premium selling for writers
Signal Threshold: Sensitivity in points
NIFTY Recommendations:
Conservative: 30-40 points (fewer, higher quality signals)
Balanced: 20-25 points (default)
Aggressive: 10-15 points (more signals, more noise)
BANKNIFTY Recommendations:
Conservative: 75-100 points
Balanced: 50-60 points (default)
Aggressive: 30-40 points
Algorithm Settings
Matching Mode:
Top 3: Shows 3 best matches (cleaner display)
Top 5: Shows 5 best matches (more opportunities)
Display Settings
Show Matching Table: Enable/disable main table
Table Position: Choose from 9 positions
top_right (default) - Doesn't block price action
middle_right - Centered vertical view
bottom_right - If top is crowded
Table Size: Choose from 6 sizes
small (default) - Best for most users
normal - For 1080p/4K monitors
tiny - If you have many indicators
📊 Understanding The Table
Table Layout Example:
text
CE \ PE | 25950 | 25900 | 25850 | 26000 | 26050 | SIGNAL
---------|-------|-------|-------|-------|-------|--------
25850 | | | | | | SELL PE
25900*ATM| | ✓ | | | | ATM
25950 | ✓✓ | | | | | BULL
26000 | | | | ✓ | | BUY CE
26050 | | | | | | SELL CE
---------|-------|-------|-------|-------|-------|--------
Best Match: 25950 / 25950 (0.25)
Info: NIFTY | Smart | Spot:25881.9
Reading the Table:
Rows (Left): Call option strike prices
Columns (Top): Put option strike prices
Cells: Checkmarks where Call ≈ Put
✓✓: Best match (minimum price difference)
✓: Good matches (top 3 or 5)
Empty: Prices too different (no match)
*ATM: Automatically detected at-the-money strike
SIGNAL Column: Actionable trading recommendation for each call strike
Info Box Metrics:
Symbol: Currently analyzed index
Signal Mode: Active strategy
Spot: Current underlying price
ATM: Calculated at-the-money strike
Best Call: Matched call strike
Best Put: Matched put strike
Match Diff: Price difference (lower = better)
C-P (Best): Call minus Put for best match
📈 Best Practices
Strike Selection & Maintenance
At Market Open (9:15 AM):
Check current price (e.g., NIFTY at 25,937)
Round to nearest interval (25,950 for 50 interval)
Enter 5 strikes: -100, -50, 0, +50, +100 from ATM
Update Frequency:
Usually no update needed entire day
Update only if market moves 100+ points from initial ATM
Typically 0-2 updates per trading session
Signal Interpretation by Confidence Level
High Confidence (✓✓ + Signal):
Best match indicator present
Strongest signal quality
Highest probability setup
Medium Confidence (✓ + Signal):
Good match present
Reliable signal
Acceptable risk/reward
Low Confidence (Signal without ✓):
No match indicator
Strike far from parity
Requires additional confirmation
Risk Management Rules
Never trade signals blindly. Always:
✅ Confirm with price action and support/resistance
✅ Check overall market trend (NIFTY/BANKNIFTY direction)
✅ Consider time decay (theta) for your position
✅ Monitor IV changes (implied volatility)
✅ Use proper position sizing (1-2% risk per trade)
✅ Set stop losses (20-30% of premium for longs)
✅ Have profit targets (30-50% for scalps)
Timeframe Selection
Intraday Trading:
Use 5-minute or 15-minute chart
Momentum or Smart mode
Lower threshold (aggressive)
Quick entries and exits
Positional Trading:
Use hourly or daily chart
Smart or Mean Reversion mode
Higher threshold (conservative)
Swing trade positions
Combining with Other Tools
Recommended complements:
Support/resistance levels (horizontal lines)
Trend indicators (EMA 20/50, SuperTrend)
Volume analysis (confirm breakouts)
India VIX (volatility context)
Option chain data (open interest)
🎓 Strategy Examples
Strategy 1: Professional Premium Selling
text
Mode: Mean Reversion
Threshold: 30 (NIFTY) / 75 (BANKNIFTY)
Timeframe: Daily
Rules:
1. Wait for SELL CE or SELL PE signal
2. Verify strike has ✓ or ✓✓ (good parity)
3. Check if OTM (Strike away from spot)
4. Sell option or create credit spread
5. Target: 30-50% profit or 3-5 days theta
6. Stop: If signal changes to BUY
Position: Naked short or credit spreads
Risk: Define with spreads or capital allocation
Strategy 2: Intraday Momentum Scalping
text
Mode: Momentum
Threshold: 15 (aggressive)
Timeframe: 5-minute
Rules:
1. Wait for BUY CE signal + ✓✓
2. Enter long call immediately
3. Stop loss: 20% of premium paid
4. Target 1: 30% gain (partial exit)
5. Target 2: 50% gain (full exit)
6. Exit if signal changes or 2 hours pass
Position: Long calls or long puts only
Risk: 1-2% of capital per trade
Strategy 3: Synthetic Long Position
text
Mode: Smart
Threshold: 25 (NIFTY) / 60 (BANKNIFTY)
Timeframe: Hourly
Rules:
1. Identify BUY CE signal at ITM strike
2. Identify SELL PE signal at OTM strike
3. Both should have ✓ indicator
4. Buy ITM call + Sell OTM put = Synthetic Long
5. Lower capital than futures
6. Defined risk (width of strikes)
Position: Call debit + Put credit
Risk: Net debit paid (defined risk)
Strategy 4: ATM Straddle Entry
text
Mode: Smart
Threshold: 20 (default)
Timeframe: Daily
Rules:
1. Find strike marked *ATM
2. Check signal shows "ATM" (neutral)
3. Verify ✓✓ at that strike
4. Sell ATM call + Sell ATM put
5. Collect maximum premium
6. Exit at 30% profit or before expiry
Position: Short straddle or iron condor
Risk: Use defined risk (iron condor recommended)
🔔 Important Notes
Data Accuracy
Indicator uses TradingView's NSE options data feed
Always verify prices independently before trading
Ensure market is open (9:15 AM - 3:30 PM IST)
Check for "-" in cells indicating missing data
Expiry Management
Update expiry date every week on Thursday post-closing
Format: YYMMDD (6 digits)
Weekly expiry: Every Thursday
Monthly expiry: Last Thursday of month
Strike Format
NIFTY: Multiples of 50 (25850, 25900, 25950...)
BANKNIFTY: Multiples of 100 (51800, 51900, 52000...)
Wrong strikes = No data in table
Performance Optimization
Indicator updates every bar close
No lag or performance issues
Works on all timeframes (1m to 1D)
Maximum 5 calls + 5 puts = 10 security calls (within limits)
⚠️ Disclaimer
Trading options involves substantial risk of loss and is not suitable for all investors. This indicator is provided for educational and informational purposes only. It does not constitute financial advice, investment advice, or trading advice.
Important disclaimers:
Options can expire worthless, resulting in 100% loss
Past performance of signals is not indicative of future results
Accuracy depends on TradingView's NSE data feed
Signals are mathematical analysis, not predictions
You are solely responsible for your trading decisions
The developer is not liable for any trading losses incurred while using this indicator.
Before trading, ensure you understand:
Options Greeks (Delta, Gamma, Theta, Vega, Rho)
Implied volatility and its impact
Time decay and expiration risks
Assignment risk for short positions
Liquidity and slippage considerations
Margin requirements and capital needs
Always:
Use proper risk management (1-2% per trade)
Trade with capital you can afford to lose
Paper trade before live trading
Consult with a licensed financial advisor
Start with small position sizes
Never risk more than you can afford to lose
📊 Technical Specifications
Platform: TradingView Pine Script v6
Exchanges: NSE (National Stock Exchange of India)
Instruments: NIFTY, BANKNIFTY options
Timeframes: All (1m, 5m, 15m, 1h, 1D)
Strikes Analyzed: 5 calls × 5 puts = 25 combinations
Security Calls: 10 (5 calls + 5 puts)
Table Positions: 9 (all corners and centers)
Table Sizes: 6 (auto to huge)
Signal Modes: 3 (Smart, Momentum, Mean Reversion)
Performance: Optimized, minimal lag
🎯 Who Should Use This?
✅ Perfect For:
Options Traders: Intraday and positional
Premium Sellers: Option writers and theta strategists
Arbitrage Traders: Synthetic position builders
Straddle/Strangle Traders: ATM strategy traders
Professional Traders: Institutional-grade analysis
Volatility Traders: IV imbalance exploiters
Scalpers: Quick intraday moves
❌ Not Suitable For:
Stock options traders (NSE index-specific)
Equity-only traders (requires options knowledge)
International markets (NSE format only)
Complete beginners (requires basic options understanding)
💬 FAQ
Q: Why manual strike entry? Why not fully automatic?
A: Pine Script's type system limits fully automatic strike generation from live data. However, setup takes just 30 seconds once at market open, and the indicator handles all analysis automatically throughout the day.
Q: How often should I update strikes?
A: Rarely! Only when market moves 100+ points from initial ATM. Usually 0-2 times per day, even in volatile markets.
Q: Which Signal Mode is best?
A: Smart mode (default) for professional trading. Use Momentum for intraday scalping, Mean Reversion for premium selling.
Q: Can I use this for stock options?
A: No. The indicator is designed specifically for NSE index options (NIFTY and BANKNIFTY) with NSE format.
Q: Does it work on mobile?
A: Yes, but table display is optimized for desktop/tablet screens. Use "tiny" or "small" size on mobile.
Q: What if I see "-" in cells?
A: Check expiry format (YYMMDD), verify strikes match NSE strikes, and ensure market is open.
Q: What's the difference between ✓✓ and ✓?
A: ✓✓ = Best match (lowest price difference), highest quality. ✓ = Good matches (top 3-5), reliable quality.
Q: Can I backtest this indicator?
A: The indicator shows live analysis. For backtesting options strategies, you'll need historical options data and separate backtesting tools.
Q: What does the info box show?
A: Bottom-left box shows key metrics: symbol, signal mode, spot price, ATM strike, best matched strikes, match difference, and C-P value.
Q: Why no chart plotting?
A: v1.0 focuses on clean table display with maximum information density. Chart plotting may be added in future versions based on user feedback.
🙏 Credits
Developed by a professional options trader for the Indian trading community. Inspired by institutional trading desks and market makers who use call-put parity for daily trading decisions.
Found This Helpful?
⭐ Rate 5 stars if it improved your trading
💬 Comment with your strategy results
🔔 Follow for updates and new indicators
📢 Share with fellow options traders
Feature Requests
Continuous improvement based on trader feedback. Suggest features in comments!
Planned Features (v2.0):
Multi-expiry comparison
Greeks display (Delta, Theta, Vega)
Historical signal performance stats
Custom signal formulas
Export to CSV functionality
🏷️ Tags for Search
#Options #OptionsTrading #NIFTY #BANKNIFTY #NSE #India #OptionChain #CallPut #PutCallParity #Straddle #Strangle #ATM #TradingSignals #OptionsStrategy #PremiumSelling #OptionsScanner #Derivatives #IntradayTrading #VolatilityTrading #Arbitrage #SyntheticPosition #OptionsGreeks #OptionsSelling #OptionsWriting #IndianStockMarket #NSEOptions #OptionsAnalysis #TechnicalAnalysis #AlgoTrading #QuantTrading #ProfessionalTrading #TradingIndicator #PineScript #TradingView
📝 Version History
v1.0 (Current - Dec 2025)
Pine Script v6 implementation
Cross-strike matching (5×5 matrix, 25 combinations)
Three signal modes (Smart, Momentum, Mean Reversion)
Trading signal generation with color coding
Dynamic table positioning (9 positions)
Dynamic table sizing (6 sizes)
Intelligent text scaling
Semi-automatic ATM detection
Auto symbol detection
Simplified input system (50% fewer inputs in Auto mode)
Clean information display
Info box with key metrics
NSE NIFTY & BANKNIFTY support
Start trading smarter with institutional-grade options analysis! 📈💰🚀
Disclaimer: Options trading is subject to market risk. Please read all scheme-related documents carefully before investing.

Chartology Strategy+🔍 Chartology Strategy+
This tool provides a comprehensive way for users to analyze trend levels and access other Matrix features across selected tickers and timeframes. Results can be tailored by strategy, with the option to filter displayed tickers based on custom user‑defined rules.
Bullish & Bearish Entry Signal (Safe & Scalping).
Entry Level, SL, T-SL & Two TP Levels (Based on Possible Movement).
Dashboard Table for Easy Presentation of All Levels.
Timeframe Scanner for Current Signal (Trend) on Different Timeframes.
Gap Up & Gap Down for Untraded Price Marking.
Institutional Candles for High Volume and Big Price Movement.
Neutral Candle for Low Volume and Small Price Movement.
Supply Demand (Based on Swing High & Low).
Mega Trend Band (Based on HMA) for Overall Trend.
🟢 Bullish & Bearish Entry Signals
Shows the expected direction of the symbol. It shows Bullish and Bearish direction mark on Chart. Entry Level is Closing of the Candle.
Input Settings
Signal Type: Safe
Appears after a proper trend confirmation.
Low frequency, fewer signals, but more reliable.
Best for swing traders who want strong confirmation before entering.
Signal Type: Scalping
Appears frequently during small downward moves.
High frequency, quick signals for short-term trades.
Best for intraday
Traders who want multiple opportunities in small movements.
🎯 Entry Level, SL, T-SL & TP Levels
Generated based on price movement and trend range.
Levels on Chart
Entry Level: Closing price of the candle where the signal appears.
SL (Stop Loss): Maximum risk allowed for the trade.
TSL (Trailing SL): Dynamic SL to reduce risk and lock profits.
Level 01: First TP level with 1:1 risk-reward ratio. Used for partial booking.
Level 02: Final TP level for full exit.
Input Settings
Levels: You can Increase or Decrease Level Amount for the Level 2.
Risk: You can Increase or Decrease Stop Loss (SL).
📊 Dashboard Table for Easy Presentation of All Levels.
Displays all key levels and metrics in one place:
Metrics
Symbol Name Shows the name of the current chart (e.g., NIFTY, BANKNIFTY).
Bar Age Displays the How many candles (Bars) before Latest signal appears.
Entry Shows the entry level where the latest bullish or bearish signal was generated.
Level 1 (TP1) First target level, based on 1:1 risk-reward ratio. Used for partial booking to secure profits.
Level 2 (TP2) Final target level where you can exit the remaining position.
SL (Stop Loss) Shows the maximum risk limit for the trade. Helps you control losses.
MTM (Mark to Market) Shows the difference between CMP and Entry Level. Helps track how far price has moved since entry.
P&L (Profit & Loss) Shows the difference between Entry and Target Level achieved. Helps measure actual gain or loss.
Date & Time Displays when the latest bullish or bearish signal was generated. Helps check how old or fresh the signal is.
Timeframe Scanner or Current Signal (Trend) on Different Timeframes. Shows the current signal across multiple timeframes.
Row 1 Fixed signals for 1M and 3M.
Row 2 Any 2 Custom Timeframes chosen in input settings.
Traders use this to confirm signals across different timeframes before entering trades. Example If the Day trend is bullish but the 15M chart shows bearish, many traders avoid that trade.
🚦 Gap Up & Gap Down for Untraded Price Marking.
Marks untraded price zones where price may react.
Gap Up & Down Flag Mark
Gap Up: Bullish Bias, Marked Green flag, plotted when candle opens above previous high.
Gap Down: Bearish Bias, Marked as Red flag, plotted when candle opens below previous low.
Input Settings
Enable / Disable from Chart
Threshold: Minimum gap size Threshold to detect
🟡 Institutional Candles for High Volume and Big Price Movement
Indicate strong price movement with high volume.
Marking
Displayed as Yellow Body Candles
Helps identify zones where big players are active.
Input Settings
Enable / Disable from Chart
Body %: Compare of Open & Close with High & Low
Size %: Compare Total Candle Size from Past Range
Volume %: Compare Total Candle Volume from Past Range
⚪ Neutral Candle for Low Volume and Small Price Movement
Shows low volume and minimal price movement.
Marking
Displayed as Hollow Body Candles
Traders usually avoid trading during these candles.
Input Settings
Enable / Disable from Chart.
Candle %: Compare Size of candles.
Volume %: Compare Volume of Candles from Previous Range.
🟥🟩 Supply Demand Zones (Based on Swing High & Low).
Based on swing highs and lows to identify possible reversals.
Zones
🟥Supply Zone: Near swing high, marked with Light Red Zone.
🟩Demand Zone: Near swing low, marked with Light Green Zone.
Input Settings:
Bars Left: How many past Bars Swing will Calculate.
Bars Right: After How many Bars, Zone will plot.
Max Zones: Number of Supply or Demand Zone want to plot on Chart
Delete Breaked Zones: Want to see Disappeared Zone, Uncheck it.
Extend Right: Want to see till End of the Chart, Uncheck it.
📈 Mega Trend Band (Based on HMA) for Overall Trend
Based on HMA (Hull Moving Average) to show overall trend and Help in Filters out trades against the main trend.
Working
Price above band → Bullish trend
Price below band → Bearish trend
Input Setting
Enable / Disable from Chart
HMA Period Setting: 45
👓 How to Use All together for Better Confidence.
🔍Watch for the New Entry icon on the chart.
Find New Signals with help of Automated Alerts.
Check Entry Level, SL, Level 1 and Level 2 (TP2).
Verify Date & Time → how fresh the signal is. Signal not too old.
🧭 Signal is not Self Sufficient for Good Accuracy. So, we suggest a few rules.
Cross‑Check Current Signal with Timeframe Scanner. Trade only when smaller timeframe aligns with bigger trend. (e.g., If Day = Bullish ▲ but 15M = Bearish ▼, avoid entry. Trend may not be stronger.)
Validate with Market Context of Gap. (e.g., If new signal came on Gap Up / Gap Down, avoid entry. Price may reverse.)
Zone Awareness Use Supply Demand zones to refine entries/exits and avoid false signals. (e.g., Entry: If any zone is available between Entry and Level 01, Avoid trade until Zone breaked, Exit: If Zone create between the trade, modify SL according to T-SL and wait.
Trend Filter of overall direction. (e.g., If Mega Trend Band Bullish and Trend is Bearish, Avoid the Trade.)
🕵🏻 Quick Checklist Before Trade
Bullish or Bearish signal?
Dashboard Table shows fresh entry?
SL defined and acceptable risk?
Timeframe Scanner aligned?
No Neutral candle interference?
Institutional candle or Gap supports move?
Supply/Demand zone not against trade?
✅ All Okay - Go for the ENTRY
Set a Proper Entry Point
Always respect SL, Good Trader Never avoid it.
Book partial profits at Level 1, It secure your Trade.
Keep Modifying your SL, According to T-SL Level.
On Level 2, Exit remaining All position for full profit.
📊 Healthy Trading Tips
Risk Small: Never risk more than 1–2% per trade.
Size Smart: Adjust position size to volatility and account size.
Diversify: Don’t put all money in one asset/sector.
Plan Ahead: Set entry, exit, and stop‑loss before trading.
Trade Less: Focus on quality setups, avoid overtrading.
Use Both Analyses: Combine technical charts with fundamental news/events.
Control Emotions: Stick to strategy, avoid fear/greed.
Journal Trades: Record reasons, outcomes, and lessons.
Stay Informed: Track economic calendars and global events.
Take Breaks: Step away after wins/losses to reset.
🎯 Advanced Discipline
Partial Exit: Book profits in stages (e.g., 50% at 1:1, 50% at Final Level).
Check News: Avoid trading during major announcements.
No Tweaks: Don’t change plan mid‑trade; wait for SL/TP.
Fixed Rules: Trade with fixed risk, fixed gains.
No Averaging Losses: Close bad trades, don’t add more.
Keep Learning: Evolve strategy with market changes.
Believe: Trust your plan and process.
Backtest: Practice setups until they’re second nature.
Daily Routine: Pre‑market Preparation, post‑market review.
Optimize Setup: Clean workspace, fast platform, no distractions.
Track Metrics: Win rate, average reward, expectancy, time of day, setup performance.
Trader Identity: Follow rules; money is a byproduct.
Liquidity Check: Avoid low‑volume instruments.
Respect Trend: Trade with momentum, not against it.
Avoid Over‑Leverage: Keep leverage low, avoid margin unless planned.
Risk Disclaimer
This content, including any tools, software, datafeeds, indicators, or scanners, is provided strictly for charting, educational, informational, and paper‑trading purposes only. It does not constitute investment advice, buy/sell recommendations, or real‑money trading strategies.
Not Advisors: We are not registered as investment advisors or research analysts.
Charting Only: Use is limited to testing strategies and evaluation; any application to real trading is at the user’s sole risk.
No Liability: No liability is accepted for financial loss, trading loss, or damages arising from use of the tools or data.
Data Limitations: Market data may be delayed, inaccurate, or incomplete. Past or hypothetical performance is not indicative of future results.
Signals Disclaimer: Automated signals are for evaluation only and should not be treated as accurate or real trading instructions.
High Risk: Trading and investing involve substantial risk and can result in losses beyond the initial capital.
Independent Judgment: Users must exercise independent judgment and consult licensed professionals before making financial decisions
⚠️ Final Note: Trading is speculative and may not be suitable for all investors. Use only risk capital and never invest money you cannot afford to lose.
✅ Always remember🧠 my 3R Rule💡: If the money💰 is yours then, RISK⚖️, REWARD🏆 and REGRET😔 are solely yours. 🔥

VIX Term Structure Pro [v7.0 Enhanced]# VIX Term Structure Pro v7.0
[! (img.shields.io)](www.tradingview.com)
[! (img.shields.io)](www.tradingview.com)
[! (img.shields.io)](LICENSE)
**Professional VIX-based Market Sentiment & Timing Indicator**
专业的 VIX 市场情绪与择时指标
---
## 🌟 Overview / 概述
VIX Term Structure Pro is an advanced multi-factor market timing indicator that analyzes the VIX futures term structure, volatility regime, and market breadth to generate actionable buy/sell signals.
VIX Term Structure Pro 是一款高级多因子市场择时指标,通过分析 VIX 期货期限结构、波动率区间及市场广度,生成可操作的买卖信号。
---
## 🚀 Key Features / 核心功能
### 📊 Multi-Factor Scoring System / 多因子评分系统
- **Term Structure Z-Score**: Measures deviation from historical mean / 期限结构 Z 分数:衡量与历史均值的偏离
- **VIX/VX1 Basis**: Spot premium detection for panic signals / VIX 现货溢价:恐慌信号检测
- **Contango Analysis**: Futures curve shape insights / 期货升水分析
- **SKEW Integration**: Options skew for tail risk / SKEW 整合:尾部风险监测
- **Put/Call Ratio**: Sentiment extremes / 看跌/看涨比率:情绪极端
- **VVIX Support**: Volatility of volatility (optional) / VVIX 支持:波动率的波动率
### 🎯 Three-Tier Signal System / 三级信号系统
| Signal | Score | Description |
|--------|-------|-------------|
| 🚨 **CRASH BUY** | ≥ 6 | Extreme panic, rare opportunity / 极端恐慌,罕见机会 |
| 🟢 **STRONG BUY** | ≥ 5 | Multi-factor confluence / 多因子共振 |
| 🟡 **BUY DIP** | ≥ 4 | Accumulate on weakness / 逢低吸纳 |
| 🟠 **SELL/HEDGE** | ≤ -2 | Consider reducing risk / 考虑减仓对冲 |
| 🔴 **STRONG SELL** | ≤ -5 | Strong bearish signals / 强烈看跌信号 |
| 🔥 **EUPHORIA SELL** | ≤ -6 | Extreme greed, sell signal / 极度贪婪,卖出信号 |
### 📈 Dashboard Indicators / 仪表盘指标解读
| Indicator | Bullish 🟢 | Bearish 🔴 |
|-----------|------------|------------|
| Overall Bias | STRONG BUY / BUY DIP | STRONG SELL / SELL/HEDGE |
| AI Score | ≥ 5 (Extreme Fear) | ≤ -5 (Extreme Greed) |
| Market Trend | 🟢SPX 🟢NDX (Above MA200) | 🔴SPX 🔴NDX (Below MA200) |
| VIX Regime | LOW VOL (<15) | HIGH VOL (>25) |
| Term Struct Z | < -2.0 (Panic) | > 2.0 (Complacency) |
---
## ⚙️ Configuration / 配置选项
### 📡 Data Sources / 数据源
- **VIX Symbol**: Default `CBOE:VIX` (Alternative: `TVC:VIX`)
- **Put/Call Ratio**: Default `INDEX:CPCI` (Index P/C)
- **Timeframe**: Daily (stable) or Chart (real-time)
### ⚠️ Strategy Mode / 策略模式
- **High (Scalping)**: Sensitive, for short-term trades / 高敏感,短线
- **Normal (Swing)**: Balanced approach / 平衡模式
- **Low (Trend/Safe)**: Conservative, trend-following / 保守,趋势跟踪
### 🔬 Backtest Mode / 回测模式
- **OFF (Real-time)**: Shows current day data, suitable for live monitoring / 显示当日数据,适合实盘监控
- **ON (Historical)**: Uses only confirmed data, avoids look-ahead bias / 仅使用已确认数据,避免未来函数
---
## 📖 Usage Guide / 使用指南
### Best Practices / 最佳实践
1. **Apply to SPX/SPY/QQQ daily charts** for optimal signal accuracy
在 SPX/SPY/QQQ 日线图上使用,信号准确度最佳
2. **Wait for next trading day** to execute signals (signals trigger on daily close)
信号触发后在下一交易日执行(信号基于日线收盘)
3. **Use in conjunction with price action** for confirmation
结合价格走势确认信号
4. **Enable Market Trend Filter** (MA200) for safer entries in uncertain markets
开启趋势过滤(MA200)以在不确定市场中更安全入场
### Signal Interpretation / 信号解读
```
🚨 CRASH BUY (Score ≥ 6)
→ Rare extreme panic event
→ Historical average return: significant positive over 2 months
→ Consider aggressive positioning
🟢 STRONG BUY (Score ≥ 5)
→ Multiple indicators align
→ Historical average return: positive over 1 month
→ Consider building positions
🟡 BUY DIP (Score ≥ 4)
→ Moderate fear detected
→ Suitable for adding to existing positions
→ Filtered out in bear markets if Trend Filter is ON
```
---
## 📊 Historical Statistics / 历史统计
The indicator tracks signal frequency and average subsequent returns:
- **CRASH BUY**: 40-day return period (~2 months)
- **STRONG BUY**: 20-day return period (~1 month)
- **BUY DIP**: 10-day return period (~2 weeks)
指标追踪信号频率和后续平均收益,可在仪表盘中查看历史统计。
---
## 🔔 Alerts / 警报
Built-in alert conditions with cooldown mechanism to prevent spam:
| Alert | Condition |
|-------|-----------|
| Crash Buy Alert | Score ≥ 6, extreme panic |
| Strong Buy Alert | Score ≥ 5, multi-factor confluence |
| Buy Dip Alert | Score ≥ threshold |
| Euphoria Sell Alert | Score ≤ -6, extreme greed |
| Strong Sell Alert | Score ≤ -5 |
| VIX Basis Panic | VIX spot premium spike |
---
## 📋 Changelog / 更新日志
### v7.0 (Current)
- ✨ Three-tier buy/sell signal system
- 📊 Signal statistics with average return tracking
- 🔬 Backtest Mode toggle for historical testing
- 🎨 Configurable ±1 Z-Score reference lines
- ⚡ Modular scoring functions
- 🛡️ Dual index trend display (SPX + NDX)
- 📱 Compact & Full dashboard modes
---
## ⚠️ Disclaimer / 免责声明
**English:**
This indicator is for educational and informational purposes only. It does not constitute financial advice. Past performance does not guarantee future results. Always do your own research and consider your risk tolerance before trading.
**中文:**
本指标仅供教育和信息参考,不构成投资建议。过往表现不代表未来收益。交易前请自行研究并评估风险承受能力。
---
## 📄 License / 许可证
MIT License - Feel free to use, modify, and share.
---
## 🤝 Contributing / 贡献
Issues and pull requests are welcome!
欢迎提交问题和贡献代码!
---
**Made with ❤️ for the trading community**
**为交易社区用心打造**

Ultimate Adaptive RSIUltimate Adaptive RSI
RSI That Adapts to Any Market
This isn't your grandpa's RSI. It dynamically adjusts its sensitivity based on market conditions—smoother in trends, responsive in ranges.
Traditional RSI fails in strong trends and changing volatility. UA-RSI fixes both by adapting its sensitivity in real-time, giving you reliable signals whether the market is trending, ranging, or transitioning between regimes.
How It Adapts:
Smart Pre-Smoothing: Uses Efficiency Ratio to detect trend strength and automatically lengthens/shortens its smoothing window.
Dominant Cycle Detection: Matches its internal period to the market's actual rhythm.
Dynamic Bands: RMS-based overbought/oversold levels that expand/contract with volatility.
Smoothing Stack: ALMA pre-smoothing → Ultimate Smoother → Jurik filter creates the cleanest RSI you've ever seen.
Trade Signals:
Buy: RSI crosses above lower band or midline + price confirms
Sell: RSI crosses below upper band or midline + price confirms
Bands expand in high volatility → wait for deeper extremes
Bands contract in low volatility → take earlier signals
Signal line for crossover entries
Adaptive smoothing = fewer false signals in trends
Day trading: Use 1.0 band multiplier
Swing trading: Use 1.2-1.5 multiplier
Ranging markets: Lower multiplier to 0.8
Trending markets: Raise multiplier to 1.5+
Bands widen in volatility = wait for deeper extremes
Bands tighten in calm markets = take earlier signals
Never trade RSI alone - always wait for price confirmation

online Moment-Based Adaptive Detection🙏🏻 oMBAD (online Moment-Based Adaptive Detection): adaptive anomaly || outlier || novelty detection, higher-order standardized moments; at O(1) time complexity
For TradingView users: this entity would truly unleash its true potential for you ‘only’ if you work with tick-based & seconds-based resolutions, otherwise I recommend to keep using original non-online MBAD . Otherwise it may only help with a much faster backtesting & strategy development processes.
...
Main features :
O(1) time complexity: the whole method works @ O(1) time complexity, it’s lighting fast and cheap
HFT-ready: frequency, amount and magnitude of data points are irrelevant
Axiomatic: no need to optimize or to provide arbitrary hyperparameters, adaptive thresholds are completely data-driven and based on combination of higher-order central moments
Accepts weights: the method can gain additional information by accepting weights (e.g. volume weighting)
Example use cases for high-frequency trading:
Ordeflow analysis: can be applied on non-aggregated flow of market orders to gauge its imbalance and momentum
Liquidity provision: can be applied to high-resolution || tick data to place and dynamically adjust prices of limit orders
ML-based signals: online estimates of higher-order central moments can be used as features & in further feature engineering for trading signal generation
Operation & control: can be applied on PnL stream of your strategy for immediate returns analysis and equity control
Abstract:
This method is the online version of originally O(n) MBAD (Moment-Based Adaptive Detection) . It uses higher-order central & standardized moments to naturally estimate data’s extremums using all data while not touching order-statistics (i.e. current min and max) at all. By the same principles it also estimates “ever-possible” values given the data-generating process stays the same.
This online version achieves reduced time complexity to O(1) by using weighted exponential smoothing, and in particular is based on Pebay et al (2008) work, which provides mathematically correct results for the moments, and is numerically stable, unlike the raw sum-based estimates of moments.
Additionally, I provide adjustments for non-continuous lattice geometry of orderbooks, and correct re-quantization math, allowing to artificially increase the native tick size.
The guidelines of how to adjust alpha (smoothing parameter of exponential smoothing) in order to completely match certain types of moving averages, or to minimize errors with ones when it’s impossible to match; are also provided.
Mathematical correctness of the realization was verified experimentally by observing the exact match with the original non-recursive MBAD in expanding window mode, and confirmed by 2 AI agents independently. Both weighted and non-weighted versions were tested successfully.
...
^^ On micro level with moving window size 1
^^ With artificial tick size increase, moving window size 64
^^ Expanding window mode anchored to session start
^^ Demonstrates numerical stability even on very large inputs
...
∞

🐋 MACRO POSITION TRADER - Quarterly Alignment 💎Disclaimer: This tool is an alignment filter and educational resource, not financial advice. Backtest and use proper risk management. Past performance does not guarantee future returns.
so the idea behind this one came from an experience i had when i first started learning how to trade. dont laugh at me but i was the guy to buy into those stupid AI get rich quick schemes or the first person to buy the "golden indicator" just to find out that it was a scam. Its also to help traders place trades they can hold for months with high confidence and not have to sit in front of charts all day, and to also scale up quickly with small accounts confidently. and basically what it does is gives an alert once the 3 mo the 6 mo and the 12 mo tfs all align with eachother and gives the option to toggle on or off the 1 mo tf as well for extra confidence. Enter on the 5M–15M after a sweep + CHOCH in the direction of the aligned 1M–12M bias. that simple just continue to keep watching key levels mabey take profit 1-2 weeks and jump back in scaling up if desired..easy way to combine any small account size.
Perfect balance of:
low risk
high R:R
optimal precision
minimal chop
best sweep/CHOCH clarity
hope you guys enjoy this one.

EMA Crossover CandlesEMA Crossover Candles
This indicator colors your chart candles based on the relationship between two Exponential Moving Averages (EMAs).
How It Works
Green Candles - When the Fast EMA is above the Slow EMA, indicating bullish momentum
Red Candles - When the Fast EMA is below the Slow EMA, indicating bearish momentum
Settings
Source - The price data used for EMA calculations (default: close)
Fast Length - Period for the fast EMA (default: 5)
Slow Length - Period for the slow EMA (default: 10)
How To Use
This indicator provides a quick visual reference for trend direction. Green candles suggest the short-term trend is bullish, while red candles suggest bearish conditions. This can help you:
Identify trend direction at a glance
Filter trades in the direction of the trend
Spot potential trend changes when candle colors shift
Tips
Adjust the Fast and Slow Length settings to match your trading timeframe
Shorter periods = more responsive but more false signals
Longer periods = smoother but slower to react to trend changes
Consider hiding default candles in Chart Settings for a cleaner look
Note: This indicator is for informational purposes only and should not be used as the sole basis for trading decisions. Always use proper risk management and consider combining with other forms of analysis.
Feel free to modify this to match your style or add any additional details you'd like to include.Claude is AI and can make mistakes. Please double-check responses. Opus 4.5

SM Screener — Alert Engine (Tiered)🔥 Momentum Radar — Powered by My Premium All-In-One Signal Engine
This isn’t just another screener.
This is the official early-warning radar that plugs directly into my Premium All-In-One Buy/Sell Signal Tool.
The Premium version is where the real executions happen — the legitimate Buy and Sell signals, trend flips, squeeze confirmations, BOS/CHOCH tracking, and high-accuracy momentum logic.
But this?
This is the scanner that tells you where to look BEFORE the big move happens.
If the Premium tool is the weapon…
this screener is the radar locking onto targets.
🚀 What It Actually Does
It monitors every ticker on your chart and fires alerts the moment a symbol starts showing:
✔ Early momentum ignition
✔ Rising relative volume
✔ Trend pressure shifting
✔ Volatility expansion
✔ Early squeeze build-up
✔ Clustered signal behavior
✔ High-tier conviction score
These alerts tell you exactly which tickers to pull up in your Premium tool so you can inspect the chart deeper with full confirmation.
If you're serious about catching explosive moves, this combo is unreal.
💥 Designed for Traders Who Want the Monster Moves
This system is built for the same plays that create legends — the massive momentum runners and wild squeezes like the $4 → $400+ SMX eruption.
The goal is simple:
**Find the move early.
Confirm it with the Premium tool.
Then ride it with confidence.**
⚡ Alert Engine That Feels Like Insider Info
Every alert is laser-targeted:
🔥 Early Interest — tells you something is heating up
🔥 Entry Signal — means the ticker is firing on all cylinders
🔥 Volume bursts
🔥 Momentum flips
🔥 High conviction score
🔥 Trend strength alignment
You get notified instantly so you never miss the tickers entering “potential explosion mode.”
Perfect for:
→ Custom automation
→ Watchlist building
📈 A Complete Momentum Ecosystem
This isn’t a standalone indicator — it’s part of a full ecosystem:
1️⃣ The Premium All-In-One Tool (master)
→ Generates true Buy/Sell signals
→ Full trend model
→ Squeeze engine
→ Premium/discount logic
→ Volume & volatility confirmation
→ BOS/CHOCH structure tracking
2️⃣ THIS Screener Engine (scanner)
→ Alerts you which tickers deserve attention
→ Filters out noise
→ Points you to the potential runners
→ Helps you never miss the early setups
Together, they’re unreal.
⭐ Follow for More
This is only one piece of a growing suite of professional-grade tools I’m publishing.
If you want:
🔥 More scanners
🔥 Predictive momentum engines
🔥 AI-grade alert logic
🔥 My official Premium trading toolkit
Hit Follow — new releases drop frequently.
Trade smart.
Trade fast.
And catch the ones everyone else regrets missing.

Swing Aurora v7.0 — The ExecutionerSwing Aurora v7.0 — The Executioner
Swing Aurora v7.0 is a multi-engine swing trading framework that combines trend-following, momentum, HTF confluence and SMC/Fibonacci structure in one script.
This version moves from a rigid gate logic to a scoring + state machine engine, so you can see not only if there is a signal, but how strong that signal really is.
🧠 1. Scoring Engine – A-Grade & B-Grade Signals
Instead of a single if (all conditions == true) check, v7.0 builds a score on every bar:
Trend score – position vs Baseline, slope, Supertrend direction.
Momentum score – MACD, RSI-Stoch triggers, ADX, local HH/LL.
HTF score – alignment with higher timeframe Baseline, Bias EMA, EMAs and RSI.
Confluence flags – divergences, ST flip/retest, SMC zones, VDub context.
Results:
A-Grade (Strong) signals → high score, strong trend + momentum + HTF alignment.
B-Grade (Speculative) signals → early/partial setups, clearly marked as higher risk.
You no longer lose good entries just because one minor filter disagrees, but you can clearly distinguish high-quality setups from speculative ones.
🔁 2. Strict Trade Cycle – State Machine
v7.0 uses a simple state machine:
0 = Flat, 1 = Long, -1 = Short.
When you are Long, the script only looks for exits or reversals, not new BUY entries.
Same for Short.
This enforces a clean, disciplined flow:
BUY → Hold → EXIT → wait for next setup, without label spam or conflicting signals while already in a position.
🛡️ 3. Quality Gates & Anti-FOMO Filters
To avoid buying local tops or chopping yourself to death:
RSI Gate – blocks BUY when RSI is already overbought (and vice-versa for SELL).
ATR Over-Extension filter – no entries when price is too far from the Baseline (parabolic moves).
No-Trade / Chop zone – combines ADX, ATR vs ATR-slow, distance to Baseline, Bollinger/Keltner squeeze and volume behavior.
Volume Gate – requires a real volume spike, not just random price wiggle.
Supertrend Gate – entries are synchronized with ST (flip / early / retest — configurable).
HTF Guardrails – optional: blocks entries against the dominant HTF regime.
📈 4. Visual Layer: Trend Map, Labels & Gradient
BUY/SELL labels with confidence percentage.
Background gradient based on trend direction and strength (ADX).
EMA 13/21 + Baseline with dynamic bull/bear colors.
Optional mini-legend showing: TS / RSI / ADX / HTF status at a glance.
🧩 5. Divergences, VDub & Macro Map
Full divergence engine (classic + hidden) on a basket of indicators (RSI, MACD, CCI, OBV, etc.), with optional lines and count labels.
VDub levels & signals – “smart levels” (solid/dotted) and add-on BUY/SELL signals filtered by market regime.
HTF Macro Map – higher timeframe Baseline, Bias EMA, fast EMAs, RSI and slope, using an auto or user-selected higher TF.
🧱 6. SMC Zones & Fibonacci (v7.0 Logic)
The SMC / Fibo component was refined so it is not hard-wired to the current bar’s entry signal:
Automatic HH / HL / LH / LL market structure labelling.
Demand / Supply zones:
derived from BOS with ATR buffer,
auto-update bar-by-bar,
auto-delete when broken or after a user-defined lifetime.
Fibonacci range:
built from the latest valid swing-high / swing-low,
shows 0 / 0.382 / 0.5 / 0.618 / 1 / 1.618 levels plus equilibrium line,
persists while the range is valid (independent of being in a trade).
AI zone boost (v7.0) – optional: zone opacity adapts dynamically to the underlying confidence score, highlighting higher-quality areas.
⚙️ 7. Modes & Configuration
Modes: Aggressive / Balanced / Conservative – adjust score thresholds and confidence requirements.
Risk & Quality: slope filter, min ATR distance, strict anti-chop, volume gate, HTF guardrails.
Visual toggles: labels on/off, baseline & EMAs, gradient, mini-legend, SMC boxes, Fibonacci.
This script does not trade for you – it provides a structured, consistent framework for reading trend, momentum and structure, plus graded signals so you can execute your own risk management and strategy.
Disclaimer
This script is provided strictly for educational and research purposes. It does not constitute financial advice, investment recommendation or any guarantee of profit. Historical performance, backtests and chart examples do not ensure future results.
Always use your own risk management rules, test the script on multiple instruments and timeframes, and never trade with money you cannot afford to lose. The author and contributors accept no responsibility for any trading decisions made based on this indicator.
