SQZMOM + ADX
ENGLISH:
SQUEEZE MOMENTUM INDICATOR
The Squeeze Momentum Indicator is a momentum oscillator that indicates the explosiveness with which the price is going to move. Its first known version was called "TTM Squeeze" by John Carter explained in his book "Mastering the Trade" (chapter 11). and popularized on TradingView by a developer named LazyBear.
The black crosses in the middle line show that the market has just entered a consolidation. This means low volatility, the market is preparing for an explosive move (up or down). The gray crosses signify the "Squeeze". Carter suggests waiting until the first gray after a black cross and taking a position in the direction of the oscillator. For its part, LazyBear recommends using an additional indicator such as ADX to enhance the effectiveness of the points of entry and closing of positions.
IMPROVEMENTS IN UNDERSTANDING THE OSCILLATOR:
During the indicator creation process we were able to understand the oscillator logic in greater depth, and based on this knowledge we implemented improvements.
IMPROVEMENTS IN THE DEVELOPMENT OF THE OSCILLATOR:
SIDE PANEL:
• The ADX algorithm was incorporated, which is displayed numerically in the right panel of the indicator, it shows the value of the ADX and its directionality.
• An arrow type pointer was added to indicate the Directionality of the Oscillator.
• Two Exponential Moving Averages of 11 and 55 periods were added to the right panel, this will mark if the trend is bullish or bearish depending on the crossing of the EMAs.
• An indicator of the Squeeze of the indicator was also included, which marks the periods of consolidation of the price (OFF) and the periods where the price should react explosively.
• Added a function that allows the automatic color change of the panels based on the color of the oscillator and the ADX.
o ADX: Dark Green (Bullish Force).
o ADX: Light Green (Loss of bullish strength).
o ADX: Dark Red (Bearish Force).
o ADX: Light Red (Loss of bearish strength).
o ADX: Orange (Lost strength, Disinterest and low volume).
SIGNALS:
A very famous strategy that we have learned is that of the trading expert Jaime Merino, who by combining the Squeeze Momentum Indicator and a common ADX, managed to efficiently link the weakness of the ADX with the beginning of a bullish or bearish momentum. The parameterization of its strategy was signaled in buy and sell alerts, which are represented as follows:
B (Buy): It is activated when a bearish movement marked by the ADX (Negative Slope) ends and the oscillator takes bullish directionality (Bullish impulse).
S (Sell): It is activated when an upward movement marked by the ADX (Negative Slope) ends and the oscillator takes bearish directionality. (Bearish momentum).
FILTER:
In order to prevent any trader from trading against the trend, a filter was added that limits the alerts for bearish entries when the trend is up and vice versa, that is, when the EMA 10 is above the EMA55, it is understood that the trend is bullish in that time frame, therefore the bearish entry alerts will not be activated. It will be the decision of each trader whether to activate or deactivate this function.
ALERTS:
This is undoubtedly the most anticipated function by all Latin American traders, (Just kidding), but being aware, I am very proud of the implementation of alerts for each improvement made to this indicator, if you decide to use the Squeeze Momentum Indicator you can automate alerts for the following actions:
• Buy and Sell alerts.
• Alerts for activating the Squeeze to (ON).
• Oscillator quadrant change alerts
o Bullish momentum.
o Bearish momentum.
o Bullish force.
o Bearish force.
RECOMMENDATIONS:
One of the things that became clearer to us in the development of this indicator is the coloring of the quadrants, which is why we recommend the use of four colors, one for each oscillator grid.
ESPAÑOL:
El Squeeze Momentum Indicator es oscilador de momentum que nos indica la explosividad con que el precio se va a mover. Su primera versión conocida se llamo “TTM Squeeze” de John Carter explica en su libro "Mastering the Trade" (capítulo 11). y popularizada en TradingView por un desarrollador llamado LazyBear.
Las cruces negras en la línea media muestran que el mercado acaba de entrar en una consolidación. Esto significa baja volatilidad, el mercado se prepara para un movimiento explosivo (hacia arriba o hacia abajo). Las cruces grises significan el "Squeeze“. Carter sugiere esperar hasta el primer gris después de una cruz negra y tomar una posición en la dirección del oscilador. Por su parte LazyBear recomienda usar un indicador adicional como ADX para potenciar la efectividad de los puntos de entrada y cierre de las posiciones.
CUADRANTE DE IMPULSO: Los cuadrantes de impulso poseen el doble de potencia de los cuadrantes de fuerza, esto se debe a que su misión es cambiar la dirección del oscilador para generar las Ondas.
CUADRANTE DE FUERZA:
Los cuadrantes de fuerza poseen el menos de potencia que los cuadrantes de impulso, podríamos decir que este cuadrante representa la perdida en la fuerza del movimiento.
LOS COLORES:
Particularmente recomiendo usar la configuracion de colores que se presentan en la imagen anterior, ya que brinda mas coherencia en la realizacion del movimiento alcista y bajista.
IMPULSO ALCISTA: El oscilador se tiene pendiente POSITIVA y se encuentra por debajo del punto 0.
FUERZA ALCISTA: El oscilador se tiene pendiente POSITIVA y se encuentra por encima del punto 0.
IMPULSO BAJISTA: El oscilador se tiene pendiente NEGATIVA y se encuentra por encima del punto 0.
FUERZA BAJISTA: El oscilador se tiene pendiente NEGATIVA y se encuentra por debajo del punto 0.
MEJORAS EN LA COMPRENSIÓN DEL OSCILADOR:
Durante el proceso de creación del indicador pudimos comprender la logica del oscilador con mayor profundidad, y con base en este conocimiento implementamos mejoras
MEJORAS EN EL DESARROLLO DEL OSCILADOR:
PANEL LATERAL:
• Se incorporó el algoritmo del ADX el cual se visualiza en forma numérica en el panel derecho del indicador, el mismo muestra el valor del ADX y la direccionalidad de este.
• Se incorporó un señalador de tipo flecha que indica la Direccionalidad del Oscilador.
• Se añadió dos Medias móviles Exponenciales de 11 y 55 periodos al panel derecho, éste marcará si la tendencia es alcista o bajista en función a al cruce de las EMAs.
• También se incluyó un señalador del Squeeze del indicador, el cual marca los periodos de consolidación del precio (OFF) y los periodos donde el precio debería reaccionar de forma explosiva.
• Se añadió una función que permite el cambio de color automático de los paneles en función al color del oscilador y el ADX.
o ADX: Verde Oscuro (Fuerza alcista).
o ADX: Verde Claro (Perdida de fuerza alcista).
o ADX: Rojo Oscuro (Fuerza bajista).
o ADX: Rojo Claro (Perdida fuerza bajista).
o ADX: Naranja (Perdida fuerza, Desinterés y bajo volumen).
SEÑALES:
Una estrategia muy famosa que hemos aprendido es la del experto en trading Jaime Merino, quien combinando el Squeeze Momentum Indicator y un ADX comùn, logró relacionar de forma eficiente la debilidad del ADX con el comienzo de un impulso ALCISTA o BAJISTA. La parametrización de su estrategia fue señalizada en alertas de compra y venta, las cuales se representan de la siguiente manera:
B (Buy): Se activa cuando termina un movimiento bajista marcado por el ADX (Pendiente Negativa) y el oscilador toma Direccionalidad alcista (Impulso alcista).
S (Sell): Se activa cuando termina un movimiento alcista marcado por el ADX (Pendiente Negativa) y el oscilador toma Direccionalidad bajista. (Impulso bajista).
FILTRO:
Con la intención de evitar que ningún trader opere en contra de la tendencia, se añadió un filtro que limita las alertas entradas bajistas cuando la tendencia es alcista y viceversa, es decir, cuando la EMA 10 está por encima de la EMA55, se entiende que la tendencia es alcista en esa temporalidad, por lo cual las alertas de entradas bajistas no se activaran. Será decisión de cada trader si activa o desactiva esta función.
ALERTAS:
Esta sin duda es la función más esperada por todos los traders de Latinoamérica, (Es broma), pero siendo consientes, me siento muy orgulloso de la implementación de alertas para cada mejora realizada a este indicador, si decide usar el Squeeze Momentum Indicator podrá automatizar las alertas para las siguientes acciones:
• Alertas de Buy y Sell.
• Alertas para la activación del Squeeze a (ON).
• Alertas de cambios de cuadrantes del oscilador
o Impulso alcista.
o Impulso bajista.
o Fuerza alcista.
o Fuerza bajista.
RECOMENDACIONES:
Una de las cosas que nos quedó más claras en el desarrollo de este indicador, es la coloración de los cuadrantes, es por ellos que recomendamos el empleo de cuatro colores, uno para cada cuadricula del oscilador.
스크립트에서 "LazyBear"에 대해 찾기

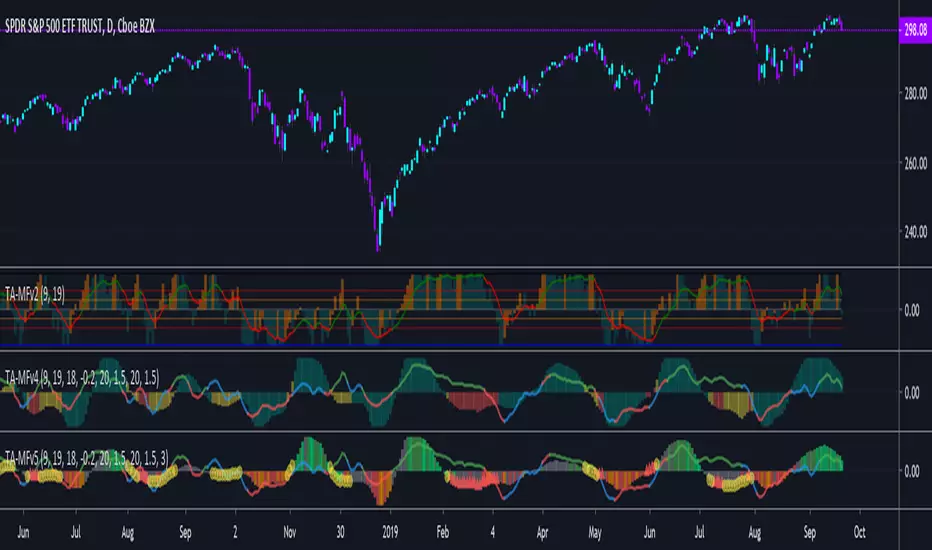
TA-Money Flow-Version5This is the MACD of a stochastic OBV movement indicator, Squeeze Momentum Indicator, and addition coloring for Market Direction Indicator . It is good (right) to work with both price and volume.
In this version we've moved the divergence highlighting to symbols at the ends of the histograms. Same coloring scheme as previous, yellow is divergence of either OBV or SQZ , red is both divergence. In the previous version we added in the "squeeze on - blue" highlighting to show follow through of divergence (or just squeeze/stall). We also added in another old script, but colors so well, Lazybears (Market Direction Indicator, linked below). Also incorporated a 3 color or 5 color scheme from the MDI script as a bool. It works great on any time frame, but you need to have volume data. Not sure where I originally got this (stoch-OBV, somewhere off Tradingview several years ago, thanks to the person who shared), Squeeze/MDI is Lazybear, links below.
Enjoy.
Version 5:
Moved divergence highlighting to symbols on histogram
Added coloring based on MDI
TA-Money-Flow-Version4
TA-Money-Flow-Version3
TA-Money-Flow-Version2
Squeeze-Momentum-Indicator-LazyBear
Market-Direction-Indicator-LazyBear
Democratic MultiAsset Strategy [BerlinCode42]Happy Trade,
Intro
Included Trade Concept
Included Indicators and Compare-Functions
Usage and Example
Settings Menu
Declaration for Tradingview House Rules on Script Publishing
Disclaimer
Conclusion
1. Intro
This is the first multi-asset strategy available on TradingView—a market breadth multi-asset trading strategy with integrated webhooks, backtesting capabilities, and essential strategy components like Take Profit, Stop Loss, Trailing, Hedging, Time & Session Filters, and Alerts.
How It Trades? At the start of each new bar, one asset from a set of eight is selected to go long or short. As long there is available cash and the selected asset meets the minimum criteria.
The selection process works through a voting system, similar to a democracy. Each asset is evaluated using up to five indicators that the user can choose. The asset with the highest overall voting score is picked for the trade. If no asset meets all criteria, no trade is executed, and the cash reserve remains untouched for future opportunities.
How to Set Up This Market Breadth Strategy:
Choose eight assets from the same market (e.g., cryptos or big tech stocks).
Select one to five indicators for the voting system.
Refine the strategy by adjusting Take Profit, Stop Loss, Hedging, Trailing, and Filters.
2. Voting as the included Trade Concept
The world of financial trading is filled with both risks and opportunities, and the key challenge is to identify the right opportunities, manage risks, and do both right on time.
There are countless indicators designed to spot opportunities and filter out risks, but no indicator is perfect—they only work statistically, hitting the right signals more often than the wrong ones.
The goal of this strategy is to increase the accuracy of these Indicators by:
Supervising a larger number of assets
Filtering out less promising opportunities
This is achieved through a voting system that compares indicator values across eight different assets. It doesn't just compare long trades—it also evaluates long vs. short positions to identify the most promising trade.
Why focus on one asset class? While you can randomly select assets from different asset classes, doing so prevents the algorithm from identifying the strongest asset within a single class. Think about, within one asset class there is often a major trend whereby different asset classes has not really such behavior.
And, you don’t necessarily need trading in multiple classes—this algorithm is designed to generate profits in both bullish and bearish markets. So when ever an asset class rise or fall the voting system ensure to jump on the strongest asset. So this focusing on one asset class is an integral part of this strategy. This all leads to more stable and robust trading results compared to handling each asset separately.
3. Included Indicators and Compare-Functions
You can choose from 17 different indicators, each offering different types of signals:
Some provide a directional signal
Some offer a simple on/off signal
Some provide both
Available Indicators: RSI, Stochastic RSI, MFI, Price, Volume, Volume Oscillator, Pressure, Bilson Gann Trend, Confluence, TDI, SMA, EMA, WMA, HMA, VWAP, ZLMA, T3MA
However, these indicators alone do not generate trade signals. To do so, they must be compared with thresholds or other indicators using specific comparison functions.
Example – RSI as a Trade Signal. The RSI provides a value between 0 and 100. A common interpretation is:
RSI over 80 → Signal to go short or exit a long trade
RSI under 20 → Signal to go long or exit a short trade
Here, two comparison functions and two thresholds are used to determine trade signals.
Below is the full set of available comparison functions, where: I represents the indicator’s value and A represents the comparator’s value.
I < A if I smaller A then trade signal
I > A if I bigger A then trade signal
I = A if I equal to A then trade signal
I != A if I not equal to A then trade signal
A <> B if I bigger A and I smaller B then trade signal
A >< B if I smaller A then long trade signal or if I bigger B then short trade signal
Image 1
In Image 1, you can see one of five input sections, where you define an indicator along with its function, comparator, and constants. For our RSI example, we select:
Indicator: RSI
Function: >< (greater/less than)
Comparator: Constant
Constants: A = 20, B = 80
With these settings a go short signal is triggered when RSI crosses above 80. And a go long signal is triggered when RSI crosses below 20.
Relative Strength Indicator: The RSI from the public TradingView library provides a directional trade signal. You can adjust the price source and period length in the indicator settings.
Stochastic Relative Strength Indicator: As above the Stoch RSI offers a trade signal with direction. It is calculated out of the RSI, the stochastic derivation and the SMA from the Tradingview library. You can set the in-going price source and the period length for the RSI, for the Stochastic Derivation and for the SMA as blurring in the Indicator settings section.
Money Flow Indicator: As above the MFI from the public Tradingview library offers a trade signal with direction. You can set the in-going price source and the period length in the Indicator settings section.
Price: The Price as Indicator is as simple as it can be. You can chose Open, High, Low or Close or combinations of them like HLC3 or even you can import an external Indicator. The absolute price or value can later be used to generate a trade signals when certain constant thresholds or other indicators signals are crossed.
Volume: Similar as above the Volume as Indicator offers the average volume as absolute value. You can set the period length for the smoothing and you can chose where it is presented in the base currency $ or is the other. For example the trade pair BTCUSD you can chose to present the value in $ or in BTC.
Volume Oscillator: The Volume Oscillator Indicator offers a value in the range of . Whereby a value close to 0 means that the volume is very low. A value around 1 means the volume is same high as before and Values higher as 1 means the volume is bigger then before. You can set the period length for the smoothing and you can chose where it is presented in the base currency $ or is the other. For example the trade pair BTCUSD you can chose to present the value in $ or in BTC.
Pressure Indicator: The Pressure is an adapted version of LazyBear's script (Squeeze Momentum Indicator) Pressure is a Filter that highlight bars before a bigger price move in any direction. The result are integer numbers between 0 and 4 whereby 0 means no bigger price move excepted, while 4 means huge price move expected. You can set the in-going price source and the period length in the Indicator settings section.
Bilson Gann Trend: The Bilson Gann Trend Indicator is a specific re-implementation of the widely known Bilson Gann Count Algorithm to detect Highs and Lows. On base of the last four Highs and Lows a trend direction can be calculated. It is based on 2 rules to confirm a local pivot candidate. When a local pivot candidate is confirmed, let it be a High then it looks for Lows to confirm. The result range is whereby -1 means down trend, 1 means uptrend and 0 sideways.
Confluence: The Confluence Indicator is a simplified version of Dale Legan's "Confluence" indicator written by Gary Fritz. It uses five SMAs with different periods lengths. Whereby the faster SMA get compared with the (slower) SMA with the next higher period lengths. Is the faster SMA smaller then the slower SMA then -1, otherwise +1. This is done with all SMAs and the final sum range between . Whereby values around 0 means price is going side way, Crossing under 0 means trend change from bull to bear. Is the value>2 means a strong bull trend and <-2 a strong bear trend.
Trades Dynamic Index: The TDI is an adapted version from the "Traders Dynamic Index" of LazyBear. The range of the result is whereby 2 means Top goShort, -2 means Bottom goLong, 0 is neutral, 1 is up trend, -1 is down trend.
Simple Moving Average: The SMA is the one from the Tradingview library. You can compare it with the last close price or any other moving average indicator to indicate up and down trends. You can set the in-going price source and the period length in the Indicator settings section.
Exponential Moving Average: The EMA as above is the one from the Tradingview library. You can compare it with the last close price or any other moving average indicator to indicate up and down trends. You can set the in-going price source and the period length in the Indicator settings section.
Weighted Moving Average: The WMA as above is the one from the Tradingview library. You can compare it with the last close price or any other moving average indicator to indicate up and down trends. You can set the in-going price source and the period length in the Indicator settings section.
Hull Moving Average: HMA as above is the one from the Tradingview library. You can compare it with the last close price or any other moving average indicator to indicate up and down trends. You can set the in-going price source and the period length in the Indicator settings section.
Volume Weighted Average Price: The VWAP as above is the one from the Tradingview library. You can compare it with the last close price or any other moving average indicator to indicate up and down trends. You can set the in-going price source in the Indicator settings section.
Zero Lag Moving Average: The ZLMA by John Ehlers and Ric Way describe in their paper: www.mesasoftware.com
As the other moving averages you can compare it with the last close price or any other moving average indicator to indicate up and down trends. You can set the in-going price source and the period length in the Indicator settings section.
T3 Moving Average: The T3MA is the one from the Tradingview library. You can compare it with the last close price or any other moving average indicator to indicate up and down trends. You can set the in-going price source, the period length and a factor in the Indicator settings section. Keep this factor at 1 and the T3MA swing in the same range as the input. Bigger 1 and it swings over. Factors close to 0 and the T3MA becomes a center line.
All MA's following the price. The function to compare any MA Indicators would be < or > to generate a trade direction. An example follows in the next section.
4. Example and Usage
In this section, you see how to set up the strategy using a simple example. This example was intentionally chosen at random and has not undergone any iterations to refine the trade results.
We use the RSI as the trade signal indicator and apply a filter using a combination of two moving averages (MAs). The faster MA is an EMA, while the slower MA is an SMA. By comparing these two MAs, we determine a trend direction. If the faster MA is above the slower MA the trend is upwards etc. This trend direction can then be used for filtering trades.
The strategy follows these rules:
If the RSI is below 20, a buy signal is generated.
If the RSI is above 80, a sell signal is generated.
However, this RSI trade signal is filtered so that a trade is only given the maximum voting weight if the RSI trade direction aligns with the trend direction determined by the MA filter.
So first, you need to add your chosen assets or simply keep the default ones. In Image 2, you can see one of the eight asset input sections.
Image 2
This strategy offers some general trade settings that apply equally to all assets and some asset-specific settings. This distinction is necessary because some assets have higher volatility than others, requiring asset-specific Take Profit and Stop Loss levels.
Once you have made your selections, proceed to the Indicators and Compare Functions for the voting. Image 3 shows an example of this setup.
Image 3
Later on go to the Indicator specific settings shown in Image 4 to refine the trade results.
Image 4
For refine the trade results take also a look on the result summary table, development of capital plot, on the list of closed and open trades and screener table shown in Image 5.
Image 5
To locate any trade for any asset in the chronological and scroll-able trade list, each trade is marked with a label:
An opening label displaying the trade direction, ticker ID, trade number, invested amount, and remaining cash reserves.
A closing label showing the closing reason, ticker ID, trade number, trade profit (%), trade revenue ($), and updated cash reserves.
Additionally: a green line marks each Take Profit level. An orange line indicates the (trailing) Stop Loss.
The summary table in the bottom-left corner provides insights into how effective the trade strategy is. By analyzing the trade list, you can identify trades that should be avoided.
To find those bad trades on the chart, use the trade number or timestamp. With replay mode, you can go back in time to review a specific trade in detail.
Image 6
In Image 6, you can see an example where replay mode and the start time filter are used to display specific trades within a narrow time range. By identifying a large number of bad trades, you may recognize patterns and formulate conditions to avoid them in the future.
This is the backtesting tool that allows you to develop and refine your trading strategy continuously. With each iteration—from general adjustments to detailed optimizations—you can use these tools to improve your strategy. You can:
Add other indicators with trade signals and direction
Add more indicators signals as filter
Adjust the settings of your indicators to optimize results
Configure key strategy settings, such as Time and Session Filters, Stop Loss, Take Profit, and more
By doing so, you can identify a profitable strategy and its optimal settings.
5. Settings Menu
In the settings menu you will find the following high-lighted sections. Most of the settings have a i mark on their right side. Move over it with the cursor to read specific explanation.
Backtest Results: Here you can decide about visibility of the trade list, of the Screener Table and of the Results Summary. And the colors for bullish, side ways, bearish and no signal. Go above and see Image 5.
Time Filter: You can set a Start time or deactivate it by leave it unhooked. The same with End Time and Duration Days . Duration Days can also count from End time in case you deactivate Start time.
Session Filter: Here, you can chose to activate trading on a weekly basis, specifying which days of the week trading is allowed and which are excluded. Additionally, you can configure trading on a daily basis, setting the start and end times for when trades are permitted. If activated, no new trades will be initiated outside the defined times and sessions.
Trade Logic: Here you can set an extra time frame for all indicators. You can enable Longs or Shorts or both trades.
The min Criteria percentage setting defines the minimum number of voices an asset has to get to be traded. So if you set this to 50% or less also weak winners of the voting get traded while 100% means that the winner of the voting has to get all possible voices.
Additionally, you have the option to delay entry signals. This feature is particularly useful when trade signals exhibit noise and require smoothing.
Enable Trailing Stop and force the strategy to trade only at bar closing. Other-ways the strategy trade intrabar, so when ever a voting present an asset to trade, it will send the alert and the webhooks.
The Hedging is basic as shown in the following Image 7 and serves as a catch if price moves fast in the wrong direction. You can activate a hedging mechanism, which opens a trade in the opposite direction if the price moves x% against the entry price. If both the Stop Loss and Hedging are triggered within the same bar, the hedging action will always take precedence.
Image 6
Indicators to use for Trade Signal Generating: Here you chose the Indicators and their Compare Function for the Voting . Any activated asset will get their indicator valuation which get compared over all assets. The asset with the highest valuation is elected for the trade as long free cash is present and as long the minimum criteria are met.
The Screener Table will show all indicators results of the last bar of all assets. Those indicator values which met the threshold get a background color to high light it. Green for bullish, red for bearish and orange for trade signals without direction. If you chose an Indicator here but without any compare function it will show also their results but with just gray background.
Indicator Settings: here you can setup the indicator specific settings. for deeper insights see 3. Included Indicators and Compare-Functions .
Assets, TP & SL Settings: Asset specific settings. Chose here the TickerID of all Assets you wanna trade. Take Profit 1&2 set the target prices of any trade in relation to the entry price. The Take Profit 1 exit a part of the position defined by the quantity value. Stop Loss set the price to step out when a trade goes the wrong direction.
Invest Settings: Here, you can set the initial amount of cash to start with. The Quantity Percentage determines how much of the available cash is allocated to each trade, while the Fee percentage specifies the trading fee applied to both opening and closing positions.
Webhooks: Here, you configure the License ID and the Comment . This is particularly useful if you plan to use multiple instances of the script, ensuring the webhooks target the correct positions. The Take Profit and Stop Loss values are displayed as prices.
6. Declaration for Tradingview House Rules on Script Publishing
The unique feature of this Democratic Multi-Asset Strategy is its ability to trade multiple assets simultaneously. Equipped with a set of different standard Indicators, it's new democratic Voting System does more robust trading decisions compared to single-asset. Interchangeable Indicators and customizable strategy settings allowing for a wide range of trading strategies.
This script is closed-source and invite-only to support and compensate for over a year of development work. Unlike other single asset strategies, this one cannot use TradingView's strategy functions. Instead, it is designed as an indicator.
7. Disclaimer
Trading is risky, and traders do lose money, eventually all. This script is for informational and educational purposes only. All content should be considered hypothetical, selected post-factum and is not to be construed as financial advice. Decisions to buy, sell, hold, or trade in securities, commodities, and other investments involve risk and are best made based on the advice of qualified financial professionals. Past performance does not guarantee future results. Using this script on your own risk. This script may have bugs and I declare don't be responsible for any losses.
8. Conclusion
Now it’s your turn! Chose an asset class and pick 8 of them and chose some indicators to see the trading results of this democratic voting system. Refine your multi-asset strategy to favorable settings. Once you find a promising configuration, you can set up alerts to send webhooks directly. Configure all parameters, test and validate them in paper trading, and if results align with your expectations, you even can deploy this script as your trading bit.
Cheers

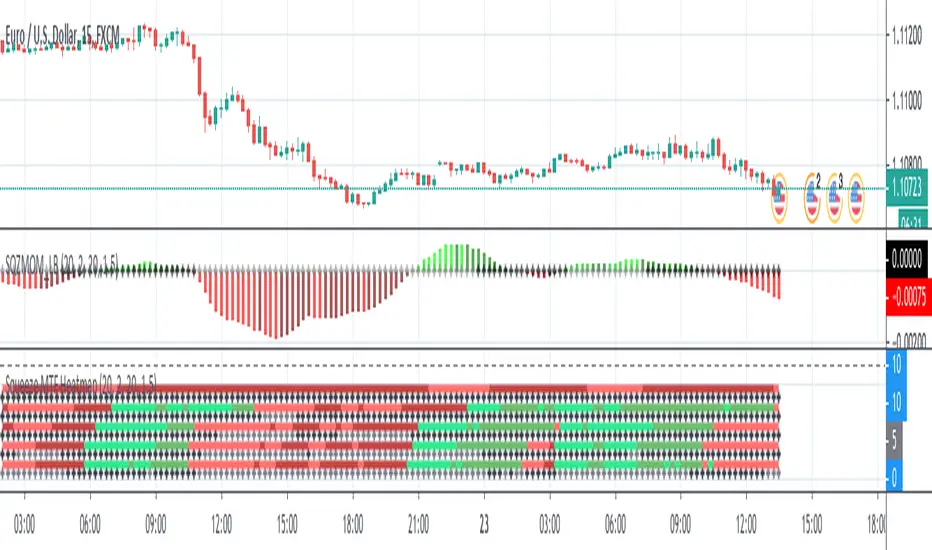
Squeeze MTF HeatmapHere is a multi-timeframe heat map using one of the most apreciated indicators in Tradingview: Squeeze Momentum Indicator by LazyBear.
Study shall be added to 15min chart.
It indicates squeeze and momentum at: 15 min, 30 min, 60 min, 240 min and 1 Day.
Thanks to © azimuthdynamics for inspiration and portion of code
Thanks to Lazy Bear for coding Squeeze Momentum Indicator
Godmode 4.0.2 [Supply/Demand]First off, a huge thank you to the following people:
LEGION:
LazyBear: www.tradingview.com
xSilas: www.tradingview.com
Ni6HTH4awK: www.tradingview.com
sco77m4r7and:
SNOW_CITY: www.tradingview.com
oh92: www.tradingview.com
alexgrover: www.tradingview.com
cI8DH: www.tradingview.com
DonovanWall: www.tradingview.com
shtcoinr: www.tradingview.com
This is the third iteration of Godmode. This time I borrowed the method used by shtcoinr to render supply/demand, resistance and support zones. The idea here is to input the appropriate benchmark tickerid to the asset class you're trading and to paint zones according to the price activity of the selected tickerid. This works very well trying to paint meaningful zones against noisy stocks, currencies, commodities etc. Use a correlation coefficient to determine the best benchmark for your asset class.
Want to Learn?
If you'd like the opportunity to learn Pine but you have difficulty finding resources to guide you, take a look at this rudimentary list: docs.google.com
The list will be updated in the future as more people share the resources that have helped, or continue to help, them. Follow me on Twitter to keep up-to-date with the growing list of resources.
Suggestions or Questions?
Don't even kinda hesitate to forward them to me. My (metaphorical) door is always open.

Godmode 4.0.0 [Oscillator]First off, a huge thank you to the following people:
LEGION:
LazyBear: www.tradingview.com
xSilas: www.tradingview.com
Ni6HTH4awK: www.tradingview.com
sco77m4r7and:
SNOW_CITY: www.tradingview.com
oh92: www.tradingview.com
alexgrover: www.tradingview.com
cI8DH: www.tradingview.com
DonovanWall: www.tradingview.com
Since I've been on TradingView I've become somewhat enthralled by Godmode and the collective work that goes in to it, so I decided to publish my own iteration, building off the ideas already present. (This is a great way to get familiar with Pine by the way, just in case there are any beginners reading this)
Changes
The first change I made was to allow the user to select whatever tickerid they wanted as a benchmark. If trading XBTUSD on BitMEX for example, the indicator will react to exchange-specific activity, which means it will respond to all the little whipsaws, whipsaws that can be especially present on a futures exchange. By typing CRYPTOCAP:BTC or CRYPTOCAP:TOTAL we endeavor to remove noise. It can also signal earlier. Less noise and less lag. Another idea would be to choose a benchmark that has a strong inverse relationship with the asset you're trading: try CRYPTOCAP:USDT as the benchmark against BTC to see what I mean.
I also added the ability to smooth the plot, yet again removing noise but adding considerable lag.
The linear regression of the wave-trend is calculated in place of the EMA. This is plotted as columns with the midline (50) as the base. This is just calculating the slope of the wave-trend and can signal a weakening trend before a reversal takes place.
Using cI8DH's True RSI script () as inspiration, I added a function for calculating the True TSI in an attempt to remove any bullish bias. Funnily enough, when I tried to do the same with the RSI I had some problems. I'll try to resolve this in the coming weeks.
Made slight changes to the aesthetics. Tried to bring the two main plots alive by making their bold, opaque colors stand off the subtle tones in the background.
To Do List
1. I would like to sort out the issue with the True RSI.
2. When the plots are smoothed, there's an issue with the green 'Caution!' dots appearing in the lower half of the indicator.
3. I'd like to adjust the code so that if the 'Benchmark' box is empty, that it will automatically register the current tickerid as the 'Benchmark'.
If anyone has any suggestions on other fixes or how to apply the fixes mentioned by me, please don't hesitate to reach out to me here or through other media platforms.
Want to Learn?
If you'd like the opportunity to learn Pine but you have difficulty finding resources to guide you, take a look at this rudimentary list: docs.google.com
The list will be updated in the future as more people share the resources that have helped, or continue to help, them. Follow me on Twitter to keep up-to-date with the growing list of resources.
Suggestions or Questions?
Don't even kinda hesitate to forward them to me. My (metaphorical) door is always open.
BITMEX:XBTUSD
CRYPTOCAP:BTC
CRYPTOCAP:TOTAL
CRYPTOCAP:USDT.D

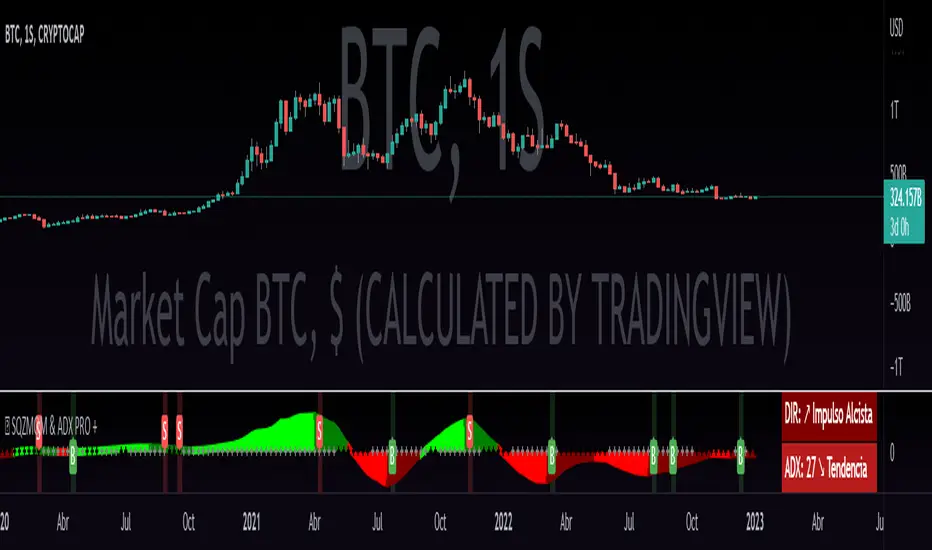
QZMOM & ADX PRO+The Momentum Squeeze Indicator is a momentum oscillator that indicates how explosively the price will move. Its first known version was called "TTM Squeeze" by John Carter explained in his book "Mastering the Trade" (chapter 11) and popularized in TradingView by a developer named LazyBear.
The black crosses on the center line show that the market has just entered a consolidation. This means low volatility, the market is preparing for an explosive move (up or down). The gray crosses mean the "Squeeze". Carter suggests waiting until the first gray after a black cross and taking a position in the direction of the oscillator. For its part, LazyBear recommends using an additional indicator such as ADX to improve the effectiveness of entry points and position closures.
Oscillator understanding improvements:
During the indicator creation process we were able to better understand the logic of the oscillator and based on that knowledge we implemented improvements.
Oscillator development improvements:
Side panel:
The ADX algorithm was incorporated, which is displayed numerically on the right panel of the indicator, shows the value of ADX and its directionality.
Added an arrow pointer to indicate oscillator directionality.
Two exponential moving averages of 11 and 55 periods have been added to the right panel, this will mark if the trend is bullish or bearish depending on the crossover of the EMAs.
An indicator of the Indicator Squeeze was also included, which marks the periods of price consolidation (OFF) and the periods in which the price should react explosively.
Added a feature that allows automatic color changing of the panels based on the color of the oscillator and the ADX.
o ADX: Dark green (bullish force).
o ADX: Light green (loss of bullish strength).
o ADX: Dark red (bearish force).
o ADX: Light red (loss of bearish strength).
o ADX: Orange (loss of strength, disinterest and low volume).
Signs:
A very famous strategy that we have learned is that of the trading expert Jaime Merino, who by combining the Momentum Squeeze Indicator and a ADX común, logró vincular eficientemente la debilidad del ADX con el inicio de un momentum alcista o bajista. La parametrización de su estrategia se señaló en alertas de compra y venta, que se representan de la siguiente manera:
B (Comprar): se activa cuando un movimiento bajista marcado por el ADX (pendiente negativa) termina y el oscilador toma direccionalidad alcista (impulso alcista).
S (Vender): se activa cuando un movimiento alcista marcado por el ADX (pendiente negativa) termina y el oscilador toma direccionalidad bajista (momentum bajista).
Filter:
To prevent any trader from trading against the trend, a filter was added that limits bearish entry alerts when the trend is up and vice versa, that is, when the EMA 10 is above the EMA 55, it is understood that the trend is up in that time frame, therefore bearish entry alerts will not be triggered. It will be the decision of each trader to activate or deactivate this function.
Alerts:
This is without a doubt the most awaited function for all Latin American traders, (Just kidding), but being aware, I am very proud of the implementation of alerts for each improvement made to this indicator, if you decide to use the Momentum Squeeze Indicator you can automate alerts for the following actions:
Buy and sell alerts.
Alerts to activate the Squeeze to (ON).
Oscillator quadrant change alerts
or bullish momentum.
or bearish momentum.
o Bullish force.
o Bearish force.
Recommendations:
One of the things that became clearer in the development of this indicator is the coloring of the dials, which is why we recommend the use of four colors, one for each oscillator grid.
Crypto Volume/Strength ComparatorHello Traders,
Here is an attempt to perform comparative analysis between top cryptos based on strength (oscillator) and volume. Methodology used here is similar to Magic Number formula described in the post : Enhanced Magic Formula for fundamental analysis . But, instead of using fundamentals, we are making use of few technicals to derive similar outcome. Usage of the available stats will not be same as Magic number since we are using technicals.
⬜ Process
▶ Get crypto exchange based on prefix of instrument being used.
▶ For the given exchange, get data for all the tickers available in input fields.
▶ Calculate Oscillator, Momentum based on price for each tickers.
▶ Calculate Oscillator, Momentum based on volume for each tickers.
▶ Calculate Volatility for each tickers.
▶ Rank Price-Oscillator, Price-Momentum, Volume-Oscillator, Volume-Momentum, Volatility for each tickers.
▶ Calculate combined rank by adding up individual ranks.
▶ Calculate movement of rankings from bar to bar
▶ Sort tickers based on rank and populate them on table. Display direction of rankings.
⬜ Components
Display components are as follows:
⬜ Settings
Settings are pretty simple and straightforward
⬜ Calculations
▶ Oscillators : High values of oscillators are considered as ideal as the process is intended towards finding trend.
▶ Momentum : Momentum is calculated on the basis of Squeeze Momentum Indicator by @LazyBear.
▶ Volatility : Volatility is calculated on the basis of Williams Vix Fix by @ChrisMoody. Here too since we are in trend following mode, lower vix fix is considered ideal.
⬜ Few Notes
Tickers will show data only if selected exchange has them. Some tickers are not available in all exchanges. In that case, it will show NAN. This is kind of unavoidable as we need to have fixed size arrays for any calculations.
Indicator works only on crypto tickers which has valid exchange.
Tickers move through the rankings in real time. Background of all stats are based on gradient from green to red.
Tickers on top may not always have better long opportunity or tickers at bottom may not always be optimal for shorting. We need to consider how long the instrument may stay in the position or how fast it is moving in opposite direction. Hence, directions of the ranking movement are also shown on the table.

Relative Volume (rVol), Better Volume, Average Volume ComparisonThis is the best version of relative volume you can find a claim which is based on the logical soundness of its calculation.
I have amalgamated various volume analysis into one synergistic script. I wasn't going to opensource it. But, as one of the lucky few winners of TradingClue 2. I felt obligated to give something back to the community.
Relative volume traditionally compares current volume to prior bar volume or SMA of volume. This has drawbacks. The question of relative volume is "Volume relative to what?" In the traditional scripts you'll find it displays current volume relative to the last number of bars. But, is that the best way to compare volume. On a daily chart, possibly. On a daily chart this can work because your units of time are uniform. Each day represents a full cycle of volume. However, on an intraday chart? Not so much.
Example: If you have a lookback of 9 on an hourly chart in a 24 hour market, you are then comparing the average volume from Midnight - 9 AM to the 9 AM volume. What do you think you'll find? Well at 9:30 when NY exchanges open the volume should be consistently and predictably higher. But though rVol is high relative to the lookback period, its actually just average or maybe even below average compared to prior NY session opens. But prior NY session opens are not included in the lookback and thus ignored.
This problem is the most visibly noticed when looking at the volume on a CME futures chart or some equivalent. In a 24 hour market, such as crypto, there are website's like skew can show you the volume disparity from time of day. This led me to believe that the traditional rVol calculation was insufficient. A better way to calculate it would be to compare the 9:30 am 30m bar today to the last week's worth of 9:30 am 30m bars. Then I could know whether today's volume at 9:30 am today is high or low based on prior 9:30 am bars. This seems to be a superior method on an intraday basis and is clearly superior in markets with irregular volume
This led me to other problems, such as markets that are open for less than 24 hours and holiday hours on traditional market exchanges. How can I know that the script is accurately looking at the correct prior relevant bars. I've created and/or adapted solutions to all those problems and these calculations and code snippets thus have value that extend beyond this rVol script for other pinecoders.
The Script
This rVol script looks back at the bars of the same time period on the viewing timeframe. So, as we said, the last 9:30 bars. Averages those, then divides the: . The result is a percentage expressed as x.xxx. Thus 1.0 mean current volume is equal to average volume. Below 1.0 is below the average and above 1.0 is above the average.
This information can be viewed on its own. But there are more levels of analysis added to it.
Above the bars are signals that correlate to the "Better Volume Indicator" developed by, I believe, the folks at emini-watch and originally adapted to pinescript by LazyBear. The interpretation of these symbols are in a table on the right of the indicator.
The volume bars can also be colored. The color is defined by the relationship between the average of the rVol outputs and the current volume. The "Average rVol" so to speak. The color coding is also defined by a legend in the table on the right.
These can be researched by you to determine how to best interpret these signals. I originally got these ideas and solid details on how to use the analysis from a fellow out there, PlanTheTrade.
I hope you find some value in the code and in the information that the indicator presents. And I'd like to thank the TradingView team for producing the most innovative and user friendly charting package on the market.
(p.s. Better Volume is provides better information with a longer lookback value than the default imo)
Credit for certain code sections and ideas is due to:
LazyBear - Better Volume
Grimmolf (From GitHub) - Logic for Loop rVol
R4Rocket - The idea for my rVol 1 calculation
And I can't find the guy who had the idea for the multiples of volume to the average. Tag him if you know him
Final Note: I'd like to leave a couple of clues of my own for fellow seekers of trading infamy.
Indicators: indicators are like anemometers (The things that measure windspeed). People talk bad about them all the time because they're "lagging." Well, you can't tell what the windspeed is unless the wind is blowing. anemometers are lagging indicators of wind. But forecasters still rely on them. You would use an indicator, which I would define as a instrument of measure, to tell you the windspeed of the markets. Conversely, when people talk positively about indicators they say "This one is great and this one is terrible." This is like a farmer saying "Shovels are great, but rakes are horrible." There are certain tools that have certain functions and every good tool has a purpose for a specific job. So the next time someone shares their opinion with you about indicators. Just smile and nod, realizing one day they'll learn... hopefully before they go broke.
How to forecast: Prediction is accomplished by analyzing the behavior of instruments of measure to aggregate data (using your anemometer). The data is then assembled into a predictive model based on the measurements observed (a trading system). That predictive model is tested against reality for it's veracity (backtesting). If the model is predictive, you can optimize your decision making by creating parameter sets around the prediction that are synergistic with the implications of the prediction (risk, stop loss, target, scaling, pyramiding etc).
<3

WWV_LB pivotfix histogram jayy
This is a modification of LazyBear's WWV_LB which plots cumulative volume of waves. The reversal points are defined through relative closing prices. I made adjustments to the script to show waves turning on actual/true low or high pivots as opposed to the bar/candle identified in the LazyBear script. What I mean by that is that the actual/true low or high pivots are in fact the true WWV_LB pivots. The original WWV_LB script calculates cumulative volume from reversal confirmation bar to reversal confirmation bar as opposed to the true WWV_LB pivot bar to pivot bar. As such the waves can have slightly different start and end points. As such the cumulative volume can also be different from te WWV_LB script. This is because confirmation of a wave reversal can lag a few bars after the true reversal pivot bar. In the script notes, you will see the original key WWV_LB script lines that identify the true high or low pivots and confirm the wave direction has reversed. I have taken these lines from LazyBear's original script. I have included the LazyBear script within the script notes so that the original can be compared to what I have added/changed. Instead of "trendDetectionLength" I have inserted "Trend Detection Length". You can of course change the descriptor to what you wish by editing script line 33 to the original term or whatever you wish. You might also wish to set the default to the value "2" as per the original script. I have set the default to "3". This script should be used in conjunction with "WWV-LB zigzag pivot fix jayy" script which is shown on this screen for comparison.
Here is a link to the original LazyBear histogram script which can be used for comparison. The differences are subtle, however, the histograms will regularly be different by a bar or two:
The lowest panel has the original LazyBear WWV_LB script for comparison. All three scripts have been set to a Trend Detection Length of 3.jayy

Weis Wave Candle█Overview
The Weis Wave Candle indicator is a technical tool designed for the TradingView platform, enabling traders to analyze market dynamics by identifying price waves. The indicator relies solely on candlestick data, making it functional on markets where volume data is unavailable. It employs two trend detection methods, dynamic color gradients, trend change alerts, and clear visualization to assist in identifying trend strength and potential reversal points.
█Concept
The Weis Wave Candle indicator was developed to overcome limitations associated with the lack of volume data in certain markets, offering an alternative to traditional volume-based indicators like Weis Wave. Instead of volume, it measures candle size (body or body plus half the candle range) and accumulates it within a price wave. The indicator includes two trend calculation methods:
-LazyBear Style: Based on the popular Weis Wave adaptation by LazyBear, likely the most recognized version of this tool, it uses closing price comparisons and trend confirmation via trend functions. Results may differ from the original Weis Wave, as candle size does not always align with volume.
-Impulse Trend: A method that evaluates trend strength by summing price movements over a specified period, where each candle with a higher close than the previous adds +1, a lower close subtracts -1, and no change adds 0. The trend strength is determined by the sum: positive indicates an uptrend, negative a downtrend, and zero a continuation of the prior trend.
Results are visualized using dynamic color gradients, and alerts notify users of trend direction changes, facilitating quick decision-making.
█Why Use It?
-Volume-Free Operation: Ideal for markets without volume data.
-Flexibility: Two trend detection methods allow adaptation to various trading strategies.
-Dynamic Visualization: Color gradients and semi-transparent backgrounds simplify quick interpretation of trend strength.
-Alerts: Notifications for trend changes (from uptrend to downtrend and vice versa) support active trading.
-Customization: Options to adjust colors, analysis periods, and candle shadow inclusion.
█How It Works?
-Candle Size Calculation: Depending on the setting, candle size includes only the body (difference between close and open) or the body plus half the candle range (calculated as 0.5 * (high - low)) (setting Include candle shadows).
-Trend Detection:
LazyBear Style: Compares closing prices of adjacent candles to determine direction (uptrend, downtrend, or neutral) and confirms the trend using ta.rising or ta.falling functions over the specified period.
Impulse Trend: Sums price movements over the analysis period (+1 for a candle with a higher close than the previous, -1 for a lower close, 0 for no change). A positive sum indicates an uptrend, a negative sum a downtrend, and zero a continuation of the prior trend.
-Wave Accumulation: Candle sizes are accumulated within a single wave until the trend changes.
-Normalization and Gradients: Wave values are normalized to a 0-100 scale solely for color gradient purposes, enabling dynamic color changes from base to intense, reflecting wave strength relative to historical values. The height of columns (representing waves) is not normalized and corresponds to the accumulated candle size.
-Alerts: The indicator generates notifications when the wave direction changes (from uptrend to downtrend or vice versa), enabling quick responses to trend shifts.
-Visualization: Upward and downward waves are plotted as columns with dynamic colors, and the chart background changes color for better visibility.
█Settings and Customization
-Trend Detection Method: Choose between LazyBear Style (default) and Impulse Trend.
-Trend Analysis Period: Number of candles for trend analysis (default: 4).
-Include Candle Shadows: Determines whether to include half the candle range (high - low) in addition to the body (default: enabled).
-Lookback Period for Dynamic Thresholds: Number of candles to calculate the maximum and minimum wave values for color gradient normalization (default: 70).
-Gradient Minimum/Maximum Value: Threshold values defining the normalization range for color gradients (default: 0/100). A lower minimum value reduces the threshold for lighter colors, while a higher maximum value increases the threshold for more intense colors.
-Wave Colors: Options to select base and intense colors for upward and downward waves.
-Alerts: Enable alerts in TradingView settings (Upward Trend Change and Downward Trend Change) for trend change notifications.
█Usage Examples
-Trend Analysis: Upward waves (green columns) indicate buying pressure, while downward waves (red columns) indicate selling pressure. The more intense the color, the stronger the wave relative to historical values.
-Comparing Timeframes: Analyze trends across multiple timeframes (e.g., 1H, 4H, 1D) for broader context. For example, enter a position on the 4H timeframe after confirming trend alignment on 1H, 4H, and 1D, along with validation from a key level, such as a Fibonacci level or a Break of Structure (BOS).
-Using Alerts: Configure alerts in TradingView to receive notifications of trend changes, useful for active trading.
█Notes for Users
-Experiment with the Trend Analysis Period and Include Candle Shadows settings to tailor the indicator to your market and timeframe.
-Combine the indicator with other tools, such as support/resistance levels or RSI, to enhance signal accuracy.
-The Impulse Trend method may be more sensitive to short-term price changes, while LazyBear Style performs better in clear trends. Results from LazyBear Style may differ from the original Weis Wave, as candle size does not always align with volume.

888 BOT #alerts█ 888 BOT #alerts
This is an Expert Advisor 'EA' or Automated trading script for ‘longs’ and ‘shorts’, which uses only a Take Profit or, in the worst case, a Stop Loss to close the trade.
It's a much improved version of the previous ‘Repanocha’. It doesn`t use 'Trailing Stop' or 'security ()' functions (although using a security function doesn`t mean that the script repaints) and all signals are confirmed, therefore the script doesn`t repaint in alert mode and is accurate in backtest mode.
Apart from the previous indicators, some more and other functions have been added for Stop-Loss, re-entry and leverage.
It uses 8 indicators, (many of you already know what they are, but in case there is someone new), these are the following:
1. Jurik Moving Average
It's a moving average created by Mark Jurik for professionals which eliminates the 'lag' or delay of the signal. It's better than other moving averages like EMA, DEMA, AMA or T3.
There are two ways to decrease noise using JMA. Increasing the 'LENGTH' parameter will cause JMA to move more slowly and therefore reduce noise at the expense of adding 'lag'
The 'JMA LENGTH', 'PHASE' and 'POWER' parameters offer a way to select the optimal balance between 'lag' and over boost.
Green: Bullish, Red: Bearish.
2. Range filter
Created by Donovan Wall, its function is to filter or eliminate noise and to better determine the price trend in the short term.
First, a uniform average price range 'SAMPLING PERIOD' is calculated for the filter base and multiplied by a specific quantity 'RANGE MULTIPLIER'.
The filter is then calculated by adjusting price movements that do not exceed the specified range.
Finally, the target ranges are plotted to show the prices that will trigger the filter movement.
Green: Bullish, Red: Bearish.
3. Average Directional Index (ADX Classic) and (ADX Masanakamura)
It's an indicator designed by Welles Wilder to measure the strength and direction of the market trend. The price movement is strong when the ADX has a positive slope and is above a certain minimum level 'ADX THRESHOLD' and for a given period 'ADX LENGTH'.
The green color of the bars indicates that the trend is bullish and that the ADX is above the level established by the threshold.
The red color of the bars indicates that the trend is down and that the ADX is above the threshold level.
The orange color of the bars indicates that the price is not strong and will surely lateralize.
You can choose between the classic option and the one created by a certain 'Masanakamura'. The main difference between the two is that in the first it uses RMA () and in the second SMA () in its calculation.
4. Parabolic SAR
This indicator, also created by Welles Wilder, places points that help define a trend. The Parabolic SAR can follow the price above or below, the peculiarity that it offers is that when the price touches the indicator, it jumps to the other side of the price (if the Parabolic SAR was below the price it jumps up and vice versa) to a distance predetermined by the indicator. At this time the indicator continues to follow the price, reducing the distance with each candle until it is finally touched again by the price and the process starts again. This procedure explains the name of the indicator: the Parabolic SAR follows the price generating a characteristic parabolic shape, when the price touches it, stops and turns (SAR is the acronym for 'stop and reverse'), giving rise to a new cycle. When the points are below the price, the trend is up, while the points above the price indicate a downward trend.
5. RSI with Volume
This indicator was created by LazyBear from the popular RSI.
The RSI is an oscillator-type indicator used in technical analysis and also created by Welles Wilder that shows the strength of the price by comparing individual movements up or down in successive closing prices.
LazyBear added a volume parameter that makes it more accurate to the market movement.
A good way to use RSI is by considering the 50 'RSI CENTER LINE' centerline. When the oscillator is above, the trend is bullish and when it is below, the trend is bearish.
6. Moving Average Convergence Divergence (MACD) and (MAC-Z)
It was created by Gerald Appel. Subsequently, the histogram was added to anticipate the crossing of MA. Broadly speaking, we can say that the MACD is an oscillator consisting of two moving averages that rotate around the zero line. The MACD line is the difference between a short moving average 'MACD FAST MA LENGTH' and a long moving average 'MACD SLOW MA LENGTH'. It's an indicator that allows us to have a reference on the trend of the asset on which it is operating, thus generating market entry and exit signals.
We can talk about a bull market when the MACD histogram is above the zero line, along with the signal line, while we are talking about a bear market when the MACD histogram is below the zero line.
There is the option of using the MAC-Z indicator created by LazyBear, which according to its author is more effective, by using the parameter VWAP (volume weighted average price) 'Z-VWAP LENGTH' together with a standard deviation 'STDEV LENGTH' in its calculation.
7. Volume Condition
Volume indicates the number of participants in this war between bulls and bears, the more volume the more likely the price will move in favor of the trend. A low trading volume indicates a lower number of participants and interest in the instrument in question. Low volumes may reveal weakness behind a price movement.
With this condition, those signals whose volume is less than the volume SMA for a period 'SMA VOLUME LENGTH' multiplied by a factor 'VOLUME FACTOR' are filtered. In addition, it determines the leverage used, the more volume, the more participants, the more probability that the price will move in our favor, that is, we can use more leverage. The leverage in this script is determined by how many times the volume is above the SMA line.
The maximum leverage is 8.
8. Bollinger Bands
This indicator was created by John Bollinger and consists of three bands that are drawn superimposed on the price evolution graph.
The central band is a moving average, normally a simple moving average calculated with 20 periods is used. ('BB LENGTH' Number of periods of the moving average)
The upper band is calculated by adding the value of the simple moving average X times the standard deviation of the moving average. ('BB MULTIPLIER' Number of times the standard deviation of the moving average)
The lower band is calculated by subtracting the simple moving average X times the standard deviation of the moving average.
the band between the upper and lower bands contains, statistically, almost 90% of the possible price variations, which means that any movement of the price outside the bands has special relevance.
In practical terms, Bollinger bands behave as if they were an elastic band so that, if the price touches them, it has a high probability of bouncing.
Sometimes, after the entry order is filled, the price is returned to the opposite side. If price touch the Bollinger band in the same previous conditions, another order is filled in the same direction of the position to improve the average entry price, (% MINIMUM BETTER PRICE ': Minimum price for the re-entry to be executed and that is better than the price of the previous position in a given %) in this way we give the trade a chance that the Take Profit is executed before. The downside is that the position is doubled in size. 'ACTIVATE DIVIDE TP': Divide the size of the TP in half. More probability of the trade closing but less profit.
█ STOP LOSS and RISK MANAGEMENT.
A good risk management is what can make your equity go up or be liquidated.
The % risk is the percentage of our capital that we are willing to lose by operation. This is recommended to be between 1-5%.
% Risk: (% Stop Loss x % Equity per trade x Leverage) / 100
First the strategy is calculated with Stop Loss, then the risk per operation is determined and from there, the amount per operation is calculated and not vice versa.
In this script you can use a normal Stop Loss or one according to the ATR. Also activate the option to trigger it earlier if the risk percentage is reached. '% RISK ALLOWED' wich is calculated according with: '%EQUITY ON EACH ENTRY'. Only works with Stop Loss on 'NORMAL' or 'BOTH' mode.
'STOP LOSS CONFIRMED': The Stop Loss is only activated if the closing of the previous bar is in the loss limit condition. It's useful to prevent the SL from triggering when they do a ‘pump’ to sweep Stops and then return the price to the previous state.
█ ALERTS
There is an alert for each leverage, therefore a maximum of 8 alerts can be set for 'long' and 8 for 'short', plus an alert to close the trade with Take Profit or Stop Loss in market mode. You can also place Take Profit limit and Stop Loss limit orders a few seconds after filling the position entry order.
- 'MAXIMUM LEVERAGE': It is the maximum allowed multiplier of the % quantity entered on each entry for 1X according to the volume condition.
- 'ADVANCE ALERTS': There is always a time delay from when the alert is triggered until it reaches the exchange and can be between 1-15 seconds. With this parameter, you can advance the alert by the necessary seconds to activate it earlier. In this way it can be synchronized with the exchange so that the execution time of the entry order to the position coincides with the opening of the bar.
The settings are for Bitcoin at Binance Futures (BTC: USDTPERP) in 30 minutes.
For other pairs and other timeframes, the settings have to be adjusted again. And within a month, the settings will be different because we all know the market and the trend are changing.
█ 888 BOT (SPANISH)
Este es un Expert Advisor 'EA' o script de trading automatizado para ‘longs’ y ‘shorts’, el cual, utiliza solo un Take Profit o, en el peor de los casos, un Stop Loss para cerrar el trade.
Es una versión muy mejorada del anterior ‘Repanocha’. No utiliza ‘Trailing Stop’, ni funciones ‘security()’ (aunque usar una función security no significa que el script repinte) y todas las señales son confirmadas, por consiguiente, el script no repinta en modo alertas y es preciso en en el modo backtest.
Aparte de los anteriores indicadores se han añadido algunos más y otras funciones para Stop-Loss, de re-entrada y apalancamiento.
Utiliza 8 indicadores, (muchos ya sabéis sobradamente lo que son, pero por si hay alguien nuevo), son los siguientes:
1. Jurik Moving Average
Es una media móvil creada por Mark Jurik para profesionales la cual elimina el ‘lag’ o retardo de la señal. Es mejor que otras medias móviles como la EMA, DEMA, AMA o T3.
Hay dos formas de disminuir el ruido utilizando JMA. El aumento del parámetro 'LENGTH' hará que JMA se mueva más lentamente y, por lo tanto, reducirá el ruido a expensas de añadir ‘lag’
Los parámetros 'JMA LENGTH', 'PHASE' y 'POWER' ofrecen una forma de seleccionar el equilibrio óptimo entre ‘lag’ y sobre impulso.
Verde : Alcista, Rojo: Bajista.
2. Range filter
Creado por Donovan Wall, su función es la de filtrar o eliminar el ruido y poder determinar mejor la tendencia del precio a corto plazo.
Primero, se calcula un rango de precio promedio uniforme 'SAMPLING PERIOD' para la base del filtro y se multiplica por una cantidad específica 'RANGE MULTIPLIER'.
A continuación, el filtro se calcula ajustando los movimientos de precios que no exceden el rango especificado.
Por último, los rangos objetivo se trazan para mostrar los precios que activarán el movimiento del filtro.
Verde : Alcista, Rojo: Bajista.
3. Average Directional Index (ADX Classic) y (ADX Masanakamura)
Es un indicador diseñado por Welles Wilder para medir la fuerza y dirección de la tendencia del mercado. El movimiento del precio tiene fuerza cuando el ADX tiene pendiente positiva y está por encima de cierto nivel mínimo 'ADX THRESHOLD' y para un periodo dado 'ADX LENGTH'.
El color verde de las barras indica que la tendencia es alcista y que el ADX está por encima del nivel establecido por el threshold.
El color Rojo de las barras indica que la tendencia es bajista y que el ADX está por encima del nivel de threshold.
El color naranja de las barras indica que el precio no tiene fuerza y seguramente lateralizará.
Se puede elegir entre la opción clásica y la creada por un tal 'Masanakamura'. La diferencia principal entre los dos es que en el primero utiliza RMA() y en el segundo SMA() en su cálculo.
4. Parabolic SAR
Este indicador, creado también por Welles Wilder, coloca puntos que ayudan a definir una tendencia. El Parabolic SAR puede seguir al precio por encima o por debajo, la particularidad que ofrece es que cuando el precio toca al indicador, este salta al otro lado del precio (si el Parabolic SAR estaba por debajo del precio salta arriba y viceversa) a una distancia predeterminada por el indicador. En este momento el indicador vuelve a seguir al precio, reduciendo la distancia con cada vela hasta que finalmente es tocado otra vez por el precio y se vuelve a iniciar el proceso. Este procedimiento explica el nombre del indicador: el Parabolic SAR va siguiendo al precio generando una característica forma parabólica, cuando el precio lo toca, se para y da la vuelta (SAR son las siglas en inglés de ‘stop and reverse’), dando lugar a un nuevo ciclo. Cuando los puntos están por debajo del precio, la tendencia es alcista, mientras que los puntos por encima del precio indica una tendencia bajista.
5. RSI with Volume
Este indicador lo creo un tal LazyBear de TV a partir del popular RSI.
El RSI es un indicador tipo oscilador utilizado en análisis técnico y creado también por Welles Wilder que muestra la fuerza del precio mediante la comparación de los movimientos individuales al alza o a la baja de los sucesivos precios de cierre.
LazyBear le añadió un parámetro de volumen que lo hace más preciso al movimiento del mercado.
Una buena forma de usar el RSI es teniendo en cuenta la línea central de 50 'RSI CENTER LINE'. Cuando el oscilador está por encima, la tendencia es alcista y cuando está por debajo la tendencia es bajista.
6. Moving Average Convergence Divergence (MACD) y (MAC-Z)
Fue creado por Gerald Appel. Posteriormente se añadió el histograma para anticipar el cruce de medias. A grandes rasgos podemos decir que el MACD es un oscilador consistente en dos medias móviles que van girando en torno a la línea de cero. La línea del MACD no es más que la diferencia entre una media móvil corta 'MACD FAST MA LENGTH' y una media móvil larga 'MACD SLOW MA LENGTH'. Es un indicador que nos permite tener una referencia sobre la tendencia del activo sobre el cual se está operando, generando de este modo señales de entrada y salida del mercado.
Podemos hablar de mercado alcista cuando el histograma del MACD se sitúe por encima de la línea cero, junto con la línea de señal, mientras que hablaremos de mercado bajista cuando el histograma MACD se situará por debajo de la línea cero.
Está la opción de utilizar el indicador MAC-Z creado por LazyBear que según su autor es más eficaz, por utilizar el parámetro VWAP (precio medio ponderado por volumen) 'Z-VWAP LENGTH' junto con una desviación standard 'STDEV LENGTH' en su cálculo.
7. Volume Condition
El volumen indica el número de participantes en esta guerra entre toros y osos, cuanto más volumen más probabilidad de que se mueva el precio a favor de la tendencia. Un volumen bajo de negociación indica un menor número de participantes e interés por el instrumento en cuestión. Los bajos volúmenes pueden revelar debilidad detrás de un movimiento de precios.
Con esta condición se filtran aquellas señales cuyo volumen es inferior a la SMA de volumen para un periodo 'SMA VOLUME LENGTH' multiplicado por un factor 'VOLUME FACTOR'. Además, determina el apalancamiento utilizado, a más volumen, más participantes, más probabilidad de que se mueva el precio a nuestro favor, es decir, podemos utilizar más apalancamiento. El apalancamiento en este script lo determina las veces que está el volumen por encima de la línea de la SMA.
El apalancamiento máximo es de 8.
8. Bollinger Bands
Este indicador fue creado por John Bollinger y consiste en tres bandas que se dibujan superpuestas al gráfico de evolución del precio.
La banda central es una media móvil, normalmente se emplea una media móvil simple calculada con 20 períodos. ('BB LENGTH' Número de periodos de la media móvil)
La banda superior se calcula sumando al valor de la media móvil simple X veces la desviación típica de la media móvil. ('BB MULTIPLIER' Número de veces la desviación típica de la media móvil)
La banda inferior de calcula restando a la media móvil simple X veces la desviación típica de la media móvil.
la franja comprendida entre las bandas superior e inferior contiene, estadísticamente, casi un 90% de las posibles variaciones del precio, lo que significa que cualquier movimiento del precio fuera de las bandas tiene especial relevancia.
En términos prácticos, las bandas de Bollinguer se comporta como si de una banda elástica se tratara de manera que, si el precio las toca, éste tiene mucha probabilidad de rebotar.
En ocasiones, después de rellenarse la orden de entrada, el precio se devuelve hacia el lado contrario. Si toca la banda de Bollinger se rellena otra orden en la misma dirección de la posición para mejorar el precio medio de entrada, (% MINIMUM BETTER PRICE': Precio mínimo para que se ejecute la re-entrada y que sea mejor que el precio de la posición anterior en un % dado) de esta manera damos una oportunidad al trade de que el Take Profit se ejecute antes. La desventaja es que se dobla el tamaño de la posición. 'ACTIVATE DIVIDE TP': Divide el tamaño del TP a la mitad. Más probabilidad de que se cierre el trade pero menos ganancias.
█ STOP LOSS y RISK MANAGEMENT.
Una buena gestión de las pérdidas o gestión del riesgo es lo que puede hacer que tu cuenta suba o se liquide en poco tiempo.
El % de riesgo es el porcentaje de nuestro capital que estamos dispuestos a perder por operación. Este se aconseja que debe estar comprendido entre un 1-5%.
% Risk = (% Stop Loss x % Equity per trade x Leverage) / 100
Primero se calcula la estrategia con Stop Loss, después se determina el riesgo por operación y a partir de ahí se calcula el monto por operación y no al revés.
En este script puedes usar un Stop Loss normal o uno según el ATR. También activar la opción de que salte antes si se alcanza el porcentaje de riesgo. '% RISK ALLOWED' que se calcula según el porcentaje de tu capital para 1X '% EQUITY ON EACH ENTRY'.
'STOP LOSS CONFIRMED': Solamente se activa el Stop Loss si el cierre de la barra anterior se encuentra en la condición de límite de pérdidas. Es útil para evitar que se dispare el SL cuando hacen un ‘pump’ para barrer Stops y luego se devuelve el precio a la normalidad.
█ ALERTAS
Hay una alerta por cada apalancamiento por consiguiente como máximo se pueden poner 8 alertas para 'long' y 8 para 'short', más una alerta para cerrar el trade con Take Profit o Stop Loss en modo market. Tambien puedes colocar las ordenes Take Profit limit y Stop Loss limit unos segundos despues de rellenar la orden de entrada de la posición.
- 'MAXIMUM LEVERAGE': Es el máximo multiplicador permitido de la cantidad introducida para 1X según la condición de volumen.
- 'ADVANCE ALERTS': Siempre existe un retardo de tiempo desde que se activa la alerta hasta que llega al exchange y que puede ser de entre 1-15 segundos. Con este párametro se puede adelantar la alerta los segundos necesarios para que se active antes. De este modo se puede sincronizar con el exchange para que el tiempo de ejecución de la orden de entrada a la posición coincida con la de apertura de la barra.
Los settings son para Bitcoin en Binance Futures (BTC:USDTPERP) en 30 minutos.
Para otro pares y otras temporalidades se tienen que ajustar las opciones de nuevo. Además para dentro de un mes, los ajustes serán otros distintos ya que el mercado y la tendencia es cambiante.

Defended Price Levels (DPLs) — Melvin Dickover ConceptThis indicator identifies and draws horizontal “Defended Price Levels” (DPLs) exactly as originally described by Melvin E. Dickover in his trading methodology.
Dickover observed that when extreme relative volume and extreme “freedom of movement” (volume-to-price-movement ratio) occur on the same bar, especially on bars with large gaps or unusually large bodies, the closing price (or previous close) of that bar very often becomes a significant future support/resistance level that the market later “defends.”
This script automates the detection of those exact coincident spikes using two well-known public indicators:
Relative Volume (RVI)
• Original idea: Melvin Dickover
• Pine Script implementation used here: “Relative Volume Indicator (Freedom Of Movement)” by LazyBear
Link:
Freedom of Movement (FoM)
• Original idea and calculation: starbolt64
• Pine Script: “Freedom of Movement” by starbolt64
Link:
How this indicator works
Calculates the raw (possibly negative) LazyBear RVI and starbolt64’s exact FoM values
Normalizes and standardizes both over the user-defined lookback
Triggers only when both RVI and FoM exceed the chosen number of standard deviations on the same bar (true Dickover coincident-spike condition)
Applies Dickover’s original price-selection rules (uses current close on big gaps or 2× body expansion candles, otherwise previous close)
Draws a thin maroon horizontal ray only when the new level is sufficiently far from all previously drawn levels (default ≥0.8 %) and the maximum number of levels has not been reached
Keeps the chart clean by limiting the total number of significant defended levels shown
This is not a republish or minor variation of the two source scripts — it is a faithful automation of Melvin Dickover’s specific “defended price line” concept that he manually marked using the coincidence of these two indicators.
Full credit goes to:
Melvin E. Dickover — creator of the Defended Price Levels concept
LazyBear — author of the Relative Volume (RVI) implementation used here
starbolt64 — author of the Freedom of Movement indicator and calculation
Settings (all adjustable):
Standard Deviation Length (default 60)
Spike Threshold in standard deviations (default 2.0)
Minimum distance between levels in % (default 0.8 %)
Maximum significant levels to display (15–80)
Use these horizontal maroon lines as potential future support/resistance zones that the market has previously shown strong willingness to defend.
Thank you to Melvin, LazyBear, and starbolt64 for the original work that made this automation possible.

Squeeze Momentum ProSQUEEZE MOMENTUM PRO - Enhanced Visual Dashboard
A modernized version of the TTM Squeeze Momentum indicator, designed for cleaner visual interpretation and faster decision-making.
═══════════════════════════════════════════
📊 WHAT IS THE SQUEEZE?
═══════════════════════════════════════════
The "squeeze" occurs when Bollinger Bands contract inside Keltner Channels, indicating extremely low volatility. This compression typically precedes explosive directional moves - the tighter the squeeze, the bigger the potential breakout.
John Carter's TTM Squeeze concept (from "Mastering the Trade") combines this volatility compression with momentum direction to identify high-probability setups.
═══════════════════════════════════════════
✨ WHAT'S NEW IN THIS VERSION
═══════════════════════════════════════════
🎯 VISUAL STATUS BAR
- Real-time squeeze state with clear labels
- Color-coded backgrounds (Red = Building, Green = Fired Bullish, Orange = Fired Bearish)
- Squeeze duration counter to gauge compression time
📊 ENHANCED HISTOGRAM
- 4-color momentum gradient (Strong Bull/Weak Bull/Weak Bear/Strong Bear)
- Instantly shows both direction AND strength
- Background shading for current market state
🔥 SQUEEZE INTENSITY GAUGE
- 5-dot pressure indicator showing compression tightness
- Percentage display of squeeze strength
- Only appears during active squeezes
📈 REAL-TIME METRICS PANEL
- Current momentum value
- Direction indicator (increasing/decreasing)
- Strength assessment (strong/weak)
🔔 COMPREHENSIVE ALERTS
- Squeeze started
- Squeeze fired (bullish/bearish)
- Momentum crossovers
═══════════════════════════════════════════
🎮 HOW TO USE
═══════════════════════════════════════════
1. WAIT FOR SQUEEZE
• Red status bar appears
• Intensity dots show compression level
• Longer duration = potentially bigger move
2. WATCH FOR RELEASE
• Status changes to "FIRED - BULLISH" or "FIRED - BEARISH"
• Histogram color confirms momentum direction
• Background highlights the event
3. MANAGE POSITION
• Monitor momentum strength in metrics panel
• Exit when histogram changes color (momentum reversal)
• Use with trend/volume confirmation
═══════════════════════════════════════════
⚙️ CUSTOMIZATION
═══════════════════════════════════════════
- Toggle status bar, metrics, intensity dots independently
- Adjustable BB/KC parameters
- Custom color schemes
- Show/hide squeeze duration
═══════════════════════════════════════════
🙏 CREDITS
═══════════════════════════════════════════
Original TTM Squeeze concept: John F. Carter
Original indicator code: LazyBear (@LazyBear)
This builds on LazyBear's excellent implementation of the TTM Squeeze Momentum indicator, adding modern visual elements and real-time dashboards for improved usability.
Original indicator: "Squeeze Momentum Indicator "
═══════════════════════════════════════════
⚠️ DISCLAIMER
═══════════════════════════════════════════
This indicator is for educational purposes. Always use proper risk management and combine with other forms of analysis. No indicator guarantees profitable trades.
═══════════════════════════════════════════
Best used on: Day trading timeframes (1m-15m) for momentum plays
Combine with: Volume analysis, trend filters, support/resistance levels

Realtime 5D Profile [LucF]█ OVERVIEW
This indicator displays a realtime profile that can be configured to visualize five dimensions: volume, price, time, activity and age. For each price level in a bar or timeframe, you can display total or delta volume or ticks. The tick count measures activity on a level. The thickness of each level's line indicates its age, which helps you identify the most recent levels.
█ WARNING
The indicator only works in real time. Contrary to TradingView's line of volume profile indicators , it does not show anything on historical bars or closed markets, and it cannot display volume information if none exists for the data feed the chart is using. A realtime indicator such as this one only displays information accumulated while it is running on a chart. The information it calculates cannot be saved on charts, nor can it be recalculated from historical bars. If you refresh the chart, or the script must re-execute for some reason, as when you change inputs, the accumulated information will be lost.
Because "Realtime 5D Profile" requires time to accumulate information on the chart, it will be most useful to traders working on small timeframes who trade only one instrument and do not frequently change their chart's symbol or timeframe. Traders working on higher timeframes or constantly changing charts will be better served by TradingView's volume profiles. Before using this indicator, please see the "Limitations" section further down for other important information.
█ HOW TO USE IT
Load the indicator on an active chart (see here if you don't know how).
The default configuration displays:
• A double-sided volume profile showing at what price levels activity has occurred.
• The left side shows "down" volume, the right side shows "up" volume.
• The value corresponding to each level is displayed.
• The width of lines reflects their relative value.
• The thickness of lines reflects their age. Four thicknesses are used, with the thicker lines being the most recent.
• The total value of down/up values for the profile appears at the top.
To understand how to use profiles in your trading, please research the subject. Searches on "volume profile" or "market profile" will yield many useful results. I provide you with tools — I do not teach trading. To understand more about this indicator, read on. If you choose not to do so, please don't ask me to answer questions that are already answered here, nor to make videos; I don't.
█ CONCEPTS
Delta calculations
Volume is slotted in up or down slots depending on whether the price of each new chart update is higher or lower than the previous update's price. When price does not move between chart updates, the last known direction is used. In a perfect world, Pine scripts would have access to bid and ask levels, as this would allow us to know for sure if market orders are being filled on upticks (at the ask) or downticks (at the bid). Comparing the price of successive chart updates provides the most precise way to calculate volume delta on TradingView, but it is still a compromise. Order books are in constant movement; in some cases, order cancellations can cause sudden movements of both the bid and ask levels such that the next chart update can occur on an uptick at a lower price than the previous one (or vice versa). While this update's volume should be slotted in the up slot because a buy market order was filled, it will erroneously be slotted in the down slot because the price of the chart's update is lower than that of the previous one. Luckily, these conditions are relatively rare, so they should not adversely affect calculations.
Levels
A profile is a tool that displays information organized by price levels. You can select the maximum quantity of levels this indicator displays by using the script's "Levels" input. If the profile's height is small enough for level increments to be less than the symbol's tick size, a smaller quantity of levels is used until the profile's height grows sufficiently to allow your specified quantity of levels to be displayed. The exact position of levels is not tethered to the symbol's tick increments. Activity for one level is that which happens on either side of the level, halfway between its higher or lower levels. The lowest/highest levels in the profile thus appear higher/lower than the profile's low/high limits, which are determined by the lowest/highest points reached by price during the profile's life.
Level Values and Length
The profile's vertical structure is dynamic. As the profile's height changes with the price range, it is rebalanced and the price points of its levels may be recalculated. When this happens, past updates will be redistributed among the new profile's levels, and the level values may thus change. The new levels where updates are slotted will of course always be near past ones, but keep this fluidity in mind when watching level values evolve.
The profile's horizontal structure is also dynamic. The maximum length of level lines is controlled by the "Maximum line length" input value. This maximum length is always used for the largest level value in the profile, and the length of other levels is determined by their value relative to that maximum.
Updates vs Ticks
Strictly speaking, a tick is the record of a transaction between two parties. On TradingView, these are detected on seconds charts. On other charts, ticks are aggregated to form a chart update . I use the broader "update" term when it names both events. Note that, confusingly, tick is also used to name an instrument's minimal price increment.
Volume Quality
If you use volume, it's important to understand its nature and quality, as it varies with sectors and instruments. My Volume X-ray indicator is one way you can appraise the quality of an instrument's intraday volume.
█ FEATURES
Double-Sided Profiles
When you choose one of the first two configuration selections in the "Configuration" field's dropdown menu, you are asking the indicator to display a double-sided profile, i.e., where the down values appear on the left and the up ones on the right. In this mode, the formatting options in the top section of inputs apply to both sides of the profile.
Single-Sided Profiles
The six other selections down the "Configuration" field's dropdown menu select single-sided profiles, where one side aggregates the up/down values for either volume or ticks. In this mode, the formatting options in the top section of inputs apply to the left profile. The ones in the following "Right format" section apply to the right profile.
Calculation Mode
The "Calculation" input field allows the selection of one of two modes which applies to single-sided profiles only. Values can represent the simple total of volume or ticks at each level, or their delta. The mode has no effect when a double-sided profile is used because then, the total is represented by the sum of the left and right sides. Note that when totals are selected, all levels appear in the up color.
Age
The age of each level is always displayed as one of four line thicknesses. Thicker lines are used for the youngest levels. The age of levels is determined by averaging the times of the updates composing that level. When viewing double-sided profiles, the age of each side is calculated independently, which entails you can have a down level on the left side of the profile appear thinner than its corresponding up side level line on the right side because the updates composing the up side are more recent. When calculating the age of single-sided profiles, the age of the up/down values aggregated to calculate the side are averaged. Since they may be different, the averaged level ages will not be as responsive as when using a double-sided profile configuration, where the age of levels on each side is calculated independently and follows price action more closely. Moreover, when displaying two single-sided profiles (volume on one side and ticks on the other), the age of both sides will match because they are calculated from the same realtime updates.
Profile Resets
The profile can reset on timeframes or trend changes. The usual timeframe selections are available, including the chart's, in which case the profile will reset on each new chart bar. One of two trend detection logics can be used: Supertrend or the one used by LazyBear in his Weis Wave indicator . Settings for the trend logics are in the bottommost section of the inputs, where you can also control the display of trend changes and states. Note that the "Timeframe" field's setting also applies to the trend detection mechanism. Whatever the timeframe used for trend detection, its logic will not repaint.
Format
Formatting a profile for charts is often a challenge for traders, and this one is no exception. Varying zoom factors on your chart and the frequency of profile resets will require different profile formats. You can achieve a reasonable variety of effects by playing with the following input fields:
• "Resets on" controls how frequently new profiles are drawn. Spacing out profiles between bars can help make them more usable.
• "Levels" determines the maximum quantity of levels displayed.
• "Offset" allows you to shift the profile horizontally.
• "Profile size" affects the global size of the profile.
• Another "Size" field provides control over the size of the totals displayed above the profile.
• "Maximum line length" controls how far away from the center of the bar the lines will stretch left and right.
Colors
The color and brightness of levels and totals always allows you to determine the winning side between up and down values. On double-sided profiles, each side is always of one color, since the left side is down values and the right side, up values. However, the losing side is colored with half its brightness, so the emphasis is put on the winning side. When there is no winner, the toned-down version of each color is used for both sides. Single-sided profiles use the up and down colors in full brightness on the same side. Which one is used reflects the winning side.
Candles
The indicator can color candle bodies and borders independently. If you choose to do so, you may want to disable the chart's bars by using the eye icon near the symbol's name.
Tooltips
A tooltip showing the value of each level is available. If they do not appear when hovering over levels, select the indicator by clicking on its chart name. This should get the tooltips working.
Data Window
As usual, I provide key values in the Data Window, so you can track them. If you compare total realtime volumes for the profile and the built-in "Volume" indicator, you may see variations at some points. They are due to the different mechanisms running each program. In my experience, the values from the built-in don't always update as often as those of the profile, but they eventually catch up.
█ LIMITATIONS
• The levels do not appear exactly at the position they are calculated. They are positioned slightly lower than their actual price levels.
• Drawing a 20-level double-sided profile with totals requires 42 labels. The script will only display the last 500 labels,
so the number of levels you choose affects how many past profiles will remain visible.
• The script is quite taxing, which will sometimes make the chart's tab less responsive.
• When you first load the indicator on a chart, it will begin calculating from that moment; it will not take into account prior chart activity.
• If you let the script run long enough when using profile reset criteria that make profiles last for a long time, the script will eventually run out of memory,
as it will be tracking unmanageable amounts of chart updates. I don't know the exact quantity of updates that will cause this,
but the script can handle upwards of 60K updates per profile, which should last 1D except on the most active markets. You can follow the number of updates in the Data Window.
• The indicator's nature makes it more useful at very small timeframes, typically in the sub 15min realm.
• The Weis Wave trend detection used here has nothing to do with how David Weis detects trend changes.
LazyBear's version was a port of a port, so we are a few generations removed from the Weis technique, which uses reversals by a price unit.
I believe the version used here is useful nonetheless because it complements Supertrend rather well.
█ NOTES
The aggregated view that volume and tick profiles calculate for traders is a good example of one of the most useful things software can do for traders: look at things from a methodical, mathematical perspective, and present results in a meaningful way. Profiles are powerful because, if the volume data they use is of good enough quality, they tell us what levels are important for traders, regardless of the nature or rationality of the methods traders have used to determine those levels. Profiles don't care whether traders use the news, fundamentals, Fib numbers, pivots, or the phases of the moon to find "their" levels. They don't attempt to forecast or explain markets. They show us real stuff containing zero uncertainty, i.e., what HAS happened. I like this.
The indicator's "VPAA" chart name represents four of the five dimensions the indicator displays: volume, price, activity and age. The time dimension is implied by the fact it's a profile — and I couldn't find a proper place for a "T" in there )
I have not included alerts in the script. I may do so in the future.
For the moment, I have no plans to write a profile indicator that works on historical bars. TradingView's volume profiles already do that, and they run much faster than Pine versions could, so I don't see the point in spending efforts on a poor ersatz.
For Pine Coders
• The script uses labels that draw varying quantities of characters to break the limitation constraining other Pine plots/lines to bar boundaries.
• The code's structure was optimized for performance. When it was feasible, global arrays, "input" and other variables were used from functions,
sacrificing function readability and portability for speed. Code was also repeated in some places, to avoid the overhead of frequent function calls in high-traffic areas.
• I wrote my script using the revised recommendations in the Style Guide from the Pine v5 User Manual.
█ THANKS
• To Duyck for his function that sorts an array while keeping it in synch with another array.
The `sortTwoArrays()` function in my script is derived from the Pine Wizard 's code.
• To the one and only Maestro, RicardoSantos , the creative volcano who worked hard to write a function to produce fixed-width, figure space-padded numeric values.
A change in design made the function unnecessary in this script, but I am grateful to you nonetheless.
• To midtownskr8guy , another Pine Wizard who is also a wizard with colors. I use the colors from his Pine Color Magic and Chart Theme Simulator constantly.
• Finally, thanks to users of my earlier "Delta Volume" scripts. Comments and discussions with them encouraged me to persist in figuring out how to achieve what this indicator does.

+ WaveTrend OscillatorI'm guessing most of you are familir with LazyBear's adaptation of the Wavetrend Oscillator; it's one of the most popular indicators on TradingView. I know others have done adaptations of it, but I thought I might as well, because that's kind of a thing I like doing.
In this version I've added a second Wavetrend plot. This is a thing I like to do. The longer plot gives you a longer timeframe momentum bias, and the shorter plot gives you entries and/or exits. Here we have one plot with a lookback period of 55, and another with the default set to 6 (change this to 14 if you think you might prefer something slower and that will plot similarly to the default RSI settings). With the traditional Wavetrend Oscillator there is a simple moving average on the WTO that is to help provide entries and exits. I've done away with this as there are already two plots, and I felt more would just clutter the indicator. Instead of plotting the SMA I've plotted the crosses along the bottom and top of the indicator. Also, as is not the case in LazyBear's version, this SMA length is adjustable. By default it is set to 3, which is the default setting on the original indicator.
I've also plotted background colors for when there is what I call a momentum shift. If one or the other oscillators crosses the centerline a colored bar is plotted. By default it is turned on for both WTOs, though in practice you might only want it on for the longer one.
I would say use of the indicator is similar to the original WTO or many other oscillators. Buying oversold and selling overbought, but being mindful of the momentum of the market. If the longer WTO is above the centerline it's best to be looking for dips to the centerline, or for an overbought signal by the faster WTO, and vice versa if the longer WTO is below the centerline. That said, you can also adjust the length of the SMA on the faster WTO to fine tune entries or exits, which is kind of how you would trade LazyBear's version. In this case you have that additional confirmation of market momentum.
You can set colored candles to either of the WTO plots via a dropdown menu.
There are alerts for overbought and oversold situations, centerline crosses, and Wavetrend crosses.
That's about it. Hope you enjoy this particular implementation of LazyBear's well known indicator.
Ah yes, last thing: Original version the source is set to hlc3. I've given you the opportunity to change that, so if you prefer using close you can, or whatever you want.

WWV_LB zigzag pivot fix jayyThis is a zigzag version of LazyBear's WWV_LB. In order to plot the WWV_LB as a zigzag, it made sense to me to set the zigzag pivot at the true WWV_LB low or high pivot bars as opposed to the "pivot" bars plotted by the original WWV_LB script. The pivot point identified in the WWV_LB script is actually the point at which a wave reversal is confirmed as opposed to the true script pivot point. Confirmation of a wave reversal can, at times, lag the true pivot by a few bars especially as trendDetectionLength values increase above "1". The WWV_LB script calculates cumulative volume from wave reversal confirmation bar to wave reversal confirmation bar as opposed to the actual/true WWV_LB reversal pivot bar to reversal pivot bar. As such the waves plotted by the original and this pivot fixed scripts not only look slightly different but can also have different cumulative volumes. Confirmation of a wave reversal can lag a few bars behind the true pivot point.
The following critical lines of the original WWV_LB script determine when a wave reverses, both the true pivot and the confirmation point:mov = close>close ? 1 : close
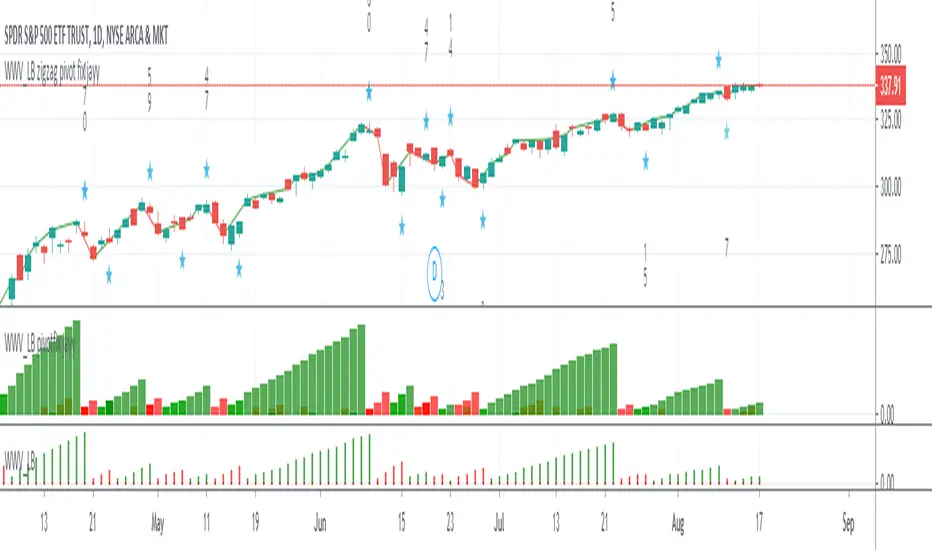
TA-Money Flow-Version4Updated for TV-Pine V4
This is the MACD of a stochastic OBV movement indicator and now the MACD of the Squeeze Momentum Indicator. It is good (right) to work with both price and volume...it is also good to utilize the most popular indicator ever in TV (Lazybear).
I've included highlighting based on price divergence, yellow is divergence of either OBV or SQZ, red is both divergence, and then I've also built in the "squeeze on - blue" highlighting to show follow through of divergence. It works great on any time frame, but you need to have volume data. Not sure where I originally got this (stoch-OBV, somewhere off Tradingview several years ago, thanks to the person who shared), Squeeze is Lazybear, links below.
Enjoy.
Version 4:
Updated OBV equation because TV-Pine V3 broke in V4
Included MACD of Squeeze for histogram
Included "squeeze on" highlighting
TA-Money-Flow-Version3
TA-Money-Flow-Version2
Squeeze-Momentum-Indicator-LazyBear
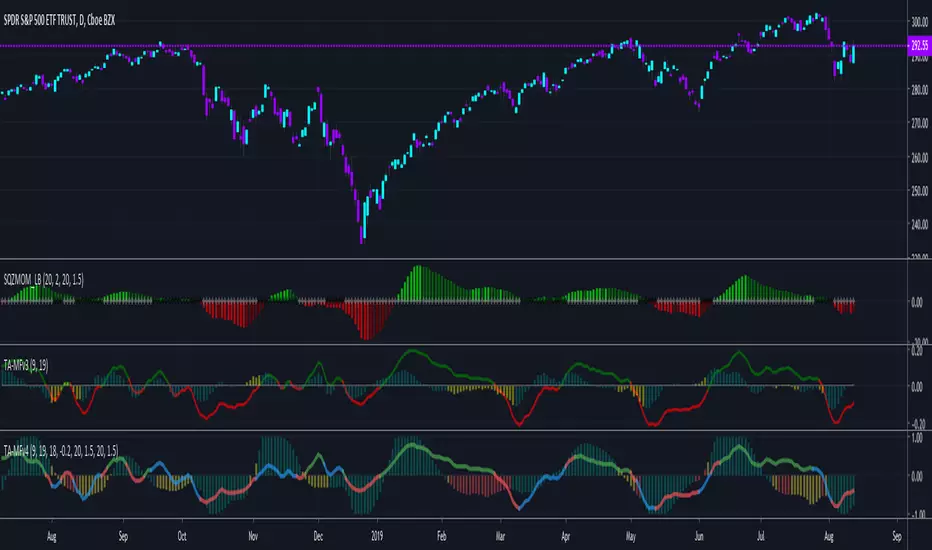
Squeeze Momentum + Volatility [LeonidasCrypto]Based on Squeeze Momentum indicator by LazyBear
This custom version of SQ is part of my Trading System.
How to use it.
Please read the description of the original author of this indicator here.
Volatility .
When the market is contracting or sideways usually you will see red or blue dots.
Blue dots. the market is in sideways and the volatility is low.
Red dots. the market is in the climax of volatility usually after of a big move this is a potential signal the peak of the move is near.
I added volatility to SQ because I consider volatility is a key factor for trading to anticipate the moves.

888 BOT #alerts█ 888 BOT #alerts (open source)
This is an Expert Advisor 'EA' or Automated trading script for ‘longs’ and ‘shorts’, which uses only a Take Profit or, in the worst case, a Stop Loss to close the trade.
It's a much improved version of the previous ‘Repanocha’. It doesn`t use 'Trailing Stop' or 'security ()' functions (although using a security function doesn`t mean that the script repaints) and all signals are confirmed, therefore the script doesn`t repaint in alert mode and is accurate in backtest mode.
Apart from the previous indicators, some more and other functions have been added for Stop-Loss, re-entry and leverage.
It uses 8 indicators, (many of you already know what they are, but in case there is someone new), these are the following:
1. Jurik Moving Average
It's a moving average created by Mark Jurik for professionals which eliminates the 'lag' or delay of the signal. It's better than other moving averages like EMA , DEMA , AMA or T3.
There are two ways to decrease noise using JMA . Increasing the 'LENGTH' parameter will cause JMA to move more slowly and therefore reduce noise at the expense of adding 'lag'
The 'JMA LENGTH', 'PHASE' and 'POWER' parameters offer a way to select the optimal balance between 'lag' and over boost.
Green: Bullish , Red: Bearish .
2. Range filter
Created by Donovan Wall, its function is to filter or eliminate noise and to better determine the price trend in the short term.
First, a uniform average price range 'SAMPLING PERIOD' is calculated for the filter base and multiplied by a specific quantity 'RANGE MULTIPLIER'.
The filter is then calculated by adjusting price movements that do not exceed the specified range.
Finally, the target ranges are plotted to show the prices that will trigger the filter movement.
Green: Bullish , Red: Bearish .
3. Average Directional Index ( ADX Classic) and ( ADX Masanakamura)
It's an indicator designed by Welles Wilder to measure the strength and direction of the market trend. The price movement is strong when the ADX has a positive slope and is above a certain minimum level 'ADX THRESHOLD' and for a given period 'ADX LENGTH'.
The green color of the bars indicates that the trend is bullish and that the ADX is above the level established by the threshold.
The red color of the bars indicates that the trend is down and that the ADX is above the threshold level.
The orange color of the bars indicates that the price is not strong and will surely lateralize.
You can choose between the classic option and the one created by a certain 'Masanakamura'. The main difference between the two is that in the first it uses RMA () and in the second SMA () in its calculation.
4. Parabolic SAR
This indicator, also created by Welles Wilder, places points that help define a trend. The Parabolic SAR can follow the price above or below, the peculiarity that it offers is that when the price touches the indicator, it jumps to the other side of the price (if the Parabolic SAR was below the price it jumps up and vice versa) to a distance predetermined by the indicator. At this time the indicator continues to follow the price, reducing the distance with each candle until it is finally touched again by the price and the process starts again. This procedure explains the name of the indicator: the Parabolic SAR follows the price generating a characteristic parabolic shape, when the price touches it, stops and turns ( SAR is the acronym for 'stop and reverse'), giving rise to a new cycle. When the points are below the price, the trend is up, while the points above the price indicate a downward trend.
5. RSI with Volume
This indicator was created by LazyBear from the popular RSI .
The RSI is an oscillator-type indicator used in technical analysis and also created by Welles Wilder that shows the strength of the price by comparing individual movements up or down in successive closing prices.
LazyBear added a volume parameter that makes it more accurate to the market movement.
A good way to use RSI is by considering the 50 'RSI CENTER LINE' centerline. When the oscillator is above, the trend is bullish and when it is below, the trend is bearish .
6. Moving Average Convergence Divergence ( MACD ) and ( MAC-Z )
It was created by Gerald Appel. Subsequently, the histogram was added to anticipate the crossing of MA. Broadly speaking, we can say that the MACD is an oscillator consisting of two moving averages that rotate around the zero line. The MACD line is the difference between a short moving average 'MACD FAST MA LENGTH' and a long moving average 'MACD SLOW MA LENGTH'. It's an indicator that allows us to have a reference on the trend of the asset on which it is operating, thus generating market entry and exit signals.
We can talk about a bull market when the MACD histogram is above the zero line, along with the signal line, while we are talking about a bear market when the MACD histogram is below the zero line.
There is the option of using the MAC-Z indicator created by LazyBear, which according to its author is more effective, by using the parameter VWAP ( volume weighted average price ) 'Z-VWAP LENGTH' together with a standard deviation 'STDEV LENGTH' in its calculation.
7. Volume Condition
Volume indicates the number of participants in this war between bulls and bears, the more volume the more likely the price will move in favor of the trend. A low trading volume indicates a lower number of participants and interest in the instrument in question. Low volumes may reveal weakness behind a price movement.
With this condition, those signals whose volume is less than the volume SMA for a period 'SMA VOLUME LENGTH' multiplied by a factor 'VOLUME FACTOR' are filtered. In addition, it determines the leverage used, the more volume , the more participants, the more probability that the price will move in our favor, that is, we can use more leverage. The leverage in this script is determined by how many times the volume is above the SMA line.
The maximum leverage is 8.
8. Bollinger Bands
This indicator was created by John Bollinger and consists of three bands that are drawn superimposed on the price evolution graph.
The central band is a moving average, normally a simple moving average calculated with 20 periods is used. ('BB LENGTH' Number of periods of the moving average)
The upper band is calculated by adding the value of the simple moving average X times the standard deviation of the moving average. ('BB MULTIPLIER' Number of times the standard deviation of the moving average)
The lower band is calculated by subtracting the simple moving average X times the standard deviation of the moving average.
the band between the upper and lower bands contains, statistically, almost 90% of the possible price variations, which means that any movement of the price outside the bands has special relevance.
In practical terms, Bollinger bands behave as if they were an elastic band so that, if the price touches them, it has a high probability of bouncing.
Sometimes, after the entry order is filled, the price is returned to the opposite side. If price touch the Bollinger band in the same previous conditions, another order is filled in the same direction of the position to improve the average entry price, (% MINIMUM BETTER PRICE ': Minimum price for the re-entry to be executed and that is better than the price of the previous position in a given %) in this way we give the trade a chance that the Take Profit is executed before. The downside is that the position is doubled in size. 'ACTIVATE DIVIDE TP': Divide the size of the TP in half. More probability of the trade closing but less profit.
█ STOP LOSS and RISK MANAGEMENT.
A good risk management is what can make your equity go up or be liquidated.
The % risk is the percentage of our capital that we are willing to lose by operation. This is recommended to be between 1-5%.
% Risk: (% Stop Loss x % Equity per trade x Leverage) / 100
First the strategy is calculated with Stop Loss, then the risk per operation is determined and from there, the amount per operation is calculated and not vice versa.
In this script you can use a normal Stop Loss or one according to the ATR. Also activate the option to trigger it earlier if the risk percentage is reached. '% RISK ALLOWED' wich is calculated according with: '%EQUITY ON EACH ENTRY'. Only works with Stop Loss on 'NORMAL' or 'BOTH' mode.
'STOP LOSS CONFIRMED': The Stop Loss is only activated if the closing of the previous bar is in the loss limit condition. It's useful to prevent the SL from triggering when they do a ‘pump’ to sweep Stops and then return the price to the previous state.
█ ALERTS
There is an alert for each leverage, therefore a maximum of 8 alerts can be set for 'long' and 8 for 'short', plus an alert to close the trade with Take Profit or Stop Loss in market mode. You can also place Take Profit limit and Stop Loss limit orders a few seconds after filling the position entry order.
- 'MAXIMUM LEVERAGE': It is the maximum allowed multiplier of the % quantity entered on each entry for 1X according to the volume condition.
- 'ADVANCE ALERTS': There is always a time delay from when the alert is triggered until it reaches the exchange and can be between 1-15 seconds. With this parameter, you can advance the alert by the necessary seconds to activate it earlier. In this way it can be synchronized with the exchange so that the execution time of the entry order to the position coincides with the opening of the bar.
The settings are for Bitcoin at Binance Futures (BTC: USDTPERP) in 15 minutes.
For other pairs and other timeframes, the settings have to be adjusted again. And within a month, the settings will be different because we all know the market and the trend are changing.

[e2] EDS Key & AvwapThis indicator shows a Key Level Support & Resistance level and VWAP that resets on your choice of the stock's Earnings , Dividends or Splits release date.
A maximum of 8 bands calculated using a factor of the anchored VWAP's standard deviation can be displayed.
Note
The script is designed for stock-trading only.
Credits
Inspired by timwest , LazyBear 's Earnings S/R Levels and MichelT 's Earnings, Splits, Dividends scripts.

On Balance Volume Oscillator + Bollinger Bands [SigmaDraconis]On Balance Volume (OBV) Oscillator with Bollinger Bands (BB).
Inspired by @LazyBear OBV Oscillator (link below)
Added BB to the oscillator and colored the OBV line yellow when it's outside the bands' limits, useful for finding over-extended zones where price reversals have higher probability of happening.
BB bands can be deactivated and the oscillator can be used as originally built by LazyBear if the BB bands are disabled and the OBV area activated.
Finding divergences helps increasing price behavior predictability too.
BB area is colored green when OBV is above the 20-period moving average and colored red when below it. This can be deactivated on the options to use regular BB colors or no BB at all.
If you like it and use it to profit, please tip me below :)
Tip jars:
BTC: 15nMBiEGVrdGcu9C1h6QRcTNRvugHkqrMQ
ETH: 0xC33845946c48B61fBCbEA0367ec2238CaF2b73bc
BTS: sigma-draconis
OBV Oscillator from LazyBear -

Spicytrader V4 [LONG and SHORT signals + Trendline]NEW VERSION : JUNE 2018
LONG and SHORT signals (with alerts)
Trendline : Bullish and bearish market (with alerts)
Compatible with Autoview bot (Open Long/Short)
Working with 1min* interval and more (1min to Month)
TRY IT FOR FREE : spicytrader.com
* Market has to be enough volatile to use it with 1min interval (Ok with ETHER for instance).
Use these scripts together to maximize profit
Spicytrader V4
Squeeze Momentum Indicator
Pivot Point High Low
How to use the script
Add the scripts to your chart
Select a time interval from 1min to 1 month which shows great trends (Multiple following colored candles)
Don't go if trends are not well defined
LONG position
The BLUE* candle is CLOSED and BULLISH (Green candle)
Squeeze Momentum Indicator is BULLISH
Trendline is BULLISH (Green)
Candle close above Trendline
Pivot Points are below or far enough
Don't go if trends are not well defined
* Dark blue is a strong buy signal
* Ligh blue is a weak buy signal but can be ok depending of the market
SHORT position
The YELLOW candle is CLOSED and BEARISH (Red candle)
Squeeze Momentum Indicator is BEARISH
Trendline is BEARISH (Red)
Candle close bellow Trendline
Pivot Points are above or far enough
Don't go if trends are not well defined
When to close a trade ?
Trend is over (New closed candle is NOT colored)
or Market direction is changing
or Pivot Point is reached and failed to cross
or You feel it
WARNING :
The purpose of these signals is to HELP/SUPPORT you to take a decision.
You need to analyse the general trend before placing an order.
Don't trust FOMO or FUD and do your own research
TRY IT FOR FREE : spicytrader.com
TRY IT FOR FREE : spicytrader.com
TRY IT FOR FREE : spicytrader.com
How to use it with Autoview
Add an alert (OPEN LONG or OPEN SHORT) and set it to "Once Per bar Closed" in order to place an order after the confirmation.
Refer to the official website (Autoview) bit.ly to get more information.
