스크립트에서 "GOLD"에 대해 찾기
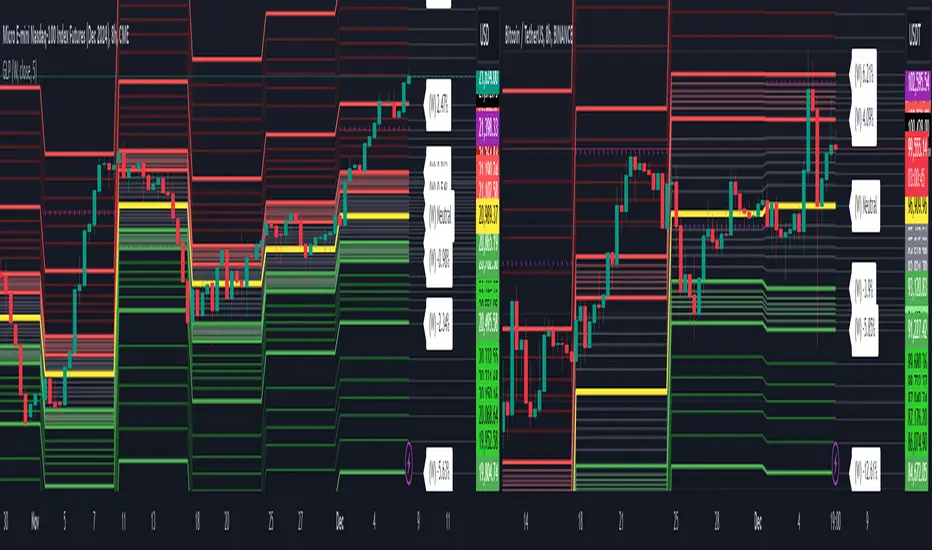
Golden Pocket Syndicate [GPS]Golden Pocket Syndicate is a multi-layered market analysis toolkit built for precision entries and sniper-style reversals in both trending and ranging conditions. The script fuses volume dynamics, golden pocket structures, market maker behavior, and liquidation cluster tracking into one high-confluence system.
Core Features:
• 📐 Golden Pocket Zones: Dynamic GP levels from daily, weekly, monthly, and yearly timeframes. These levels update in real-time and serve as confluence zones for entries and exits.
• 📊 WaveTrend Divergence Diamonds: Momentum shifts are detected using a custom filtered WaveTrend cross system to mark high-probability reversal conditions.
• 🧠 Market Maker Premium Divergence: Tracks price dislocation between CME and Binance to detect large player manipulation using a configurable premium threshold.
• 💎 MM Reversal Diamonds: Identifies potential market maker traps and large player pivots using historical candle behavior, EMA alignment, and price structure breaks.
• 📉 Stealth Liquidation Cluster Arrows: Volume-based liquidation pressure visualized as lightweight directional arrows based on calculated wick expansion and volume bursts. Highlights key zones where price is likely to bounce or reject.
• 🧭 Trend Validation: Uses volume-based trend conditions and short-term EMA positioning to further qualify signals and eliminate noise.
How to Use:
This indicator is designed to help traders visualize confluence between key institutional price levels, momentum shifts, and volume-based pressure points. Long/short opportunities can be explored at marked reversal diamonds or liquidation zones that align with key GP levels. Intended for use on higher timeframes (15m to 4H), though flexible across any pair or market.

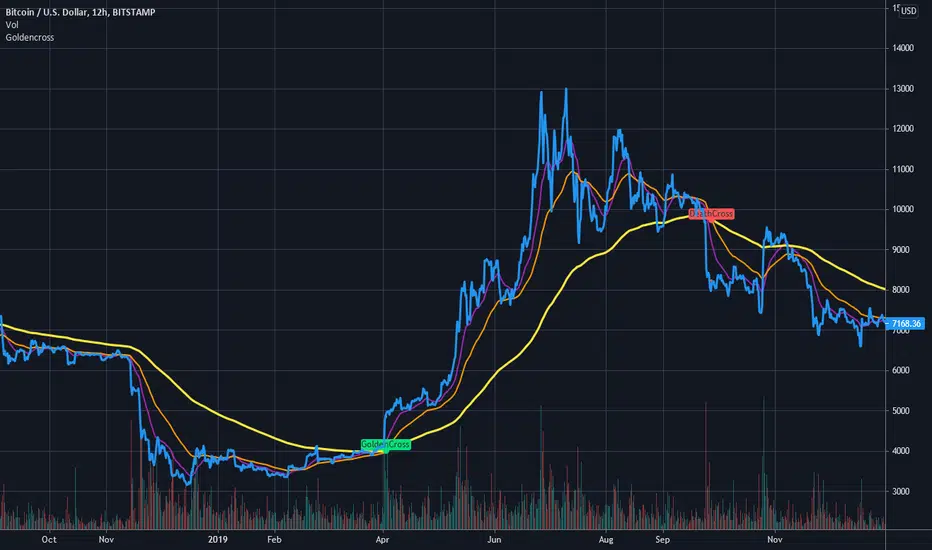
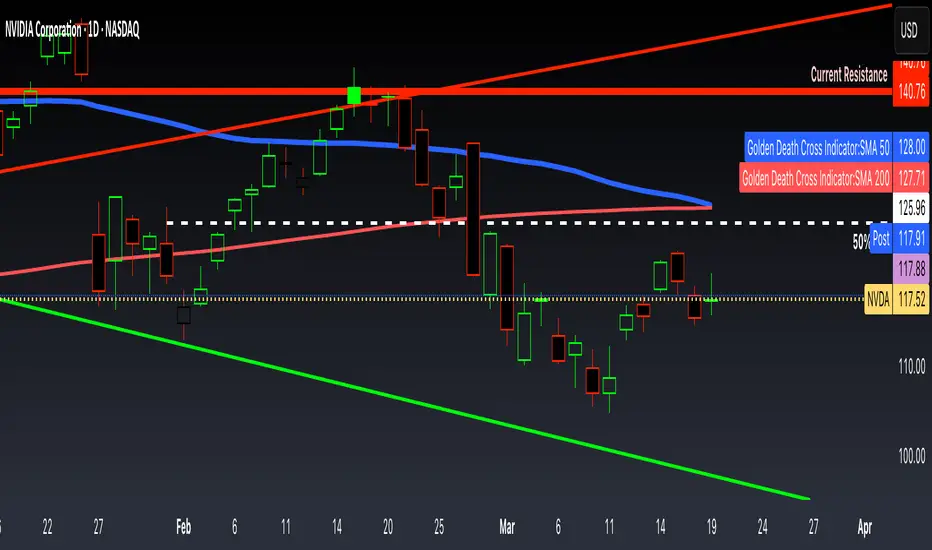
Golden/Death Cross Predictor (by Alex L.)Golden/Death Cross indicator to picture if we're in a Bull or Bear trend, but it's much more - it indicates a potential upcoming golden/death cross, draws a potential continuation of the moving averages to indicate when it might occur, shows a 4-hourly cross which can often alert of a potential trend reversal, and is multi timeframe!
Potential Golden/Death Cross Mark - shows a potential upcoming golden/death cross (with approximate % for its occurrence as a hint).
Potential Golden/Death Cross Projection - shows a potential continuation of the MAs to visually illustrate when the potential cross might occur.
Actual Golden/Death Cross Mark - all previous golden/death crosses are marked on chart with a green/red "X" (which is when indicator's "Short Term MA" crosses "Long Term MA" up or down).
Actual 4-hourly Golden/Death Cross Mark - shows latest golden/death cross on 4-hourly timeframe (regardless of chart's timeframe), which can alert of potential higher timeframe trend reversal.
Multi Timeframe - you can set indicator's timeframe having chart in different timeframe.
Enjoy!


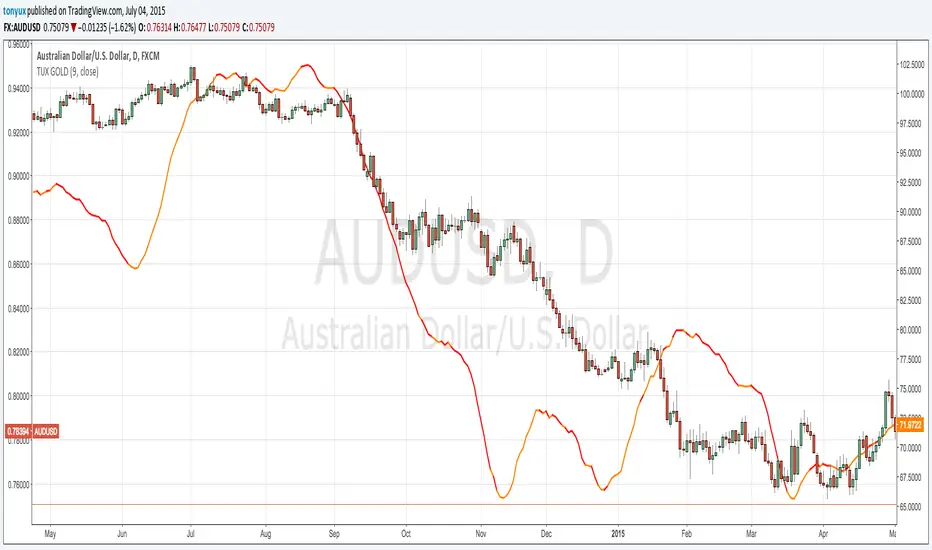
Gold Price Trend Overlay This chart overlay provides the daily 9 SMA of Gold.
If the price of GOLD is ABOVE the 9 SMA then the line will be GOLD
If the price of GOLD is BELOW the 9 SMA then the line will be RED
A good way to use this overlay is by understanding how Gold effects currency pairs.
if GOLD is BULLISH - then AUD/USD is BULLISH
if GOLD is BULLISH - then NZD/USD is BULLISH
if GOLD is BULLISH - then EUR/USD is BULLISH
if GOLD is BULLISH - then USD is bearish
if GOLD is BULLISH - then USD/CHF is BEARISH
if GOLD is BULLISH - then USD/CAD is BEARISH

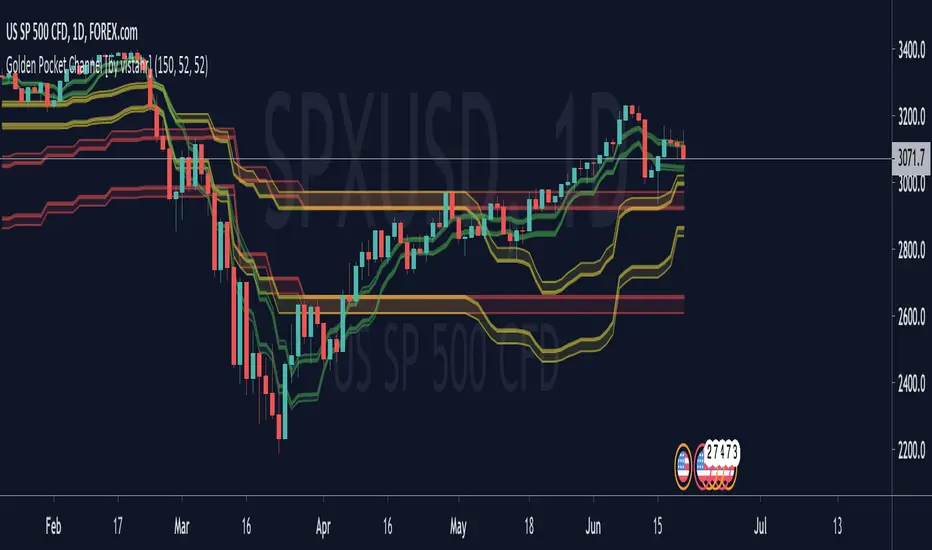
Golden Pocket Channel [by vistahr]The indicator plots the golden pocket (Fibonacci retracement 61% to 65%) of recent highs and lows. The golden pocket is calculated from the last high to the last low. The high and low are determined by the number of last bars.
The golden pocket is used for trading as support and resistance.
The length of the past highs and lows can be determined by yourself. You can define three different lengths to find the highs and lows of the past.
GoldenPocket & CRT IndicatorWith this script, you will be able to see Golden Pocket Fibonacci Levels and Candle Range Theory Highs, Lows and EQs.
You can set lookback bar numbers to define Fibonacci highs and lows.
You can set CRT High Time-frame.
Simple and effective script. Please let me know if you have any comments and support me if you like it.

Goldies Wave Revision- Exponential Movin Average
- Tilson's T3 Moving Average
- 0.618 Golden ratio
- Fibonacci Retrenchment

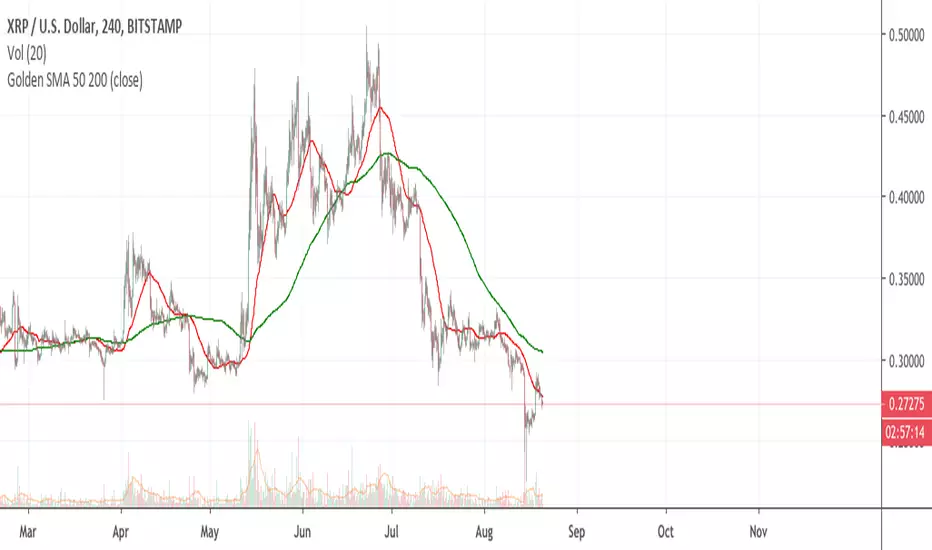
Golden Death Cross IndicatorThis indicator uses moving average to detect both a Golden Cross and Death Cross on any timeframe but is recommended for use on the daily and 24 hour timeframes only.
We have also provided instructions on how to create alerts for these indicators below.
Happy Trading!
Moving Averages: We’ll use Simple Moving Averages (SMA). The 50-day SMA looks at the average price over the last 50 periods, and the 200-day SMA does the same for 200 periods.
Crossovers: We’ll check when the 50-day SMA crosses above (Golden Cross) or below the 200-day SMA (Death Cross).
Set Up Alerts
Now, let’s make sure you get notified when a cross happens:
Open the Alerts Menu
On the chart, click the bell icon (top right of the screen) to create an alert.
Configure the Golden Cross Alert
In the “Condition” dropdown, select “Cross Alerts” (the name of your script).
Below that, select “Golden Cross.”
Set “Once Per Bar Close” in the next dropdown (this ensures it only triggers after the period ends, avoiding false signals mid-bar).
Choose how you want to be notified (e.g., popup, email, or phone app—set this under “Notifications”).
Name the alert (e.g., “Golden Cross Alert”) and click “Create.”
Configure the Death Cross Alert
Click the bell icon again to create a second alert.
Condition: “Cross Alerts” > “Death Cross.”
Set “Once Per Bar Close” again.
Choose your notification method.
Name it (e.g., “Death Cross Alert”) and click “Create.”
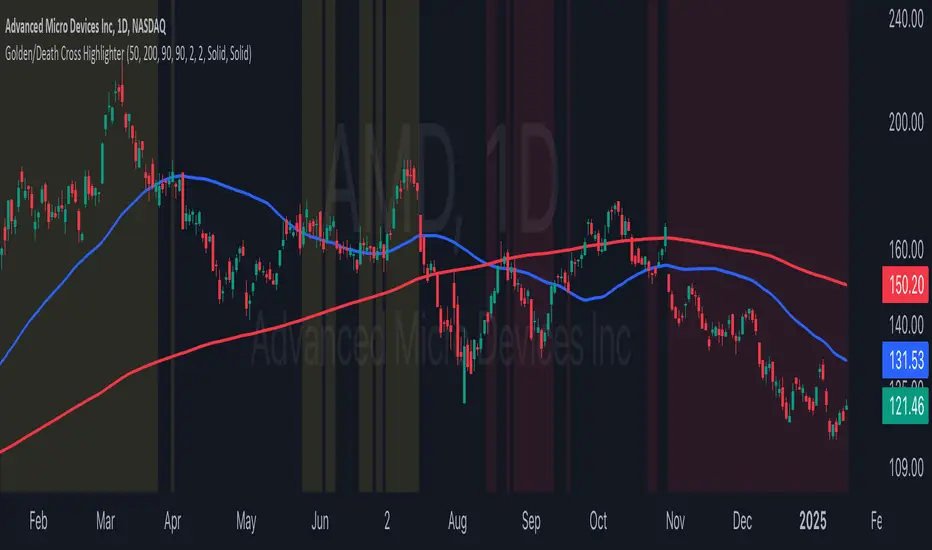
Golden/Death Cross HighlighterThis indicator helps you easily identify and visualize Golden Cross and Death Cross patterns combined with price action confirmation. It highlights chart backgrounds when specific conditions are met, making it easy to spot potential trend changes.
🔑 Key Features:
Highlights Golden Cross conditions (50 SMA crosses above 200 SMA) when price closes above both MAs
Highlights Death Cross conditions (50 SMA crosses below 200 SMA) when price closes below both MAs
Customizable MA lengths (default: 50 and 200)
Adjustable highlight opacity
Built-in alerts for cross events
Clear visualization of both moving averages
📈 Color Guide:
Yellow Background: Golden Cross active + price above both MAs
Red Background: Death Cross active + price below both MAs
⚙️ Settings:
Fast MA Length: Length of faster moving average (default 50)
Slow MA Length: Length of slower moving average (default 200)
Golden Cross Highlight Opacity: Adjust visibility of bullish highlights
Death Cross Highlight Opacity: Adjust visibility of bearish highlights
💡 Usage Tips:
Use in combination with other indicators for confirmation
Set up alerts for potential trend changes
Adjust opacity to match your chart style
Works best on higher timeframes (4H, Daily, Weekly)
Golden & Death Cross with Re-Activation [By Oberlunar]🎄 Merry Christmas to All Traders! 🎄
Let me introduce you to a practical and customizable classic tool: the Golden & Death Cross with Re-Activation. This script is designed to help you navigate the markets with precision and adaptability.
Why Is This Script Important?
1. Customizable Moving Averages
You can choose from SMA, EMA, WMA, HMA, or RMA for both moving averages. This flexibility allows you to tailor the strategy to fit different markets and trading styles.
2. Smart Signal Handling
The script generates Golden Cross (LONG) and Death Cross (SHORT) signals while deactivating them automatically when the moving averages start to converge, avoiding unnecessary noise.
3. Reactivation Based on Distance Threshold
With the treshold parameter, signals are reactivated only when the moving averages move apart sufficiently, ensuring that the signals remain meaningful and not just random market noise.
What Are These Moving Averages?
SMA (Simple Moving Average),
EMA (Exponential Moving Average),
WMA (Weighted Moving Average),
HMA (Hull Moving Average),
RMA (Relative Moving Average)
Community Input
We invite you to test this script on various markets (forex, stocks, crypto) and share your insights:
Which moving average combination works best for EUR/USD?
How about BTC/USD?
Does the treshold make a noticeable difference?
Let us know in the comments!
Example Settings
MA 1 Type: HMA, Length: 21
MA 2 Type: HMA, Length: 200
Reactivation Threshold: 0.5
Experiment with it, and let us know your findings.
Wishing you a calm holiday season and a profitable new year ahead! 🎁
🎄 Merry Christmas and Happy Trading! 🎄

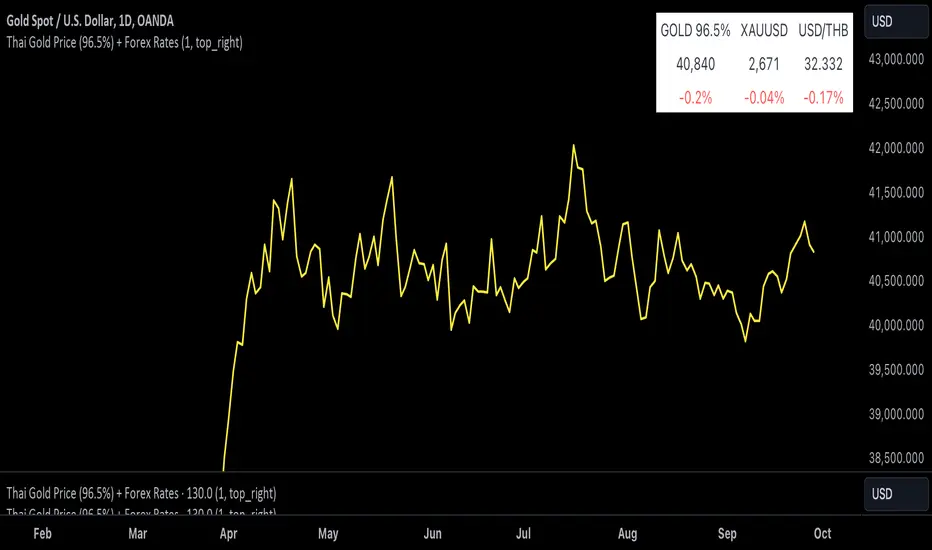
Thai Gold 96.5%Gold 96.5% Price Display (Test Version)
This Pine Script indicator is a test version designed to display the current price of Thai gold (96.5%) in a customizable table on your TradingView chart. The script calculates the gold price using the latest values for XAU/USD and USD/THB, reflecting the price of gold in Thai Baht (THB) with a purity adjustment.
Features:
- Price Calculation: Computes the Thai gold price by multiplying the XAU/USD price with USD/THB and adjusting for gold purity (0.49 * 0.965).
- Customizable Display: Adjust text size, text color, background color, and table position (Top Right, Top Left, Bottom Right, Bottom Left).
- Formatted Output: Gold price is formatted with commas for better readability.
Inputs:
- Text Size: Choose from tiny, small, normal, large, or huge.
- Text Color: Customize the text color.
- Background Color: Select a background color for the table.
- Table Position: Choose the table position on the chart.
Usage:
Add this test script to your TradingView chart to see the current Thai gold price displayed in a table format. This version is for testing purposes and may be updated based on feedback.
Feel free to test and customize the script further!
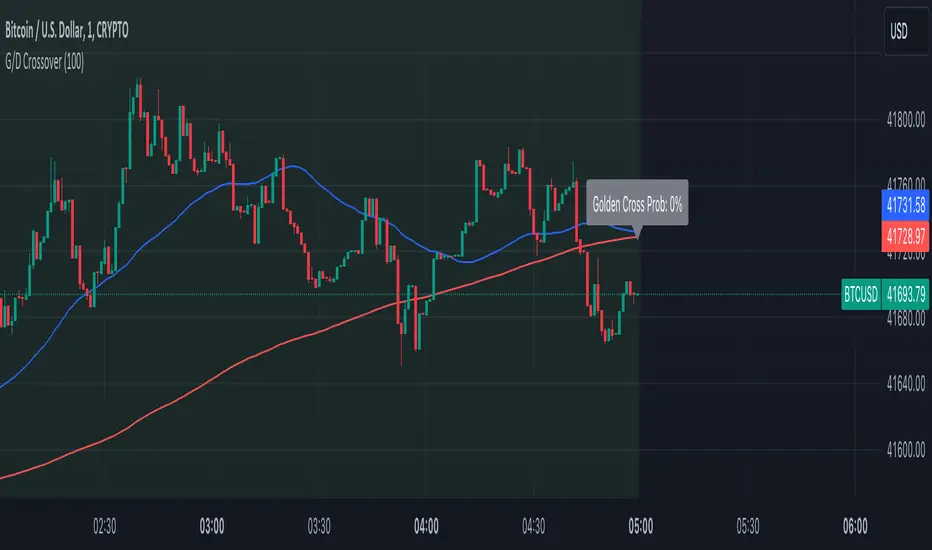
Golden Cross and Death Cross with ProbabilityThe Advanced Golden and Death Crossover Indicator offers traders a powerful tool for identifying potential buy and sell signals through the classic technical analysis method of moving average crossovers. This script enhances decision-making by dynamically changing the chart background color in response to Golden (bullish) and Death (bearish) crossovers, providing a visual representation of the market's momentum.
Features:
Golden and Death Crossover Detection: Utilizes a 50-period SMA and a 200-period SMA to identify potential buy (golden cross) and sell (death cross) points.
Continuous Background Coloring: Changes the chart's background color to green for golden crosses and red for death crosses, offering an intuitive grasp of market trends.
Customizable Lookback Period: Allows users to adjust the lookback period for calculating the success rate of each crossover, making the indicator adaptable to various trading strategies.
Success Rate Calculation: Provides an additional layer of analysis by calculating the historical success rate of crossovers within the specified lookback period.
Instructions:
Adding the Indicator: Search for "Advanced Golden and Death Crossover Indicator" in the TradingView Indicators & Strategies library and add it to your chart.
Customization: Access the indicator settings to adjust the lookback period according to your trading preferences.
Interpretation: Use the continuous background color as a guide to market conditions, with green indicating bullish momentum and red indicating bearish momentum. The success rate of past crossovers can help assess the reliability of the signals.
How the Script Works:
The Advanced Golden and Death Crossover Indicator operates by continuously monitoring two key moving averages (MAs) on your chart: a short-term (50-period) SMA and a long-term (200-period) SMA. Here's a step-by-step breakdown of its functionality:
Crossover Detection:
Golden Cross: When the short-term MA crosses above the long-term MA, indicating potential bullish momentum, the script identifies this as a Golden Cross signal.
Death Cross: Conversely, when the short-term MA crosses below the long-term MA, suggesting potential bearish momentum, the script flags this as a Death Cross signal.
Background Coloring:
Upon detecting a Golden Cross, the script changes the chart background to green, visually representing a bullish market condition.
Upon detecting a Death Cross, the chart background turns red, indicating bearish market conditions.
This color change remains in effect until the next crossover event, providing a continuous visual cue of the market's trend direction.
Success Rate Calculation:
The script calculates the historical success rate of these crossovers within a user-defined lookback period. This metric helps assess the reliability of the signals based on past performance.
Customization:
Users have the flexibility to adjust the lookback period for the success rate calculation, allowing for customization according to individual trading strategies and risk preferences.
Application in Trading Analysis:
Traders can use this indicator as part of their technical analysis toolkit to make informed decisions about entry and exit points. The visual cues from the continuous background coloring, combined with the success rate of past signals, provide a comprehensive overview of market trends and crossover reliability. It’s important for traders to combine this indicator with other analysis tools and consider broader market conditions to optimize their trading strategy.
Disclaimer:
This script is provided for educational and informational purposes only and should not be construed as investment advice. Trading involves risk, and you should conduct your own research or consult a financial advisor before making investment decisions. The author or distributor of this script bears no responsibility for any trading losses incurred by users.
Golden Level Predictions v1.0Golden Level Predictions (GLP) Trading Indicator
This script introduces a custom trading indicator named "GLP" tailored for the TradingView platform. It offers various price levels derived from Fibonacci calculations and other mathematical models, assisting traders in pinpointing potential overpriced and discounted price levels.
Key Features:
User Inputs : Users have the flexibility to select their desired timeframe, with options ranging from Weekly, Daily, Monthly, and more. Additionally, they can opt to showcase Fibonacci lines and the associated prices within these levels.
Price Level Calculations :
- Employs constants such as the Golden Ratio (PHI) and Pi (PI) to extract various multipliers and factors.
- Assesses if the current asset is a cryptocurrency and tweaks calculations accordingly.
- Determines overpriced and discounted price levels, drawing from the current open price and past data.
Fibonacci Levels :
- For each overpriced and discounted level, the script computes intermediary Fibonacci levels, including 23.6%, 38.2%, 50%, 61.8%, and 78.6% (the 3rd level is excluded due to plot limitations).
- These levels are illustrated on the chart, granting traders a more detailed view of price targets.
Visual Elements :
- Projects horizontal lines to the subsequent selected indicator interval for every calculated price level.
- Exhibits potential percentage gains or losses at each tier, indicating the prospective price alteration upon reaching that level.
- Differentiates overpriced (green) and discounted (red) levels using color codes. A neutral price is depicted in yellow.
Anticipated Close Calculation : Offers a projected closing price for the current timeframe, based on a myriad of factors.
This indicator is particularly effective with cryptocurrencies due to their inherent volatility. It's also compatible with stocks and is most efficient with tickers that provide volume data.
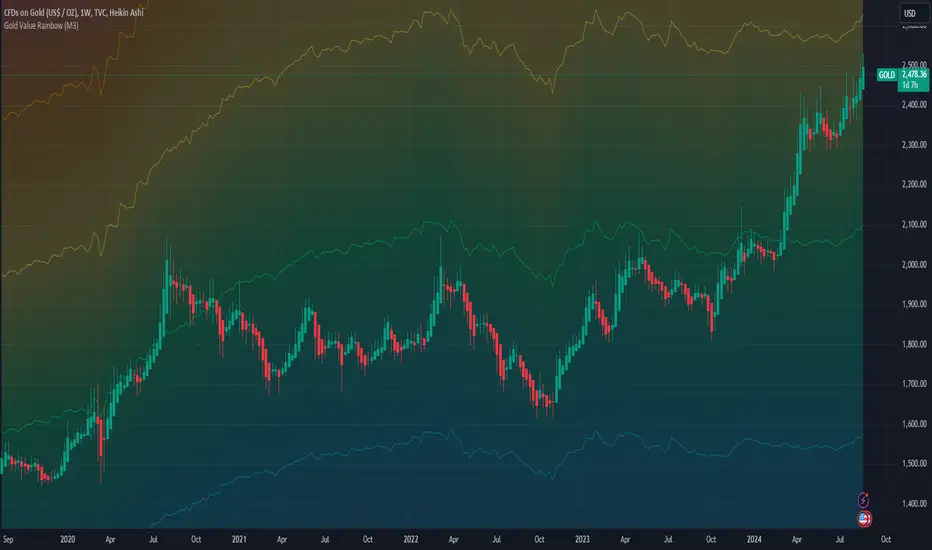
Gold Value RainbowThis indicator can only be used with 'GOLD' ticker. It is used to estimate Gold valuation based on major countries base money supply M0 such as US, EU, JP and CN. These 4 countries represent nearly 75% of total global money supply in the world. The chart will compare how gold value will move alongside with base money supply for comparison study. The chart presented here is just a relative comparison with some scaling and shifting so it doesn't refers to any real measurement. However it can be used to track gold price whether it's too cheap or too expensive in relative to money supply available in the market.
- The gray line represent major countries money supply M0
- The rainbow above the gray line represent the multiplication factors from 1x, 2x, ..., 10x
- The rainbow below the gray line represent the division factors from 0.8x, 0.6x, ..., 0.2x
Check other script to value stock and index:
- Stock Value Rainbow: script to value stock based on book value, earning, dividend and cash flow
- Index Value Rainbow: script to value index based on fed balance sheet and base money supply
- Gold Value Rainbow: script to value gold based on global money supply
- Stock Value US: script to check US stock value
- Stock Value EU: script to check EU stock value
- Stock Value JP: script to check JP stock value
- Stock Value CN: script to check CN stock value
Golden/Death Cross PredictionScript which calculates/predicts future golden/death cross times assuming the prices remains at configured level (-50% to +50% relative to current price)

Golden & Death CrossThis indicator allows you to see Golden Cross and Death Cross.
Each Sma line can be hidden.
It is for educational purposes only.
Enjoy it.
Best Regards,
Bilgin , Kaptanin Seyir Defteri

Golden Ratio MultiplesI call this "Phi Ribbons." The Golden Ratio, also known as Phi, is fantastic at predicting areas of price reversal.
Every moving average is a fibonacci multiple of the base function 355 SMA .
The rainbow above is an array of fibonacci multiples that are greater than one (1.618, 2, 2.618, 3, 5, 8, 13, 21)
The rainbow below is an array of fibonacci multiples that are less than one (0.786, 0.618, 0.5, 0.382, 0.236, 0.14)
Notice the precision of marking areas of potential price reversals
EASTER EGG: The two moving averages at the top of the script are 355 SMA & 113 SMA . This is one of the lowest ratios that closely approximates Pi (3.14159).
Simply plotting the 133 SMA will add a unique feature:
355/133 = 3.14159
When the 113 crosses below the 355 it tends to mark the end of major bullish impulses, and a crossover is a bullish sign.

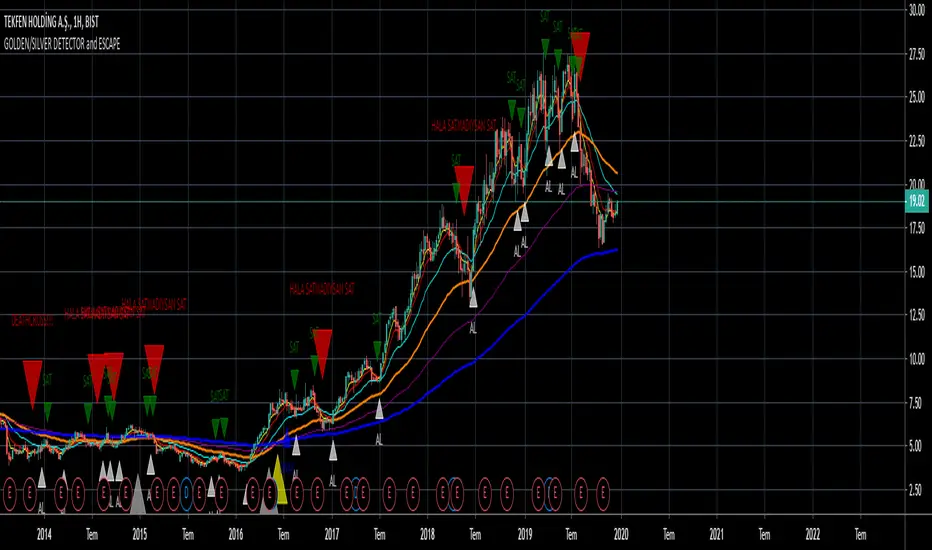
GOLDEN/SILVER DETECTORFind golden and silver crosses with using EMA.
Note
Colors are depends on you.
Translation
AL = BUY
SAT = SELL
ONAY = CONFIRMATION
Golden/Death X BF 🚀A golden cross occurs when the 50 MA crosses above the 200 MA.
A death cross occurs when the 50 MA crosses below the 200 MA.
You can adjust the following settings for each Moving Average:
Source - open, high, low, close, hl2, hlc3, ohlc4
Type - sma, ema, swma, wma
Period - integers greater than 0
The chart background turns green or red upon a cross.