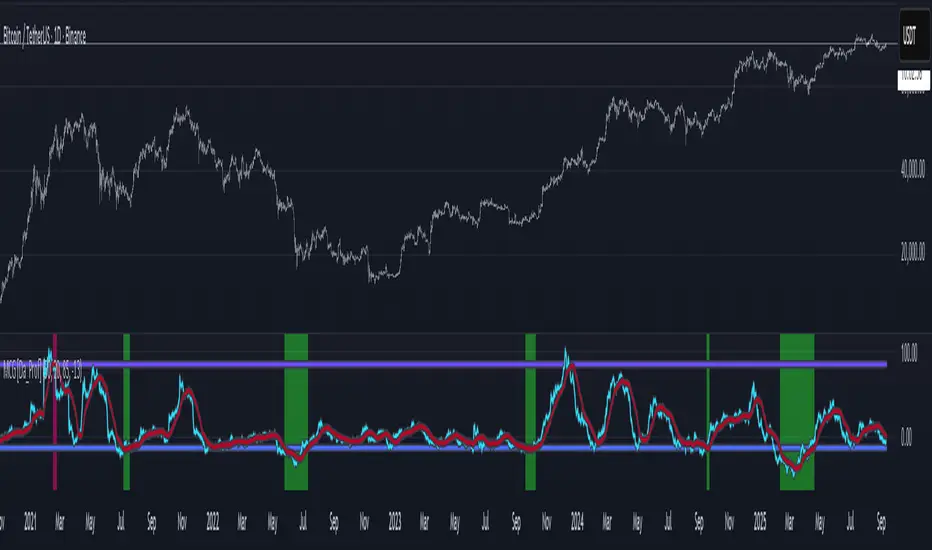
MCG - Meme Coin Gains [Logue]Meme Coin Gains. Investor preference for meme coin trading may signal irrational exuberance in the crypto market. If a large spike in meme coin gains is observed, a top may be near. Therefore, the gains of the most popular meme coins (DOGE, SHIB, SATS, ORDI, BONK, PEPE, and FLOKI) were averaged together in this indicator to help indicate potential mania phases, which may signal nearing of a top. Two simple moving averages of the meme coin gains are used to smooth the data and help visualize changes in trend. In back testing, I found a 10-day "fast" sma and a 20-day "slow" sma of the meme coin gains works well to signal tops and bottoms when extreme values of this indicator are reached.
Meme coins were not traded heavily prior to 2020. Therefore, there is only one cycle to test at the time of initial publication. Also, the meme coin space moves fast, so more meme coins may need to be added later. Also, once a meme coin has finished its mania phase where everyone and their mother has heard of it, it doesn't seem to run again (at least with the data up until time of publication). Therefore, the value of this indicator may not be great unless it is updated frequently.
The two moving averages are plotted. For the indicator, top and bottom "slow" sma trigger lines are plotted. The sma trigger line and the periods (daily) of the moving averages can be modified to your own preferences. The "slow" sma going above or below the trigger lines will print a different background color. Plot on a linear scale if you want to view this as similar to an RSI-type indicator. Plot on a log scale if you want to view as similar to a stochastic RSI.
Use this indicator at your own risk. I make no claims as to its accuracy in forecasting future trend changes of Bitcoin or the crypto market.
스크립트에서 "Cycle"에 대해 찾기
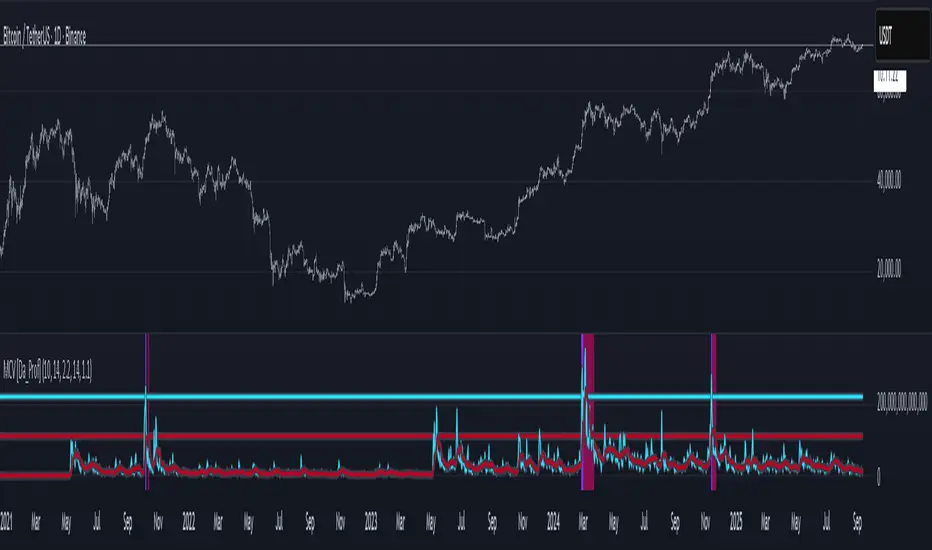
MCV - Meme Coin Volume [Logue]Meme Coin Volume. Investor preference for meme coin trading may signal irrational exuberance in the crypto market. If a large spike in meme coin volume is observed, a top may be near. Therefore, the volume of the most popular meme coins was added together in this indicator to help indicate potential mania phases, which may signal nearing of a top. A simple moving average of the meme coin volume also helps visualize the trend while reducing the noise. In back testing, I found a 10-day sma of the meme coin volume works well.
Meme coins were not traded heavily prior to 2020. Therefore, there is only one cycle to test at the time of initial publication. Also, the meme coin space moves fast, so more meme coins may need to be added later.
The total volume is plotted along with a moving average of the volume. For the indicator, you are able to change the raw volume trigger line, the sma trigger line, and the period (daily) of the sma to your own preferences. The raw volume or sma going above their respective trigger lines will print a different background color.
Use this indicator at your own risk. I make no claims as to its accuracy in forecasting future trend changes of Bitcoin or the crypto market.
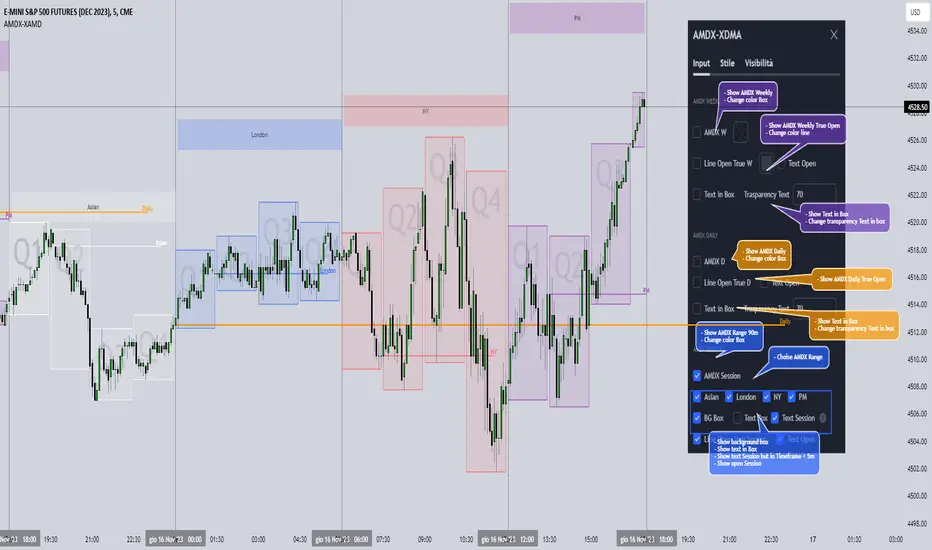
AMDX-XAMDGuided by ICT tutoring and also inspired by the teaching of
Daye', I create this versatile "AMDX" indicator.
A = Accumulation
M = Manipulation
D = Distribution
X = Continuation Or Reversal
This indicator shows a different way of viewing all the Timeframes by dividing them into Quarters, in this context the Trading sessions are divided into a 90m cycle, dividing each time range into Q1-Q2-Q3-Q4, in this way you have a clear vision of what the price is likely to do
True Open Times =
Opening Week - Monday at 6pm
Opening Day - 00:00
Asia -7.30pm
London -01.30
New York -07:30
PM -1.30pm
Session Times =
Q1 Asia 18:00-00:00
Q2 London 00:00-06:00
Q3 New York 06:00-12:00
Q4 PM 12:00-18:00
The user has the possibility to:
- Choose whether to display AMDX W
- Choose whether to display AMDX D
- Choose whether to display AMDX Session
- Choose to show the text in the Box
- Choose to show open levels
The indicator should be used as ICT and 'Daye' show in their concepts.
The indicator divides everything into Quarter ranges and classifies them into Q1-Q2-Q3-Q4 (as in the example above), and each Quarter has its own specific function, and can be used in this way:
If Q1 does an expansion it is likely that Q2 will do a consolidation, Q3 will do a Manipulation and Q4 will do a reversal returning to Q1
-If we are Bullish we buy under Open Session
-If we are Bearish we buy above open session
As in the example below:
If something is not clear, comment below and I will reply as soon as possible.
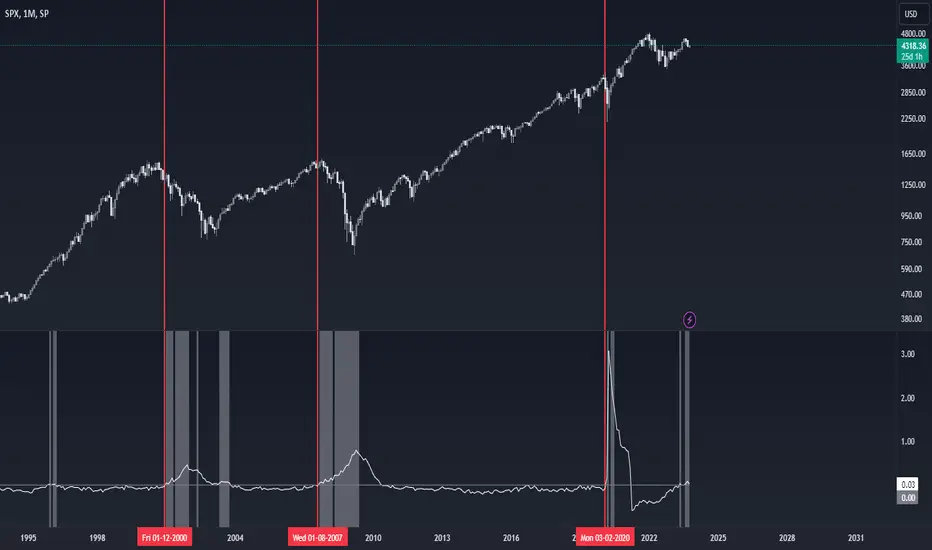
Recession Indicator (Unemployment Rate)Unemployment rate
percentage of unemployed individuals in an economy among individuals currently in the labour force. It is calcuated as Unemployed IndividualsTotal Labour Force × 100 where unemployed individuals are those who are currently not working but are actively seeking work.
The unemployment rate is one of the primary economic indicators used to measure the health of an economy. It tends to fluctuate with the business cycle, increasing during recessions and decreasing during expansions. It is among the indicators most commonly watched by policy makers, investors, and the general public.
Policy makers and central banks consider how much the unemployment rate has increased during a particular recession to gauge the recession’s impact on the economy and to decide how to tailor fiscal and monetary policies to mitigate its adverse effects. In addition, central banks carefully try to predict the future trend of the unemployment rate to devise long-term strategies to lower it.
This indicator is a representation of yearly rate of change of Unemployment rate. Historically (not always) when ROC(Yearly) of Unemployment rate crossover zero line was a signal of recession or economic contraction.
DR/IDR of Omega by TRSTNThis is an EXPERIMENTAL Script by @TRSTNGLRD derived from the coding of @IAmMas7er's "DR/IDR" Indicator that adds a total of 11 additional DR / IDR Ranges on both lower and higher timeframes.
This script is no-longer being worked on, so I have made it public.
Background:
This Script utilizes the Fibonacci-Doubling Sequence between the range of 18:30pm and 16:55pm NY-Time. Each Cycle is grouped into the following:
Omega/2, Omega/4, Omega/8, and Omega/16
The Mas7er's three original sessions are: Omega/4v1, Omega/4v2, and Omega/8v1
These three Sessions above take rule over all others. If you are looking to back-test this version of the script, please use the Experimental ranges as confirmation for the three above.
Important Notes:
- Please only select Sessions with their respected groups (All of Omega/4, All of Omega/16, etc...) rather than selecting all of them at once.
If you select all of them at once, the ranges will not be correct and cut each other off.
The only exceptions to this rule are the Mas7er's original ranges above.
- If you wish to have multiple groups of Ranges together, please add a second indicator to your chart.
- Omega/16v1 and Omega/16v6 are known to have a high-probability of a Judas Swing (takes out both sides of the range) - Be Cautious!
- Omega/2v1 is a very large DR / IDR range. I am working on shrinking it in size, but have more experimenting to do with different ranges.
- I do not use the experimental ranges with the IDR , only the DR . I have not been able to define probabilities fully yet, but the levels are respected nonetheless.
This script is not supposed to work EXACTLY like the Mas7er's, rather, generally instead.
Please comment and leave your opinion below about which ranges work the best and how you may utilize them.
Thank you!

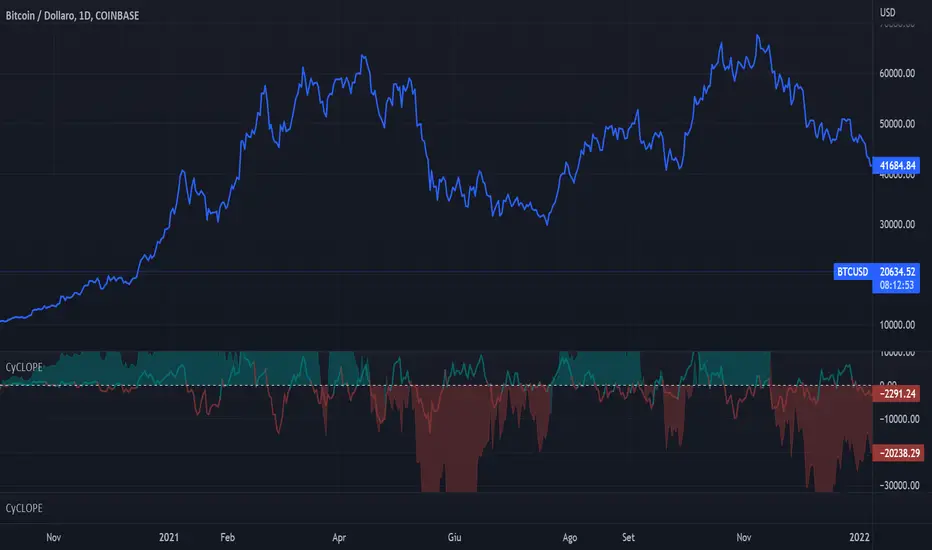
CyCLOPECyCLOPE - CYCLe OPErator
by Antonio Pace 2022
All right reserved
The script uses time series decomposition tecniques for decompose the price signal into 10 harmonics waves of increasing
period and wavelength, the sum of which is the signal itself, to eliminate background noise and show a cleaner signal.
Also divides the high frequencies (secondary, short period trend) from the primary trend (long period trend),
which is composed of low frequencies, and show both separately.
Find highs and lows and indicate possible trend reversals, and favorable entry or exit points.
T0 is the basic harmonic with period 8 Time Unit (TU) of the current timeframe.
T1 has a double period compared to T0, T2 has a double period compared to T1 and so on.
The script composes the primary trend by adding the First 5 harmonics of the longer period (T7 + T6 + T5 + T4 + T3), therefore of low frequency.
This eliminates the noise (short-term retracements) from the main trend.
Similarly, it reconstructs the secondary trend (a possible retracement of a primary trend) by adding the two harmonics with the high frequency (T2 + T1)
T0 the harmonic with highest frequency it is too noisy for this TimeFrame and is left out.
The script then identifies the maximums and minimums of the primary trend and the secondary trend, indicating possible trend reversal points or favorable entry points in a continuing trend.
The script finds the maxima and minima of the reconstructed signal so as to have as little noise as possible.
The reconstructed signal is shown on the screen. The blue line for the long term trend and the orange line for the short time trend.
If the cloud changes from red to green, it means that a local minimum has formed on the main tred, we are in the presence of a possible bullish inversion.
If the cloud turns from green to red then a local high has formed, a bearish trend reversal may have started.
The line on the cloud represents the subtrend instead.
If the line goes from green to red it has formed a maximum and if it goes from red to green it has formed a minimum.
For instance:
If the line is red and the cloud becomes red we are in the presence of a possible inversion and the beginning of a bearish trend.
I exit the long position and into the short position.
Similarly If the cloud is red and the line is green it means that I have a rising subtrend in a bearish dominate trend.
If the line turns red I have a bearish entry point.
If the cloud turns green the low of the subtrend has also become a low of the main trend, a bullish trend has started.
The script is designed to run on a daily timeframe, but it should work on any timeframe provided there are enough Time Units (1024 TU) in the past.
Minimum usable timeframe: 8h, at shorter timeframes the signal becomes indistinguishable from noise.
when the main trend and the sub-trend have the same magnitude, that is, the line and the cloud have the same size, but different color the noise prevails,
there is no valid information.
Wait for them to become the same color to enter the market again.
Once you have chosen the timeframe and asset on which to operate, select the harmonics to compose the main trend and those to compose the secondary trend
so that the indicator matches as much as possible with the real results.
Looking for the right balance between signal and noise and then continuing to use these settings, for this specific timeframe.
if you don't want have both Long Term and Short Trend trend on screen you can hide the short therm and add is harmonic to LongTime trend
in these case gren cloud indicate long and red color indicate short.
VERY IMPORTANT!
THE LONG TERM TREND DOMINATE OVER THE SHORT TERM TREND EXCEPT WHERE BOTH HAVE SAME MAGNITUDE.
The short term trend describe price retracemet over long term trend,
enter to market only when both have the same color.
Use short therm trend to find maximum or minimum of retracement.
FIND AND USE THE MINIMUM NUMBER OF WAVE PER TREND, THE RISK IS OVER FITTING THE PRICE LINE AND CREATE CONFUSION.
THE SCRIPT WORK BEST FOR DAILY TIMEFRAME AND COME CONFIGURED FOR THIS.
VXD SupercycleVXD is a brand new indicator and still developing. to minimize stop losses and overcome sideways market conditions, Higher Timeframe are recommended
Trend lines
-using Rolling VWAP as trend line to determined if Volume related to a certain price.
-you can switch RVWAP to EMA in the setting
ATR
-trailing 12*ATR and 2.4 Mutiplier
Pivot point and Rejected Block
Pivot show last High and low of a price in past bars
Rejected Block show when that High or Low price are important level to determined if it's Hidden Divergence or Divergence
Symbols on chart show Premium and Discount Prices
X-Cross - show potential reversal trend with weak volume .
O-circle - show potential reversal trend with strong volume .
Setting
Momentum: RSI = 25 , RSI MA = 14
Trend: Rolling VWAP and ATR and Subhag
Trailing STOP: ATR 12 x 2.4
Highlight Bars color when volume is above SMA 6
SMA200 act as TP Line
Risk:Reward Calculation
if Buy your Stoploss will be previous Pivot low
if Sell your Stoploss will be previous Pivot high and will be calculated form there, then show TP in Orange color line
VXD เป็นระบบเทรดที่ผมทดลองเอาหลาย ๆ ไอเดีย ทั้งจาก Youtube facebook และกลุ่มคนต่าง ๆ มารวบรวมไว้ แล้วตกผลึกขึ้นมาเป็นระบบนี้ ใน Timeframe ใหญ่ ๆ สามารถลากได้ทั้ง Cycle กันเลย
Trend lines
-ใช้ Rolling VWAP ของแอพ Tradingview (สามารถตั้งแค่าเป็น EMA ได้)
ATR
-ใช้ค่า ATR 12 Mutiplier 2.4
Pivot point and Rejected Block
Pivot โชว์เส้น High low และมีผลกับออเดอร์ หากแท่งเทียนปิดทะลุเส้นนี้
Rejected Block วาดแนวรับ-ต้าน อัตโนมัติ ใช้ประกอบ RSI ว่ามี Divergence หรือไม่
สัญลักษณ์ต่าง ๆ
X-Cross - แท่งกลืนกิน วอลุ่มน้อย
O-circle - แท่งกลืนกิน มีวอลุ่ม
Setting
Momentum: RSI = 25 , RSI MA = 14
Trend: Rolling VWAP and ATR and Subhag
Trailing STOP: ATR 12 x 2.4
Highlight Bars color when volume is above SMA 6
SMA200 act as TP Line
Risk:Reward Calculation
หาก Buy จุด SL จะอยู่ที่ Pivot low
หาก Sell จุด SL จะอยู่ที่ Pivot high และระบบจะคำนวณจากตรงนั้น จากนั้นแสดงเป็นเส้น TP สีส้ม
This Strategy Combined the following indicators and conditioning by me
ATR , RSI , EMA , SMA
Rolling VWAP - /script/ZU2UUu9T-Rolling-VWAP/
Regression Lines - Subhag form Subhag Ghosh /script/LHHBVpQu-Subhag-Ghosh-Algo-Version-for-banknifty/
Rejection Block , Pivots , High Volume Bars and PPDD form Super OrderBlock / FVG / BoS Tools by makuchaku & eFe /script/aZACDmTC-Super-OrderBlock-FVG-BoS-Tools-by-makuchaku-eFe/
ขอให้รวยครับ.

ETH Gravity OscillatorThis indicator is a deviation of a Center of Gravity Oscillator corrected for the diminishing returns of Ethereum.
I've set up this indicator for it to be used on the weekly timeframe . The indicator oscillates between 0 and 10, where 0 indicates oversold conditions and 10 indicates overbought conditions. What is interesting is that it is not particularly ideal for identifying market cycle tops, but generally picks out the most euphoric region in the initial parabolic rally. Good to potentially keep in mind if there is a second bounce to the peak!
The indicator plots in any ETH charts. It paints in all time frames, but Weekly time frame is the correct one to interpret the 'official' read of it.
Made at the request of a kind commenter. If you would like to request different derivations of this script be sure to let me know!

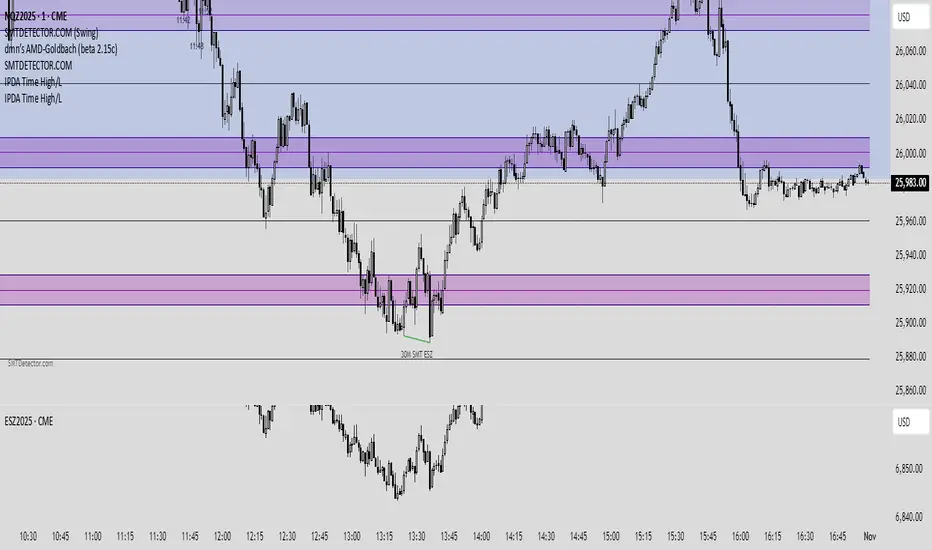
Multi-TimeCycle SMT Live DetectorThis indicator is a multi-asset, multi-timeframe SMT Live detector designed to work on any symbol (indices, futures, FX, crypto, stocks).
It compares your chart symbol against up to two custom comparison symbols and automatically detects bullish and bearish SMT divergences across:
90-minute session blocks (Asia, London, NY – with internal 90m sessions)
60-minute (hourly) cycles
30-minute cycles
10-minute cycles
3-minute cycles
Each SMT is plotted as a line between the reference high/low and the current high/low, with a clear text label showing:
Timecycle (90m / 60m / 30m / 10m / 3m)
Which comparison asset(s) created the divergence (e.g., ES, YM, ES/YM or your custom labels)
The 90-minute SMT module is session-aware using New York time:
Asia: 18:00 – 02:29 NY time
London A/M/D
NY AM A/M/D
NY PM A/M/D

Multi-TimeCycles SMT Live DetectorThis indicator is a multi-asset, multi-timeframe SMT Live detector designed to work on any symbol (indices, futures, FX, crypto, stocks).
It compares your chart symbol against up to two custom comparison symbols and automatically detects bullish and bearish SMT divergences across:
90-minute session blocks (Asia, London, NY – with internal 90m sessions)
60-minute (hourly) cycles
30-minute cycles
10-minute cycles
3-minute cycles
Each SMT is plotted as a line between the reference high/low and the current high/low, with a clear text label showing:
Timecycle (90m / 60m / 30m / 10m / 3m)
Which comparison asset(s) created the divergence (e.g., ES, YM, ES/YM or your custom labels)
The 90-minute SMT module is session-aware using New York time:
Asia: 18:00 – 02:29 NY time
London A/M/D
NY AM A/M/D
NY PM A/M/D

TASC 2025.02 Autocorrelation Indicator█ OVERVIEW
This script implements the Autocorrelation Indicator introduced by John Ehlers in the "Drunkard's Walk: Theory And Measurement By Autocorrelation" article from the February 2025 edition of TASC's Traders' Tips . The indicator calculates the autocorrelation of a price series across several lags to construct a periodogram , which traders can use to identify market cycles, trends, and potential reversal patterns.
█ CONCEPTS
Drunkard's walk
A drunkard's walk , formally known as a random walk , is a type of stochastic process that models the evolution of a system or variable through successive random steps.
In his article, John Ehlers relates this model to market data. He discusses two first- and second-order partial differential equations, modified for discrete (non-continuous) data, that can represent solutions to the discrete random walk problem: the diffusion equation and the wave equation. According to Ehlers, market data takes on a mixture of two "modes" described by these equations. He theorizes that when "diffusion mode" is dominant, trading success is almost a matter of luck, and when "wave mode" is dominant, indicators may have improved performance.
Pink spectrum
John Ehlers explains that many recent academic studies affirm that market data has a pink spectrum , meaning the power spectral density of the data is proportional to the wavelengths it contains, like pink noise . A random walk with a pink spectrum suggests that the states of the random variable are correlated and not independent. In other words, the random variable exhibits long-range dependence with respect to previous states.
Autocorrelation function (ACF)
Autocorrelation measures the correlation of a time series with a delayed copy, or lag , of itself. The autocorrelation function (ACF) is a method that evaluates autocorrelation across a range of lags , which can help to identify patterns, trends, and cycles in stochastic market data. Analysts often use ACF to detect and characterize long-range dependence in a time series.
The Autocorrelation Indicator evaluates the ACF of market prices over a fixed range of lags, expressing the results as a color-coded heatmap representing a dynamic periodogram. Ehlers suggests the information from the periodogram can help traders identify different market behaviors, including:
Cycles : Distinguishable as repeated patterns in the periodogram.
Reversals : Indicated by sharp vertical changes in the periodogram when the indicator uses a short data length .
Trends : Indicated by increasing correlation across lags, starting with the shortest, over time.
█ USAGE
This script calculates the Autocorrelation Indicator on an input "Source" series, smoothed by Ehlers' UltimateSmoother filter, and plots several color-coded lines to represent the periodogram's information. Each line corresponds to an analyzed lag, with the shortest lag's line at the bottom of the pane. Green hues in the line indicate a positive correlation for the lag, red hues indicate a negative correlation (anticorrelation), and orange or yellow hues mean the correlation is near zero.
Because Pine has a limit on the number of plots for a single indicator, this script divides the periodogram display into three distinct ranges that cover different lags. To see the full periodogram, add three instances of this script to the chart and set the "Lag range" input for each to a different value, as demonstrated in the chart above.
With a modest autocorrelation length, such as 20 on a "1D" chart, traders can identify seasonal patterns in the price series, which can help to pinpoint cycles and moderate trends. For instance, on the daily ES1! chart above, the indicator shows repetitive, similar patterns through fall 2023 and winter 2023-2024. The green "triangular" shape rising from the zero lag baseline over different time ranges corresponds to seasonal trends in the data.
To identify turning points in the price series, Ehlers recommends using a short autocorrelation length, such as 2. With this length, users can observe sharp, sudden shifts along the vertical axis, which suggest potential turning points from upward to downward or vice versa.

[iQ]PRO Engineering42+🔬 PRO Engineering42+ ⚙️
The Next Evolution in Signal Processing for Precision Market Analysis
Introducing PRO Engineering42+, a proprietary, cutting-edge technical analysis tool engineered to distill meaningful market structure from the inherent noise of price action. This indicator is built upon a sophisticated, multi-stage signal processing framework, leveraging advanced mathematics to provide traders with a uniquely clarified view of the underlying market trend and momentum.
Hybrid Composite Signal Generation
At its core, PRO Engineering42+ begins with a Hybrid Base Signal. This signal is not a mere average but a intelligently weighted composite, harmonizing the strengths of multiple distinct, adaptive moving average techniques. This fusion is designed to achieve a superior balance of responsiveness to trend shifts and smoothness for noise rejection, establishing a foundation of dynamic market memory.
Adaptive Volatility Clamping
The initial Hybrid Base is then subjected to an innovative process we term Adaptive Volatility Clamping. This critical step dynamically adjusts the signal's sensitivity in real-time based on the market's current volatility profile (measured using True Range), ensuring the signal remains tightly coupled with price action during quiet periods while minimizing whipsaws and overshoots during high-volatility events. This is achieved through a precise, weighted mechanism that prioritizes price context.
Proprietary Spectral Filtration and Gating
The hallmark of PRO Engineering42+ is its final stage: Advanced Frequency Domain Analysis using a proprietary Fast Fourier Transform (FFT) filter.
Frequency Isolation: The tool mathematically decomposes the pre-processed (clamped) signal into its constituent frequencies (or periodic cycles). Traders can isolate and focus on a specific, tunable bandwidth (FFT Low/High Freq) that represents the most relevant market cycles for their trading style, effectively filtering out disruptive high-frequency noise and irrelevant, extremely low-frequency components.
Intelligent Spectral Gating: This feature introduces a proprietary, volatility-aware thresholding mechanism (Spectral Gating Level). The filter actively assesses the power spectrum of the decomposed signal, only allowing frequencies with power exceeding a dynamically calculated standard deviation level to pass through. This unique "gate" intelligently suppresses less significant cycles, leaving only the statistically dominant, market-driving components to form the final output, resulting in an exceptionally clean and responsive oscillator.
The result is a powerful, low-lag Hybrid FFT Oscillator that provides an unparalleled measure of directional bias and momentum.
Key Features for Exclusive Members
Closed Source & Invite Only: The underlying Pine Script logic, including the proprietary spectral gating calculation and hybrid weighting methodology, is intentionally obscured and available exclusively to a select group of paying members.
Maximum Data Efficiency: Optimized with a low max_bars_back and robust dependency structure to ensure maximum calculation efficiency.
Precision Control: Fine-tune the system's performance using controls like Hybrid Base Length, FFT Window Size, and the Spectral Gating Level to perfectly match any asset, timeframe, and trading strategy.
Experience the future of analytical precision. This is not just an indicator; it is a proprietary engineering solution for market mastery.

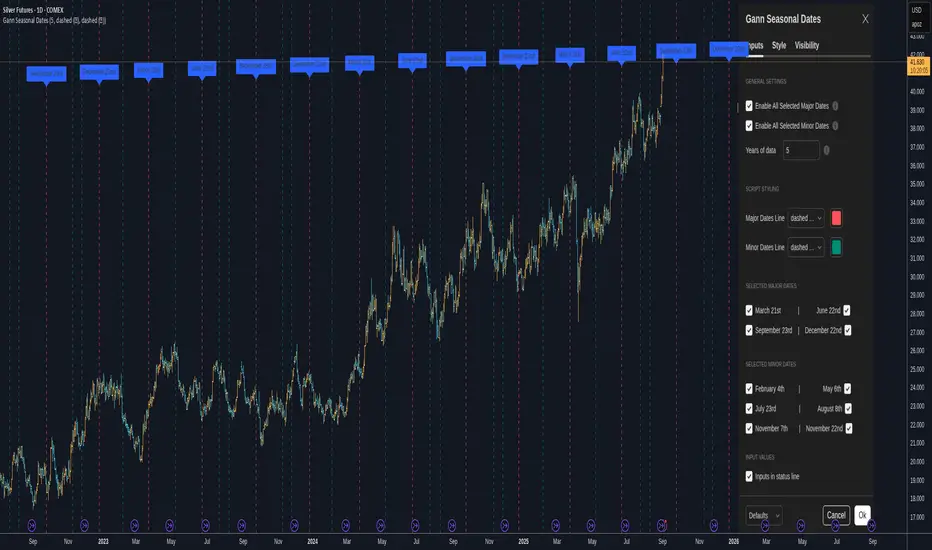
Gann Seasonal Dates - CEGann Seasonal Dates - Community Edition
Welcome to the Gann Seasonal Dates V1.61 - Community Edition, a powerful tool designed to enhance time-based trading with W.D. Gann’s seasonal date methodology. This feature-complete indicator allows traders to plot critical seasonal dates on charts for equities, forex, commodities, and cryptocurrencies. It empowers traders to anticipate market turning points with precision.
Overview
The Gann Seasonal Dates plots Gann’s major and minor seasonal dates, which are rooted in the cyclical nature of solstices, equinoxes, and their midpoints. Major dates include the vernal equinox (March 21st), summer solstice (June 22nd), autumnal equinox (September 23rd), and winter solstice (December 22nd). Minor dates mark the halfway points between these events (February 4th, May 6th, July 23rd, August 8th, November 7th, and November 22nd). With customizable styling and historical data up to 50 years, this script helps traders identify key time-based market events.
Key Features
Major and Minor Seasonal Dates : Plot four major dates (solstices and equinoxes) and six minor dates (midpoints) to highlight potential market turning points.
Customizable Date Selection : Enable or disable individual major and minor dates to focus on specific cycles relevant to your analysis.
Historical Data Range : Adjust the lookback period up to 50 years, with recommendations for optimal performance based on your TradingView plan (5 years for Basic, 20 for Pro/Pro+/Premium).
Styling Options : Customize line styles (solid, dotted, dashed) and colors for major and minor dates to enhance chart clarity.
Labeled Visuals : Each plotted date includes a label with a tooltip (e.g., "Vernal equinox") for easy identification and context.
How It Works
Configure Settings : Enable major and/or minor dates and select specific dates (e.g., March 21st, February 4th) to display on your chart.
Set Historical Range : Adjust the years of data (up to 50) to plot historical seasonal dates, ensuring compatibility with your TradingView plan’s processing limits.
Customize Styling : Choose line styles and colors for major and minor dates to differentiate them visually.
Analyze and Trade : Use the plotted vertical lines and labels to identify potential market turning points, integrating Gann’s time-based cycles into your strategy.
Get Started
As a gift to the TradingView community and Gann traders, the Gann Seasonal Dates - Community Edition is provided free of charge. With no features locked, this tool offers full access to Gann’s seasonal date methodology for precise time-based analysis. Trade wisely and leverage the power of seasonal cycles!
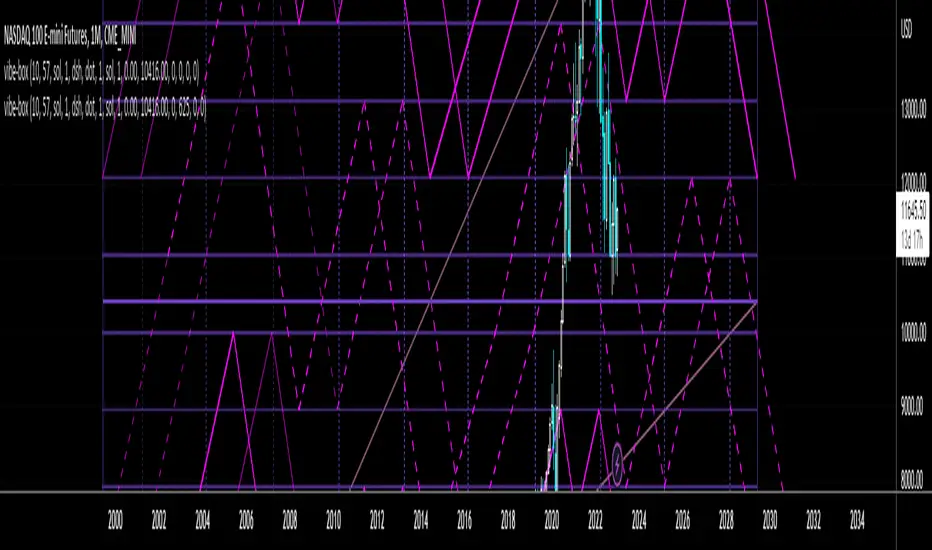
Vibration BoxFirst Public release of the Vibration Box
WARNING - THESE CYCLES CANNOT PREDICT PERFECT "UP & DOWN" MOTION
There is absolutely no guarantee that these cycles will predict perfect "up & down" motion for the markets
Please be aware that this tool is to be used with a robust risk management system
These cycles are representative of "circle geometry within a square of price & time"
Slowly, I will build up some ideas to go along with this script so that you can learn to apply it to many different markets in many different ways
Those familiar with the work of W.D. Gann should be able to utilize this tool in many different ways
Instructions:
Place the box down with 2 mouse clicks (first is for bottom left corner & second is for top right corner)
NOTE: DUE TO TRADINGVIEW LIMITATIONS
-There is a maximum of 12 divisions for your box/vibration (I will work on increasing this number)
-You MUST choose a coordinate that is within the price action that has already occurred
-You CANNOT initially place the box BEFORE THE FIRST BAR of data
-You CANNOT initially place the box BEYOND THE LAST BAR of data
THEN, ONCE YOU HAVE PLACED THE BOX FOR THE FIRST TIME
YOU CAN MANUALLY ADJUST THE DATES WITHIN THE SETTINGS TO PLACE THE BOX IN ANYWAY YOU WOULD LIKE!
ALT Risk Metric StrategyHere's a professional write-up for your ALT Risk Strategy script:
ALT/BTC Risk Strategy - Multi-Crypto DCA with Bitcoin Correlation Analysis
Overview
This strategy uses Bitcoin correlation as a risk indicator to time entries and exits for altcoins. By analyzing how your chosen altcoin performs relative to Bitcoin, the strategy identifies optimal accumulation periods (when alt/BTC is oversold) and profit-taking opportunities (when alt/BTC is overbought). Perfect for traders who want to outperform Bitcoin by strategically timing altcoin positions.
Key Innovation: Why Alt/BTC Matters
Most traders focus solely on USD price, but Alt/BTC ratios reveal true altcoin strength:
When Alt/BTC is low → Altcoin is undervalued relative to Bitcoin (buy opportunity)
When Alt/BTC is high → Altcoin has outperformed Bitcoin (take profits)
This approach captures the rotation between BTC and alts that drives crypto cycles
Key Features
📊 Advanced Technical Analysis
RSI (60% weight): Primary momentum indicator on weekly timeframe
Long-term MA Deviation (35% weight): Measures distance from 150-period baseline
MACD (5% weight): Minor confirmation signal
EMA Smoothing: Filters noise while maintaining responsiveness
All calculations performed on Alt/BTC pairs for superior market timing
💰 3-Tier DCA System
Level 1 (Risk ≤ 70): Conservative entry, base allocation
Level 2 (Risk ≤ 50): Increased allocation, strong opportunity
Level 3 (Risk ≤ 30): Maximum allocation, extreme undervaluation
Continuous buying: Executes every bar while below threshold for true DCA behavior
Cumulative sizing: L3 triggers = L1 + L2 + L3 amounts combined
📈 Smart Profit Management
Sequential selling: Must complete L1 before L2, L2 before L3
Percentage-based exits: Sell portions of position, not fixed amounts
Auto-reset on re-entry: New buy signals reset sell progression
Prevents premature full exits during volatile conditions
🤖 3Commas Automation
Pre-configured JSON webhooks for Custom Signal Bots
Multi-exchange support: Binance, Coinbase, Kraken, Bitfinex, Bybit
Flexible quote currency: USD, USDT, or BUSD
Dynamic order sizing: Automatically adjusts to your tier thresholds
Full webhook documentation compliance
🎨 Multi-Asset Support
Pre-configured for popular altcoins:
ETH (Ethereum)
SOL (Solana)
ADA (Cardano)
LINK (Chainlink)
UNI (Uniswap)
XRP (Ripple)
DOGE
RENDER
Custom option for any other crypto
How It Works
Risk Metric Calculation (0-100 scale):
Fetches weekly Alt/BTC price data for stability
Calculates RSI, MACD, and deviation from 150-period MA
Normalizes MACD to 0-100 range using 500-bar lookback
Combines weighted components: (MACD × 0.05) + (RSI × 0.60) + (Deviation × 0.35)
Applies 5-period EMA smoothing for cleaner signals
Color-Coded Risk Zones:
Green (0-30): Extreme buying opportunity - Alt heavily oversold vs BTC
Lime/Yellow (30-70): Accumulation range - favorable risk/reward
Orange (70-85): Caution zone - consider taking initial profits
Red/Maroon (85-100+): Euphoria zone - aggressive profit-taking
Entry Logic:
Buys execute every candle when risk is below threshold
As risk decreases, position sizing automatically scales up
Example: If risk drops from 60→25, you'll be buying at L1 rate until it hits 50, then L2 rate, then L3 rate
Exit Logic:
Sells only trigger when in profit AND risk exceeds thresholds
Sequential execution ensures partial profit-taking
If new buy signal occurs before all sells complete, sell levels reset to L1
Configuration Guide
Choosing Your Altcoin:
Select crypto from dropdown (or use CUSTOM for unlisted coins)
Pick your exchange
Choose quote currency (USD, USDT, BUSD)
Risk Metric Tuning:
Long Term MA (default 150): Higher = more extreme signals, Lower = more frequent
RSI Length (default 10): Lower = more volatile, Higher = smoother
Smoothing (default 5): Increase for less noise, decrease for faster reaction
Buy Settings (Aggressive DCA Example):
L1 Threshold: 70 | Amount: $5
L2 Threshold: 50 | Amount: $6
L3 Threshold: 30 | Amount: $7
Total L3 buy = $18 per candle when deeply oversold
Sell Settings (Balanced Exit Example):
L1: 70 threshold, 25% position
L2: 85 threshold, 35% position
L3: 100 threshold, 40% position (final exit)
3Commas Setup
Bot Configuration:
Create Custom Signal Bot in 3Commas
Set trading pair to your altcoin/USD (e.g., ETH/USD, SOL/USDT)
Order size: Select "Send in webhook, quote" to use strategy's dollar amounts
Copy Bot UUID and Secret Token
Script Configuration:
Paste credentials into 3Commas section inputs
Check "Enable 3Commas Alerts"
Save and apply to chart
TradingView Alert:
Create Alert → Condition: "alert() function calls only"
Webhook URL: api.3commas.io
Enable "Webhook URL" checkbox
Expiration: Open-ended
Strategy Advantages
✅ Outperform Bitcoin: Designed specifically to beat BTC by timing alt rotations
✅ Capture Alt Seasons: Automatically accumulates when alts lag, sells when they pump
✅ Risk-Adjusted Sizing: Buys more when cheaper (better risk/reward)
✅ Emotional Discipline: Systematic approach removes fear and FOMO
✅ Multi-Asset: Run same strategy across multiple altcoins simultaneously
✅ Proven Indicators: Combines RSI, MACD, and MA deviation - battle-tested tools
Backtesting Insights
Optimal Timeframes:
Daily chart: Best for backtesting and signal generation
Weekly data is fetched internally regardless of display timeframe
Historical Performance Characteristics:
Accumulates heavily during bear markets and BTC dominance periods
Captures explosive altcoin rallies when BTC stagnates
Sequential selling preserves capital during extended downtrends
Works best on established altcoins with multi-year history
Risk Considerations:
Requires capital reserves for extended accumulation periods
Some altcoins may never recover if fundamentals deteriorate
Past correlation patterns may not predict future performance
Always size positions according to personal risk tolerance
Visual Interface
Indicator Panel Displays:
Dynamic color line: Green→Lime→Yellow→Orange→Red as risk increases
Horizontal threshold lines: Dashed lines mark your buy/sell levels
Entry/Exit labels: Green labels for buys, Orange/Red/Maroon for sells
Real-time risk value: Numerical display on price scale
Customization:
All threshold lines are adjustable via inputs
Color scheme clearly differentiates buy zones (green spectrum) from sell zones (red spectrum)
Line weights emphasize most extreme thresholds (L3 buy and L3 sell)
Strategy Philosophy
This strategy is built on the principle that altcoins move in cycles relative to Bitcoin. During Bitcoin rallies, alts often bleed against BTC (high sell, accumulate). When Bitcoin consolidates, alts pump (take profits). By measuring risk on the Alt/BTC chart instead of USD price, we time these rotations with precision.
The 3-tier system ensures you're always averaging in at better prices and scaling out at better prices, maximizing your Bitcoin-denominated returns.
Advanced Tips
Multi-Bot Strategy:
Run this on 5-10 different altcoins simultaneously to:
Diversify correlation risk
Capture whichever alt is pumping
Smooth equity curve through rotation
Pairing with BTC Strategy:
Use alongside the BTC DCA Risk Strategy for complete portfolio coverage:
BTC strategy for core holdings
ALT strategies for alpha generation
Rebalance between them based on BTC dominance
Threshold Calibration:
Check 2-3 years of historical data for your chosen alt
Note where risk metric sat during major bottoms (set buy thresholds)
Note where it peaked during euphoria (set sell thresholds)
Adjust for your risk tolerance and holding period
Credits
Strategy Development & 3Commas Integration: Claude AI (Anthropic)
Technical Analysis Framework: RSI, MACD, Moving Average theory
Implementation: pommesUNDwurst
Disclaimer
This strategy is for educational purposes only. Cryptocurrency trading involves substantial risk of loss. Altcoins are especially volatile and many fail completely. The strategy assumes liquid markets and reliable Alt/BTC price data. Always do your own research, understand the fundamentals of any asset you trade, and never risk more than you can afford to lose. Past performance does not guarantee future results. The authors are not financial advisors and assume no liability for trading decisions.
Additional Warning: Using leverage or trading illiquid altcoins amplifies risk significantly. This strategy is designed for spot trading of established cryptocurrencies with deep liquidity.
Tags: Altcoin, Alt/BTC, DCA, Risk Metric, Dollar Cost Averaging, 3Commas, ETH, SOL, Crypto Rotation, Bitcoin Correlation, Automated Trading, Alt Season
Feel free to modify any sections to better match your style or add specific backtesting results you've observed! 🚀Claude is AI and can make mistakes. Please double-check responses. Sonnet 4.5

IPDA Time High/L🧭 IPDA Time Pivot High/Low (3•6•9)
Precision timing meets liquidity delivery.
🔹 Concept
This tool is built on the idea that price is delivered by time, not structure — a core belief in Zeussy/Smart Money–style analysis.
Certain time signatures, known as IPDA times (where the digits of hour and minute reduce to 3, 6, or 9), often align with reversals, traps, or accelerations in market delivery.
These times represent rhythmic energy cycles in algorithmic delivery, marking when liquidity is often redistributed.
🔹 What the Indicator Does
Scans your selected time window (default: 9:00–11:00, New York).
Identifies candles forming micro pivots — a candle that’s higher or lower than both its immediate neighbors.
Filters only those pivots that occur at IPDA times (digital roots of 3, 6, or 9).
Prints a clean, minimal time label (HH:MM) above or below each qualifying candle.
Labels dynamically adjust to your chart’s timezone and vertical spacing for clarity.
🔹 Why It’s Useful
These moments often align with:
Engineered traps during liquidity hunts.
Session transitions (e.g., London → NY Open).
Delivery shifts where price changes direction into the Draw on Liquidity (DOL).
By highlighting only precise, time-based pivots, this indicator helps traders:
Anticipate timing-based reversals,
Align narrative with smart-money delivery cycles,
And build refined entries within the NY AM session.
🔹 How to Use
Apply the indicator to your chart.
Set the timezone (default: America/New_York).
Focus on your session window (e.g., 09:00–11:00).
Observe when price reaches your POI or liquidity pool during an IPDA time — those candles are often where manipulation or delivery begins.
Combine with your own narrative tools (SMT, CISD, DOL, POI) for confirmation.
🔹 Features
Automatic timezone alignment
Adjustable session hours
Transparent, minimalistic time labels
Custom label size & offset for clean chart aesthetics
Works on all intraday timeframes
🔹 Philosophy
“Price is delivered by time, not structure.”
— Zeussy
This indicator was designed for traders who study timing as a function of delivery,
not just structure — allowing you to see when the algorithm intends to act.
Nancy's All-In-One [Private] [Institutional]A Private Institutional Tool by Design
PRIVATE ACCESS ONLY
This script is not for public usage or those casually scrolling through the indicator library. This is a private tool, built for precision, and extremely powerful in the wrong hands. Used properly, it can unlock financial freedom yes, it’s that potent.
“This is the closest you’ll get to peeking behind the curtain of institutional strategy without having a Bloomberg terminal or a Wall Street badge.”
– KC Research
What It Does
The Nancy All-In-One is the culmination of thousands of hours of backtesting, real-world application, and tactical insights drawn from elite strategies used at places like Renaissance Technologies, proprietary desks, and private equity firms.
This version fuses:
DTT Root Candles & Time-Zone Price Levels (including NY Judas, Kyoto, Osaka, etc.)
Intraday Sessions & Micro Box Models (Turncoat, Bishop, Knight, Big Ben, etc.)
Quarterly Micro Cycles — breaks down time into high-probability 90-minute blocks
Fib-Based Inner Intervals — ideal for sniper-level scalps or early entries
SMT Divergences, PD High/Low, NWOG/NDOG/EHPDA setups
Multi-Timeframe Visualization (with user control over display resolution)
Every line, label, and box drawn has a purpose, engineered to expose fractal imbalances, liquidity traps, and premium/discount zones with surgical accuracy.
How to Use It
Use the 1M or 5M chart — This script was optimized with lower-timeframe precision in mind. It works higher up, but that’s not its primary edge.
Turn on sessions you want under Turn Modules On group. Each session represents a model with its own behavior (e.g. Osaka Model = Asia liquidity expansion).
Price Lines — The "DTT Root Candles" levels are critical. These are not random timestamps—they represent algorithmic triggers derived from real volume and timing analysis.
Quarterly Cycles — Use these to trade from zone-to-zone with context. Each 90-minute block often contains a reversal, breakout, or liquidity sweep.
SMT, PDHL, NWOG, NDOG — These are best used with confluence. The more boxes and lines that agree, the higher your confidence.
Built for Traders Who Know the Game
This is not a magic button. It’s a complex system that assumes you're willing to study it, adapt it, and integrate it into your own strategy. It’s a tool—not a signal generator. It won't tell you when to buy or sell, but it will show you exactly where institutions are hunting.
Settings & Customization
You can toggle each element on/off to declutter your chart.
Change label sizes, opacity, and styles to suit your preferences.
Adjust session times if you're not in EST (UTC-5 default).
Works Best With:
1M to 15M charts (although elements scale up)
Liquid FX pairs, indices (SPX, NAS100), BTC, and ETH
Time-sensitive entries (news, killzones, session opens)
Final Note
This was developed internally by Nancy and private anon entities, and is still being actively expanded. Portions of the code are open-source, but most logic is proprietary and reverse-engineering resistant.
If you don’t know what NWOG, EQH/PDH, or SMT are—this isn’t for you. If you do... welcome to the other side.

Planetary Speed - CEPlanetary Speed - Community Edition
Welcome to the Planetary Speed - Community Edition , a specialized tool designed to enhance W.D. Gann-inspired trading by plotting the speed of selected planets. This indicator measures changes in planetary ecliptic longitudes, which may correlate with market timing and volatility, making it ideal for traders analyzing equities, forex, commodities, and cryptocurrencies.
Overview
The Planetary Speed - Community Edition calculates the speed of a chosen planet (Mercury, Venus, Mars, Jupiter, Saturn, Uranus, Neptune, or Pluto) by comparing its ecliptic longitude across time. Supporting heliocentric and geocentric modes, the script plots speed data with high precision across various chart timeframes, particularly for markets open 24/7 like cryptocurrencies. Traders can customize line colors and add multiple instances for multi-planet analysis, aligning with Gann’s belief that planetary cycles influence market trends.
Key Features
Plots the speed of eight planets (Mercury, Venus, Mars, Jupiter, Saturn, Uranus, Neptune, Pluto) based on ecliptic longitude changes
Supports heliocentric and geocentric modes for flexible analysis
Customizes line colors for clear visualization of planetary speed data
Projects future speed data up to 250 days with daily resolution
Works across default TradingView timeframes (except monthly) for continuous markets
Enables multiple script instances for tracking different planets on the same chart
How to Use
Access the script’s settings to configure preferences
Choose a planet from Mercury, Venus, Mars, Jupiter, Saturn, Uranus, Neptune, or Pluto
Select heliocentric or geocentric mode for calculations
Customize the line color for speed data visualization
Review plotted speed data to identify potential market timing or volatility shifts
Add multiple instances to track different planets simultaneously
Get Started
The Planetary Speed - Community Edition provides full functionality for astrological market analysis. Designed to highlight Gann’s planetary cycles, this tool empowers traders to explore celestial influences. Trade wisely and harness the power of planetary speed!

Time Block with Current K-Line TimeThis indicator divides the market into fixed time blocks (daily, three-day, weekly, monthly, and yearly) and displays 1/4, 1/2, and 3/4 dividing lines within each block, indicating key price positions within the block.
————————————
Description:
1. Generally speaking, the duration of a market period is one time block within the corresponding period.
2. Supports display of the current candlestick time, the dividing line for the next block, and a countdown.
3. Multi-time zone support: Shanghai, New York, London, Tokyo, and UTC. Time display automatically adapts to the selected time zone.
4. Time block visualization: Select the time block length based on the observation period and draw dividers at the time block boundaries.
5. Real-time time display: Detailed time of the current candlestick chart (year/month/day, hour:minute, day of the week).
6. Future time prediction: Displays the next time block's start position with a future divider. A countdown function displays the time until the next block, helping to determine the remaining duration of the current trend.
————————————
Use scenarios:
Day trading: Identify trading day boundaries (1-day blocks)
Swing trading: Optimize weekly/monthly time frame transitions (1-week/1-month blocks)
Long-term investment: Observe annual market cycles (1-year blocks)
Cross-time zone trading: Seamlessly switch between major global trading time zones.
————————————
Functions:
- Time block division to observe market cycles
- Draw 1/4, 1/2, and 3/4 dividers to assist in trading decisions
- Current K-line Time Display
- Future Block Divider and Countdown Indicator
————————————
How to Use:
Can be combined with trend lines or other trend-following tools to identify trend-following entry opportunities near the dividing line and follow the main trend.
——————————————————————————————————————————————————————————
本指标将行情划分为固定时间区块(日、三日、周、月、年),并在每个区块内显示1/4、1/2、3/4分割线,标示区块内关键价格位置
————————————
描述:
1. 通常而言,一段行情的持续时间为对应周期下的一个时间区块
2. 支持显示当前K线时间及下一个区块的分割线和倒计时。
3. 多时区支持,支持上海、纽约、伦敦、东京、UTC五大交易时区,自适应所选时区的时间显示
4. 时间区块可视化:根据观测周期选择时间区块长度,在时间区块边界绘制分隔线
5. 实时时间显示:当前K线详细时间(年/月/日 时:分 星期)
6. 未来时间预测,下一个时间区块开始位置显示未来分割线,倒计时功能显示距离下个区块的时间,用于辅助判断当前趋势的剩余持续时间
————————————
使用场景:
日内交易:识别交易日边界(1日区块)
波段交易:把握周/月时间框架转换(1周/1月区块)
长期投资:观察年度市场周期(1年区块)
跨时区交易:无缝切换全球主要交易时区
————————————
功能:
- 时间区块划分,观察行情周期
- 绘制1/4、1/2、3/4分割线,辅助交易判断
- 当前K线时间显示
- 未来区块分割线及倒计时提示
————————————
使用方法:
可结合趋势线或其他趋势跟随工具,在分割线附近寻找顺势进场机会,追随主趋势

CVDD Z-ScoreCumulative Value Days Destroyed (CVDD) - The CVDD was created by Willy Woo and is the ratio of the cumulative value of Coin Days Destroyed in USD and the market age (in days). While this indicator is used to detect bottoms normally, an extension is used to allow detection of BTC tops. When the BTC price goes above the CVDD extension, BTC is generally considered to be overvalued. Because the "strength" of the BTC tops has decreased over the cycles, a logarithmic function for the extension was created by fitting past cycles as log extension = slope * time + intercept. This indicator is triggered for a top when the BTC price is above the CVDD extension. For the bottoms, the CVDD is shifted upwards at a default value of 120%. The slope, intercept, and CVDD bottom shift can all be modified in the script.
Now with the automatic Z-Score calculation for ease of classification of Bitcoin's valuation according to this metric.
Created for TRW.

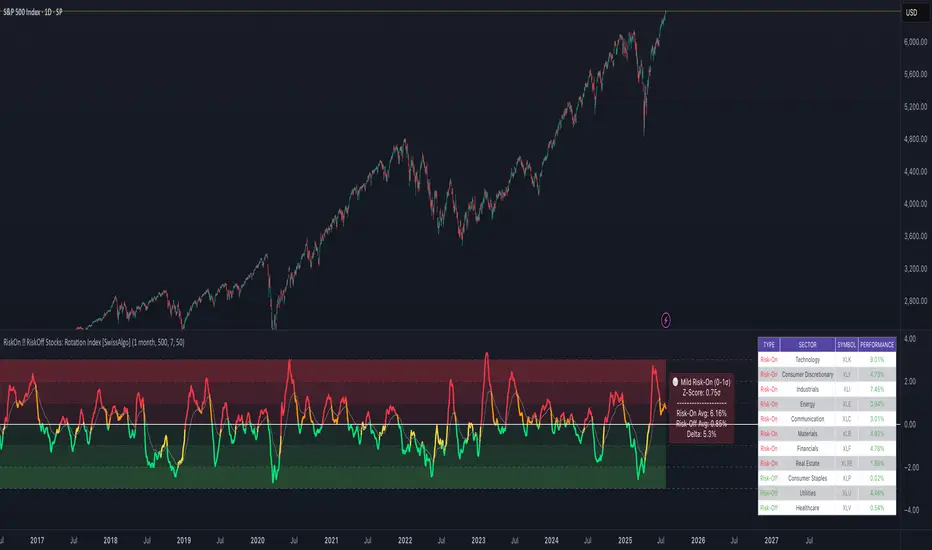
Risk On/Off Index [SwissAlgo]Risk On/Off Index - Sector Rotation Analysis
----------------------------------------------------
What it does:
This indicator estimates market risk appetite by comparing the weighted performance of growth/cyclical sectors (Risk-On) against defensive sectors (Risk-Off).
It provides a normalized oscillator that ranges from -1 (extreme risk-off) to +1 (extreme risk-on), which may help traders identify potential shifts in market sentiment and sector rotation patterns.
The analysis examines whether institutional money flows favor aggressive growth assets or seek safety in defensive positions, potentially offering insights into the underlying risk tolerance that drives market movements. When properly interpreted alongside other analyses, this information could assist in understanding broader market cycles and sentiment transitions.
----------------------------------------------------
How it works:
The indicator analyzes 11 major sector ETFs weighted by their actual market capitalization representation:
Risk-On sectors (70% weight) : Technology (28%), Financials (11%), Consumer Discretionary (10%), Communication (9%), Industrials (8%), Energy (4%), Materials (2.5%), Real Estate (2%)
Risk-Off sectors (30% weight) : Healthcare (13%), Consumer Staples (6%), Utilities (2.5%)
The algorithm calculates the weighted performance difference over your selected timeframe (7 days to 12 months) and normalizes it using three methods: Simple Difference, Tanh Normalized, or Historical Range. A 7-period EMA smooths the signal, while a longer signal line (default 50) provides trend context.
----------------------------------------------------
Visual Features:
Main curve (Risk Appetite Delta) : The primary line shows the smoothed (7-period EMA) risk appetite reading. When above zero, growth sectors are outperforming defensive sectors (risk-on sentiment). When below zero, defensive sectors are outperforming growth sectors (risk-off sentiment).
Signal line : A longer EMA (default 50-period) of the risk appetite data that represents the underlying trend. Crossovers between the main curve and signal line may indicate potential momentum shifts in market sentiment (potential long signal when the crossover happens in extreme risk-off zones, and potential short signal when the crossunder occurs in extreme risk-on zones)
Dynamic color coding : The main curve color reflects both position and momentum:
Red : Risk-on territory (>0) with strengthening momentum (above signal line)
Green : Risk-on territory (>0) but weakening momentum (below signal line) - potential reversal warning
Maroon : Risk-off territory (<0) but strengthening momentum (above signal line) - potential reversal warning
Lime : Risk-off territory (<0) with strengthening momentum (below signal line)
Gradient background zones : Subtle fills indicate risk appetite intensity levels from moderate (0 to ±0.25) through strong (±0.25 to ±0.5) to extreme (±0.5 to ±1.0)
Sector breakdown table : Shows individual sector performance with clear Risk-On/Risk-Off categorization
Reference levels : Horizontal lines mark neutral (0), strong (±0.5), and extreme (±1) risk appetite zones
This color system allows traders to quickly assess not just current sentiment (above/below zero) but also whether that sentiment is strengthening or potentially reversing based on the relationship with the signal line.
----------------------------------------------------
Who may benefit:
Portfolio managers rotating between growth and defensive allocations
Swing traders timing sector rotation plays
Risk managers monitoring overall market sentiment
Asset allocators adjusting exposure based on risk appetite cycles
----------------------------------------------------
Key applications:
Identify when markets transition from growth-seeking to risk-averse behavior
Time entries into cyclical sectors during risk-on phases
Rotate to defensive sectors when risk appetite weakens
Spot divergences between individual stocks and broader market sentiment
----------------------------------------------------
Limitations:
This indicator reflects US equity sector dynamics and may not capture risk sentiment in other asset classes or geographic regions. ETF-based analysis introduces slight tracking differences from underlying sector performance. Past performance patterns do not guarantee future results.
----------------------------------------------------
Disclaimer:
This indicator is for educational and analytical purposes only. It does not constitute financial advice or trading recommendations. Users should conduct their own analysis and risk assessment before making investment decisions. SwissAlgo assumes no responsibility for trading losses or investment outcomes based on this indicator's signals.
Goichi Hosoda TheoryGreetings to traders. I offer you an indicator for trading according to the Ichimoku Kinho Hyo trading system. This indicator determines possible time cycles of price reversal and expected asset price values based on the theory of waves and time cycles by Goichi Hosoda.
The indicator contains classic price levels N, V, E and NT, and is supplemented with intermediate levels V+E, V+N, N+NT and x2, x3, x4 for levels V and E, which are used in cases where the wave does not contain corrections and there is no possibility to update the impulse-corrective wave.
A function for counting bars from points A B and C has also been added.

Advanced Multi-Seasonality StrategyThe Multi-Seasonality Strategy is a trading system based on seasonal market patterns. Seasonality refers to recurring market trends driven by predictable calendar-based events. These patterns emerge due to economic cycles, corporate activities (e.g., earnings reports), and investor behavior around specific times of the year. Studies have shown that such effects can influence asset prices over defined periods, leading to opportunities for traders who exploit these patterns (Hirshleifer, 2001; Bouman & Jacobsen, 2002).
How the Strategy Works:
The strategy allows the user to define four distinct periods within a calendar year. For each period, the trader selects:
Entry Date (Month and Day): The date to enter the trade.
Holding Period: The number of trading days to remain in the trade after the entry.
Trade Direction: Whether to take a long or short position during that period.
The system is designed with flexibility, enabling the user to activate or deactivate each of the four periods. The idea is to take advantage of seasonal patterns, such as buying during historically strong periods and selling during weaker ones. A well-known example is the "Sell in May and Go Away" phenomenon, which suggests that stock returns are higher from November to April and weaker from May to October (Bouman & Jacobsen, 2002).
Seasonality in Financial Markets:
Seasonal effects have been documented across different asset classes and markets:
Equities: Stock markets tend to exhibit higher returns during certain months, such as the "January effect," where prices rise after year-end tax-loss selling (Haugen & Lakonishok, 1987).
Commodities: Agricultural commodities often follow seasonal planting and harvesting cycles, which impact supply and demand patterns (Fama & French, 1987).
Forex: Currency pairs may show strength or weakness during specific quarters based on macroeconomic factors, such as fiscal year-end flows or central bank policy decisions.
Scientific Basis:
Research shows that market anomalies like seasonality are linked to behavioral biases and institutional practices. For example, investors may respond to tax incentives at the end of the year, and companies may engage in window dressing (Haugen & Lakonishok, 1987). Additionally, macroeconomic factors, such as monetary policy shifts and holiday trading volumes, can also contribute to predictable seasonal trends (Bouman & Jacobsen, 2002).
Risks of Seasonal Trading:
While the strategy seeks to exploit predictable patterns, there are inherent risks:
Market Changes: Seasonal effects observed in the past may weaken or disappear as market conditions evolve. Increased algorithmic trading, globalization, and policy changes can reduce the reliability of historical patterns (Lo, 2004).
Overfitting: One of the risks in seasonal trading is overfitting the strategy to historical data. A pattern that worked in the past may not necessarily work in the future, especially if it was based on random chance or external factors that no longer apply (Sullivan, Timmermann, & White, 1999).
Liquidity and Volatility: Trading during specific periods may expose the trader to low liquidity, especially around holidays or earnings seasons, leading to slippage and larger-than-expected price swings.
Economic and Geopolitical Shocks: External events such as pandemics, wars, or political instability can disrupt seasonal patterns, leading to unexpected market behavior.
Conclusion:
The Multi-Seasonality Strategy capitalizes on the predictable nature of certain calendar-based patterns in financial markets. By entering and exiting trades based on well-established seasonal effects, traders can potentially capture short-term profits. However, caution is necessary, as market dynamics can change, and seasonal patterns are not guaranteed to persist. Rigorous backtesting, combined with risk management practices, is essential to successfully implementing this strategy.
References:
Bouman, S., & Jacobsen, B. (2002). The Halloween Indicator, "Sell in May and Go Away": Another Puzzle. American Economic Review, 92(5), 1618-1635.
Fama, E. F., & French, K. R. (1987). Commodity Futures Prices: Some Evidence on Forecast Power, Premiums, and the Theory of Storage. Journal of Business, 60(1), 55-73.
Haugen, R. A., & Lakonishok, J. (1987). The Incredible January Effect: The Stock Market's Unsolved Mystery. Dow Jones-Irwin.
Hirshleifer, D. (2001). Investor Psychology and Asset Pricing. Journal of Finance, 56(4), 1533-1597.
Lo, A. W. (2004). The Adaptive Markets Hypothesis: Market Efficiency from an Evolutionary Perspective. Journal of Portfolio Management, 30(5), 15-29.
Sullivan, R., Timmermann, A., & White, H. (1999). Data-Snooping, Technical Trading Rule Performance, and the Bootstrap. Journal of Finance, 54(5), 1647-1691.
This strategy harnesses the power of seasonality but requires careful consideration of the risks and potential changes in market behavior over time.
