스크립트에서 "CCI"에 대해 찾기

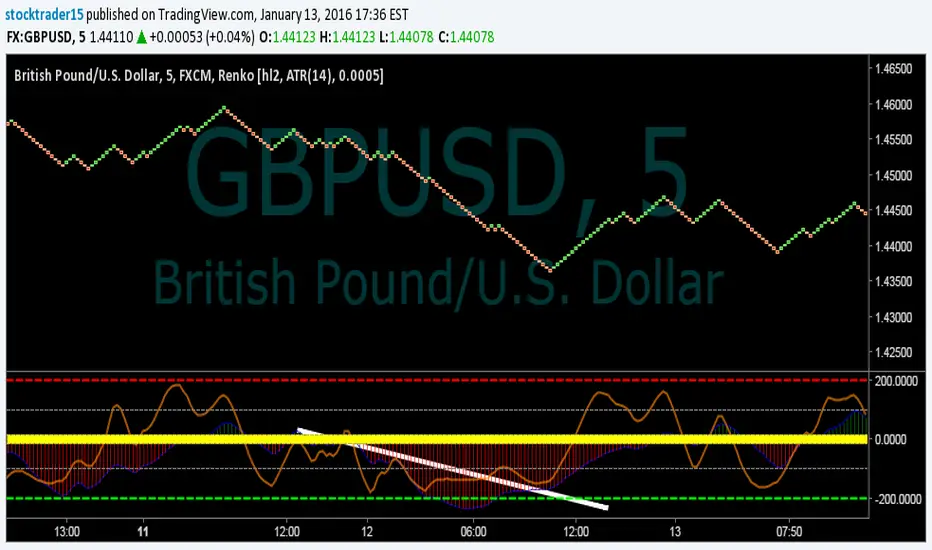
Trend and Entry CCI ST15This is a T3 CCI with a fast and slow line as well as extreme lines, a -15,15 filter to make zero line rejections and crosses more mechanical and help weed out whipsaw. I will probably update description in the future and get into more detail about how the indicator is used but for now if you want more info look up woodie CCI patterns :) Good Luck!!
ADX-CCI Trend Entry Signals ADX-driven to understand intensity of move.
CCI-cross over/under "0-line" indicator.
Simple yet effective.


CMF, RSI, CCI, MACD, OBV, Fisher, Stoch RSI, ADX (+DI/-DI)Eight normalized indicators are used in conjunction with the CMF, CCI, MACD, and Stoch RSI indicators. You can track buy and sell decisions by tracking swings. The zero line is for reversal tracking at -20, +20, +50, and +80. You can use any of the nine indicators individually or in combination.

CMF, RSI, CCI, MACD, OBV, Fisher, Stoch RSI, ADX (+DI/-DI)Eight normalized indicators are used in conjunction with the CMF, CCI, MACD, and Stoch RSI indicators. You can track buy and sell decisions by tracking swings. The zero line is for reversal tracking at -20, +20, +50, and +80. You can use any of the nine indicators individually or in combination.

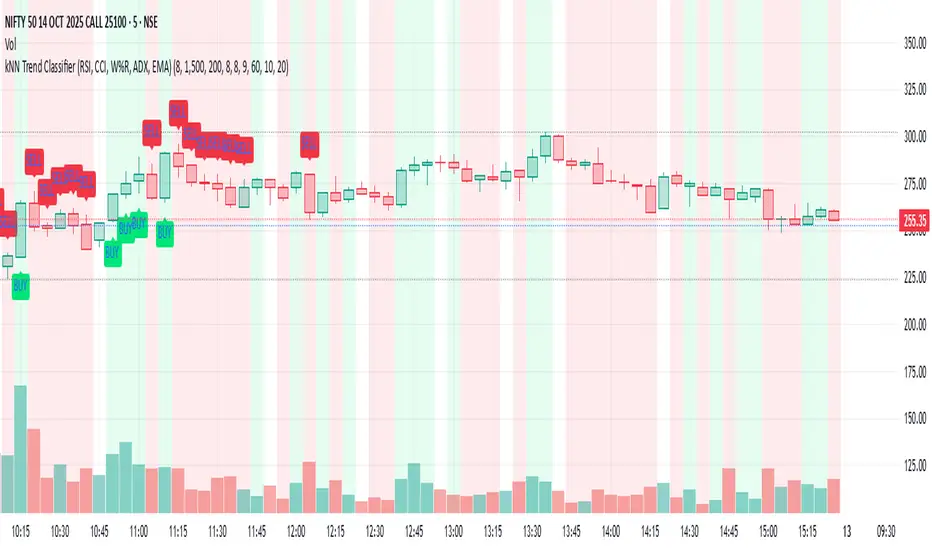
kNN Trend Classifier (RSI, CCI, W%R, ADX, EMA)This Pine Script indicator, "kNN Trend Classifier," is a specialized tool for identifying market trends using a combination of classic technical indicators and a simple machine learning approach. The script is designed for traders who want to blend quantitative analysis with visual chart signals to improve decision-making.
At its core, the indicator utilizes six key features: RSI (14), RSI (9), CCI, Williams %R, ADX, and 9-period EMA. Each of these measures different dimensions of momentum, trend strength, and market positioning. These values are normalized to ensure they are fairly compared across different market conditions. For every bar close, the script stores a historical snapshot of these features and uses a k-Nearest Neighbor (kNN) technique to classify the current trend as bullish or bearish. The kNN algorithm works by calculating the Euclidean distance between the present market state and all stored historical states, then referencing the majority label among the closest neighbors to decide on the market regime.
The script also provides powerful customization. Users can adjust the number of neighbors (k) to make signals more reactive or more stable; increase the training window for a deeper historical perspective; and fine-tune the lookback window for feature normalization. Two optional filters—based on volume percentile and ATR volatility—help to screen out signals in low-liquidity or low-volatility periods, reducing false positives and improving reliability.
To modify the behavior, traders should experiment with the inputs: lower k for faster signal changes, raise k or the training window for smoother signals, and adjust normalization length for different levels of trend sensitivity. Activating the volume and volatility filters is highly recommended during choppy markets. Altogether, this script gives users a robust framework to catch bullish or bearish trends with a blend of proven technical analysis and adaptive pattern recognition.
VIX CCI Oscillator [Compression + EMA Trigger + Bounce Glow]VIX CCI OSCILLATOR
ADJ CHART FOR YOUR LIKING
NOT AS SMOOTH AS PREVIOUS VERSION (STOCH)
SHOWS TIGER SIGNAL ON EMA
SAMEOUTPUT
HUD Box: emoji-coded tactical feedback
bounce 100 "💥 Expansion" :
bounce 0.8 "🔴 Overbought" :
bounce 0.618 "📉 Distribution" :
bounce 0.5 "🧠 Midline" :
bounce 0.382 "📈 Accumulation" :
bounce 0.2 "🟢 Oversold" :
bounce0.0 "💣 Expansion" : "⚪ Neutral"
Tiger EMA/STOCH
This logic checks if the oscillator is trending above or below its 48-period EMA,
If above, it paints the line GREEN🟢 (bullish),
If below, it paints it RED🔴 (bearish),
If compression is active, it overrides both with purple🟣 to highlight tactical squeeze conditions,
⚠️WARNING⚠️
ALWAYS REMEMBER THIS CHART IS VIX/USD
IN MOST CASES SPY MOVES VICE VERSA
I AM NOT RESPOSIBLE FOR YOUR OWN ACTIONS/TRADE IDEAS

RSI-CCI Momentum ScreenerRSI-CCI Momentum Screener;
How to Use:
Apply this script to 1H or 4H timeframe
Works well for NSE stocks, crypto, or forex
Look for a green label “BUY” that shows when the screener conditions are met

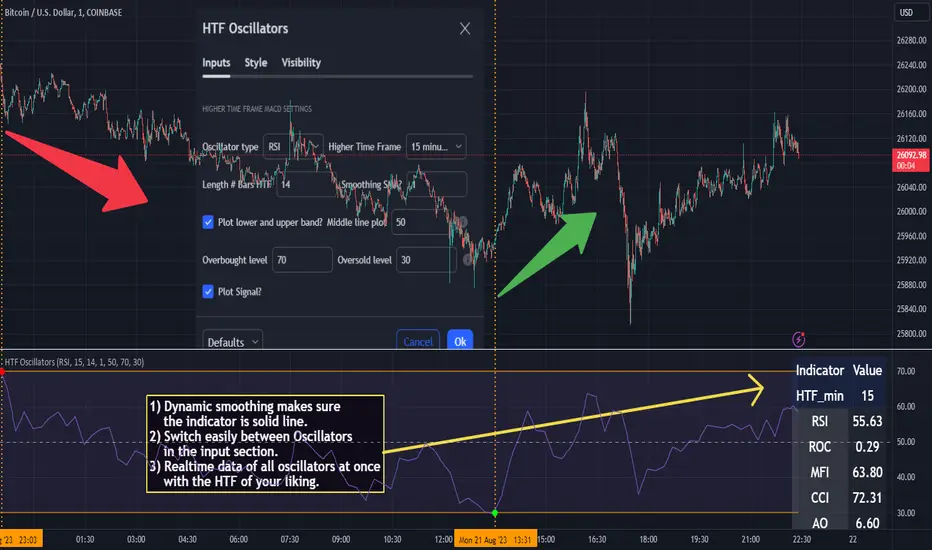
HTF Oscillators RSI/ROC/MFI/CCI/AO - Dynamic SmoothingThe Interplay of Time Frames: A Balanced View
Navigating the markets often involves interpreting trends from multiple angles. The HTF Oscillators with Dynamic Smoothing indicator enables you to do just that. This tool provides the option to integrate smoothed oscillator readings from Higher Time Frames (HTF) into lower time frame charts, such as a 1-minute chart. By doing so, the indicator offers a balanced viewpoint that bridges the gap between micro and macro perspectives, helping you make informed decisions without losing sight of the broader market context.
Features
Multi-Oscillator Support
Choose from a range of popular oscillators like the Relative Strength Index (RSI), Rate of Change (ROC), Money Flow Index (MFI), Commodity Channel Index (CCI), and Awesome Oscillator (AO). These oscillators are commonly used as foundational building blocks in trading strategy scripts by traders worldwide. Switch effortlessly between them, depending on your trading strategy and requirements. To maintain consistency and a familiar user experience, our script adopts the same visual aesthetics that you'll find in Pine Script indicators on TradingView: a sleek purple line for the oscillator and a transparent band filling. These visual elements are not only pleasing to the eye but also widely appreciated by the trading community.
Dynamic Smoothing
The unique dynamic smoothing feature calculates a smoothing factor based on the ratio of minutes between the Higher Time Frame (HTF) and your current time frame. This provides a sleek and responsive oscillator line that still holds the weight of the longer trend. One of the significant advantages of this feature is user experience; when you change your time frame, the HTF-values in your settings will remain consistent. This ensures that you can easily switch between different time frames without losing the insights provided by your selected HTF.
Visual Aids
Visual cues are an essential part of any trading strategy. The indicator not only plots signals to mark overbought and oversold conditions based on the dynamically smoothed oscillator but also provides you with the flexibility to customize your visual experience. You have the option to toggle on/off the display of these signals depending on your specific needs. Additionally, bands can be displayed at overbought and oversold levels, along with a reference middle line. If you switch between different oscillators (available in the parameter settings), remember to manually adjust the bands in the input settings to ensure signals matches with the type of oscillator to your liking.
User-Friendly Settings
We've grouped related settings together, making it easier for you to find what you're looking for. Adjust the oscillator type, length of bars, smoothing settings, and more with just a few clicks.
Information Table
A standout feature of this indicator is the real-time information table, which displays the values of all selected oscillators based on your specified Higher Time Frame (HTF) settings. This can be particularly useful for traders who depend on multiple indicators for their decision-making process. The data presented in the table is synchronized with the HTF options you've configured in the input settings, allowing for a more efficient and quick scan of values from higher time frames.
Educational Corner: The Power of the Information Table and Customization
The table incorporated into this indicator isn't just eye-candy; it's a practical tool designed to elevate your trading strategy. It dynamically displays real-time values of various oscillators for the HTF you've chosen. This is an exemplary use of TradingView's scripting capabilities to blend multiple indicators into a single visual panel, streamlining your analysis and decision-making process.
But here's the best part: You're not limited to what we've created. With some basic understanding of TradingView's scripting language, Pine Script, you can easily adapt this table to include different indicators that suit your unique trading style. The logic in the script is modular and can serve as a foundation for your own customized trading dashboard. So, go ahead, get creative and explore new combinations of indicators that will help you excel in your trading endeavors!
You no longer have to toggle between different charts or indicators to get the information you need; it's all there in one neatly organized table. We encourage you to tap into this feature and make it your own, empowering your trading like never before.
By doing so, you not only gain a more comprehensive toolset, but you also engage more deeply with your trading strategy, understanding its nuances and, ultimately, making more informed decisions.
Conclusion
The HTF Oscillators with Dynamic Smoothing is a versatile and powerful tool that brings together the best of both worlds: the perspective of higher time frames and the granularity of shorter ones. Its feature-rich setting options and real-time information table make it a potential useful addition to your trading toolkit.
Remember, while this indicator offers a comprehensive and smarter way to look at the markets, it is not a foolproof method for predicting market movements. Always use it in conjunction with other analysis methods and risk management strategies.
Supertrend ANY INDICATOR (RSI, MFI, CCI, etc.) + Range FilterThis indicator will generate a supertrend of your chosen configuration on any of the following indicators:
RSI
MFI
Accum/Dist
Momentum
On Balance Volume
CCI
There is also a RANGE FILTER built into the scripts so that you can smooth the indicators for the supertrend. This is an optional configuration in the settings. Also, you can change the oversold/overbought bounds in the settings (they are removed entirely for indicators without bounds).
If you find this indicator useful, please boost it and follow! I am open to suggestions for adding new indicators to this script, it's very simple to add new ones, just suggest them in the comments.

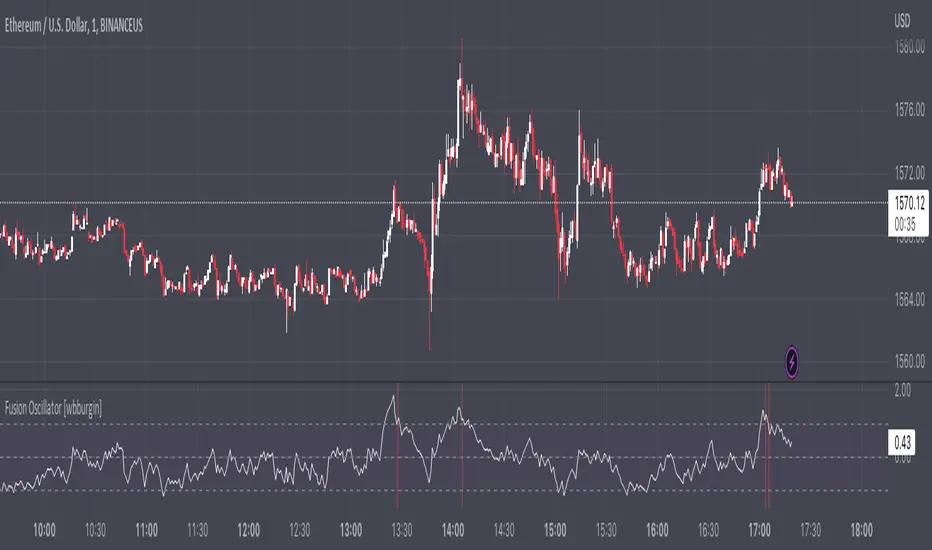
Fusion Oscillator (COMBINED RSI+MFI+MACD+CCI+TSI+RVI)The Fusion Oscillator aggregates several extremely-similar directional oscillators (RSI, MFI, MACD, CCI, TSI, RVI) into one average to visualize indicator agreement. To do this, I normalized several oscillators between to ensure equal weight.
The white line is the directional oscillator . The yellow line (turned off) is the nondirectional oscillator - namely, the ADX and ATR - this determines the buy/sell signals in conjunction with overbought/oversold levels for the directional oscillator.
The overall length is the sensitivity of the oscillator, not the lookback period. The maximum that works on the default settings is 3. Higher means less sensitive and more accurate.
I hope you all find this useful!
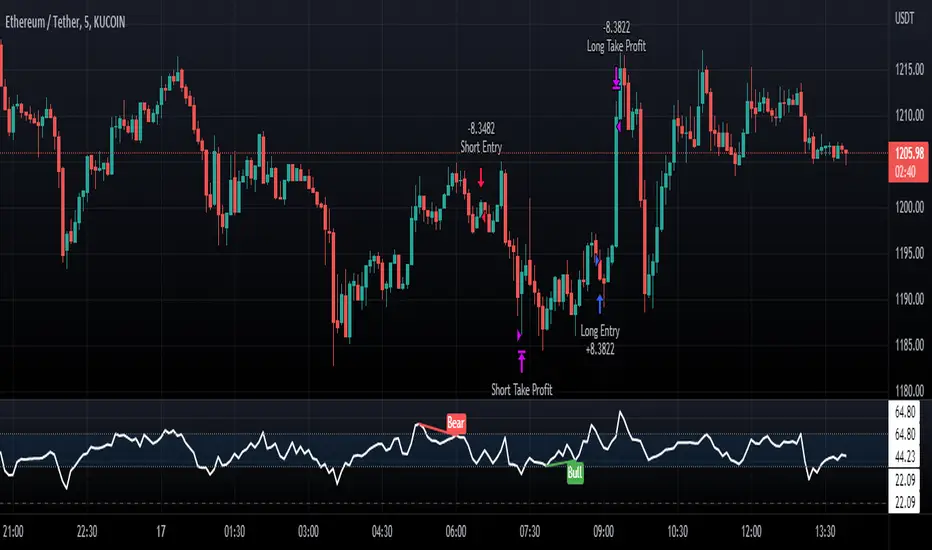
Normalized CCI Divergence StrategyStrategy Overview:
This script takes the Commodity Channel Index and normalizes the equation to be read easier by the user. Bullish, Bearish, Hidden Bullish, and Hidden Bearish divergences are identified and displayed in the underlay. Hidden Bullish and Hidden Bearish are turned off by default, but can be turned on in the user settings. The strategy itself signals long or short based on the appearance of these divergences in addition to previous CCI values being above or below a threshold. *Shorter timeframes such as 5M are recommended.* Take profit, stop loss, and trailing percentages are also included, found at the bottom of the Input tab under “TT and TTP” as well as “Stop Loss”. Make sure to understand the TP/SL ratio that you desire before use, as the desired hit rate/profitability percentage will be affected accordingly. This strategy does NOT guarantee future returns. Apply caution in trading regardless of discretionary or algorithmic. Understand the concepts of risk/reward and the intricacies of each strategy choice before utilizing them in your personal trading.
Profitview Settings
If you wish to utilize Profitview’s automation system, find the included “Profitview Settings” under the Input tab of the strategy settings menu. If not, skip this section entirely as it can be left blank. Options will be “OPEN LONG TITLE”, “OPEN SHORT TITLE”, “CLOSE LONG TITLE”, and “CLOSE SHORT TITLE”. If you wished to trade SOL, for example, you would put “SOL LONG”, “SOL SHORT”, “SOL CLOSE LONG”, and “SOL CLOSE SHORT” in these areas. Within your Profitview extension, ensure that your Alerts all match these titles. To set an alert for use with Profitview, go to the “Alerts” tab in TradingView, then create an alert. Make sure that your desired asset and timeframe are currently displayed on your screen when creating the alert. Under the “Condition” option of the alert, select the strategy, then select the expiration time. If using TradingView Premium, this can be open-ended. Otherwise, select your desired expiration time and date. This can be updated whenever desired to ensure the strategy does not expire. Under “Alert actions”, nothing necessarily needs to be selected unless so desired. Leave the “Alert name” option empty. For the “Message”, delete the generated message and replace it with {{strategy.order.alert_message}} and nothing else.
Quick and Simple - WPR+RSI+CCITake a look.
Couple of confluencial reversal signals from popular indicators (W%R, RSI & CCI). I can only say this shows how random the "stanard tools" are and how the market makers "play" these kind of tools to their advantage.
That said. It's better tha average, but not top-class, so expect to have to take signals with other confluence. DON'T take the plots or signals as buy / sell signals, they are just confluencial movements from these indicators based on how they should be "traditionally" used. Instead, use it as a guide as to what other traders may be thinking, or as a pull-back identifier.
Included 100 period ema as basic trend filter.
Not my normal type of script + been away for some time so be kind, lol :)
You might find it useful however so sharing.
More stuff to follow :)

Suchit RSI CCISuchit RSI CCI strategy uses the Relative Strength Index and Commodity Channel Index levels and their movement for buy and sell calls


Eflatun CCI Divergence and Top/BottomThe Commodity Channel Index (CCI) with Divergence and finding Top / Bottom points
Select MA with Sma, Ema, Wma, SWma, VWma, Hma or Rma
Follow bar color on top or bottom

Crypto rsi cci mf stoch rsi oscillators all in one strategyThis is a strategy based on the popular oscillator like RSI, CCI, MF and Stochastic RSI oscillators.
In this situation I use a very high length , 100 candles, and the middle point between overbought and oversold levels at 50.
The entry for long is when all oscilators are above 50, and the exit is when they are below 50 + plus some minor modifications
If you have any questions, please message me a private message !

Matrix Series and Vix Fix with VWAP CCI and QQE SignalsBased on @ChrisMoody Williams_VIX_Fix and @glaz Matrix Series .
This indicator identify potential zone of reversal according to momentum and volatility.
Includes VWAP CCI and QQE Signals.

SRSI/CCI :: ALLinPower v10.0
Everything you see in this indicator has beed designed with purpose to ease your trading with visual technical analysis of the market. It pulls data from 7 different TimeFrames and it can not be more simpler visual representation of its calculations when applied on chart.
When applied on chart, you will see two sets of WAVES. First set is made out of SRSI calculation and the second is made out of CCI calculation. Both of them follows the same rules.
Background GREEN/RED wave is made out of Multiple Timeframes and it represents a TREND. GREEN for LONG, RED for SHORT trend.
Over the background wave there is a wave made of current TimeFrame data and its main purpose is to see when the POWER of certain direction will diminish. The less time little wave stays in current trend the more likely is that it will change the trend based on lack of power the market is getting in certain direction.
HOW TO USE IT?
Rule 1.
TIMEFRAMES
Choose the best TimeFrame for the job. I use: 1min, 2min, 3min, 5min, 8min, 13min, 21min, 34min or 56min (golden ratio). You can also pick a different TF but only to up to 1h TF chart as it does not work well with TF over 1h. Smaller TF is used for SCALPING of DAY TRADING higher TF is used for SWING TRADING. You get the picture?
Rule 2
TO ENTER BUY/LONG POSITION: When big trend wave is below the middle line and coloured in RED and little wave just entered the area and exits it very soon after. Basically when RED straight line gets smaller and smaller (the POWER of SHORT diminishes) it is a sign for LONG.
TO ENTER SELL/SHORT POSITION: When big trend wave is over the middle line and coloured in GREEN and little wave just entered the area and exits it very soon after. Basically when GREEN straight line gets smaller and smaller (the POWER of LONG diminishes) it is a sign for SHORT.
To ease yourself the spotting of this instances just follow the GREEN/RED dots and use ALERTS (choose BUY POWER for LONG signals or choose SELL POWER for SHORT signals) to make yourself free from staring at a computer/mobile all the time and just wait for a signal.
Rule 3
CAUTION
Do not rush to enter a position and try to predict what indicator will do next. It does not end well.
Be aware you are not exiting a position in panic that would be too soon or even worse, you get married to bad trade and you are not exiting even though you should exit by many signals you get.
Use risk management strategy to protect your capital.
Follow the rules and make your trading easier and better.

Combo Backtest 123 Reversal & FX Sniper: T3-CCI This is combo strategies for get a cumulative signal.
First strategy
This System was created from the Book "How I Tripled My Money In The
Futures Market" by Ulf Jensen, Page 183. This is reverse type of strategies.
The strategy buys at market, if close price is higher than the previous close
during 2 days and the meaning of 9-days Stochastic Slow Oscillator is lower than 50.
The strategy sells at market, if close price is lower than the previous close price
during 2 days and the meaning of 9-days Stochastic Fast Oscillator is higher than 50.
Second strategy
This simple indicator gives you a lot of useful information - when to enter, when to exit
and how to reduce risks by entering a trade on a double confirmed signal.
You can use in the xPrice any series: Open, High, Low, Close, HL2, HLC3, OHLC4 and ect...
WARNING:
- For purpose educate only
- This script to change bars colors.

Combo Strategy 123 Reversal & FX Sniper: T3-CCI This is combo strategies for get a cumulative signal.
First strategy
This System was created from the Book "How I Tripled My Money In The
Futures Market" by Ulf Jensen, Page 183. This is reverse type of strategies.
The strategy buys at market, if close price is higher than the previous close
during 2 days and the meaning of 9-days Stochastic Slow Oscillator is lower than 50.
The strategy sells at market, if close price is lower than the previous close price
during 2 days and the meaning of 9-days Stochastic Fast Oscillator is higher than 50.
Second strategy
This simple indicator gives you a lot of useful information - when to enter, when to exit
and how to reduce risks by entering a trade on a double confirmed signal.
You can use in the xPrice any series: Open, High, Low, Close, HL2, HLC3, OHLC4 and ect...
WARNING:
- For purpose educate only
- This script to change bars colors.
