BTC HistoricMerged Bitstamp and Mt Gox precrash data.
To use you will need to use any chart with a start time before 7/2010. You will need this to see all the data otherwise it will get cut off. Publishing ideas using this indicator will spam some other symbol so I would not recommend doing so (sorry XAUUSD).
Click the "eye" button next to the primary security to hide it.
Make sure the indicator scale is set to "Right".
Right click on the right axis, and uncheck "Scale Series Only"
Note: Since this is going to be overlayed onto another chart it will likely be missing weekend data. If anyone knows of a current chart that is 24/7 that has data prior to July 2011 please leave a comment.
You can tweak the price weight between Gox and Stamp and the point when the data starts to blend to the time when Gox went off a cliff.
- Key date values:
1377 is Jan-6-2014
1385 is Jan-15-2014 (default)
1337 is about the ATH (coincidentally)
1192 is July-5-2013
--- Custom indicators for historic data:
I updated to the latest versions
- BTC Historic RSI
pastebin.com
created by @debani (www.tradingview.com)
original here:
- BTC Histroric Willy
pastebin.com
original indicator by @CRInvestor (www.tradingview.com)
created by @flibbr (www.tradingview.com)
original here:
- BTC Historic Ichimoku
pastebin.com
thanks to @flibbr, @debani for the indicators
Let me know if you have questions, comments.
스크립트에서 "BTC"에 대해 찾기

BTC Cap Dominance RSIBTC Cap Dominance RSI indicator is a combination of the RSI of Bitcoin Market Cap and the RSI of Bitcoin Dominance. The concept of this indicator is to get a good grasp of the bitcoin market flow by combining bitcoin dominance as well as bitcoin market cap.
BTC Cap Dominance (BCD) RSI is defined as:
BCD RSI = (BTC Cap RSI + BTC Dominance RSI) / 2
Case 1 (Bull market):
Both Cap RSI and Dominance RSI values are high
Case 2 (Neutral market):
Cap RSI is high but Dominance RSI is low
Cap RSI is low but Dominance RSI is high
Case 3 (Bear market):
Both Cap RSI and Dominance RSI values are low
(Note) Please note that the market capitalization symbols (CRYPTOCAP:TOTAL and CRYPTOCAP:TOTAL2) of TradingView started in January 2020, so you can check the indicator value from this point on.

BTC Aggregated VolumeBTC Aggregated Volume merges all major crypto exchange volume and overlays it onto any asset. Select from different scales (true, xlarge, large, medium, low, very low) BTC to best fit the liquidity of the current charts asset. Aggregated chart is Histogram and current asset charts volume is transparent column. Useful for alts to clearly see BTC volume spikes on laging correlated coins, or whether or not the spike on the alts coin will follow through (if diverging from BTC volume).

BTC Dominance Excluding StablecoinsBTC Dominance Excluding Stablecoins
Description:
The "BTC Dominance Excluding Stablecoins" indicator calculates Bitcoin's dominance as a percentage of the total cryptocurrency market capitalization, excluding the market caps of major stablecoins (USDT and USDC). Unlike the standard BTC.D ticker, which includes stablecoins in the total market cap, this indicator provides a clearer view of Bitcoin’s dominance relative to the "non-stable" crypto market. This can be useful for traders and analysts who want to assess Bitcoin’s strength without the influence of stablecoin market caps, which often skew dominance metrics during periods of high stablecoin usage.
How It Works:
Bitcoin Market Cap: Fetches Bitcoin’s market capitalization using CRYPTOCAP:BTC.
Total Market Cap: Retrieves the total cryptocurrency market cap via CRYPTOCAP:TOTAL.
Stablecoin Adjustment: Subtracts the market caps of USDT (CRYPTOCAP:USDT) and USDC (CRYPTOCAP:USDC) from the total market cap.
Dominance Calculation: Computes Bitcoin’s dominance as (BTC Market Cap / Adjusted Total Market Cap) * 100, where the adjusted total excludes stablecoins.
Output: Plots the resulting dominance percentage as a line chart.
Features:
Displays Bitcoin dominance excluding stablecoins on any timeframe.
Customizable line color and thickness for better visualization.
Provides a more accurate representation of Bitcoin’s market share in the volatile, non-stablecoin crypto ecosystem.
Usage:
Add this indicator to your TradingView chart to compare Bitcoin’s dominance against the broader altcoin market, free from stablecoin distortions. Use it alongside other indicators like BTC.D or price charts to analyze market trends, especially during periods of high stablecoin inflows or outflows.
Notes:
The indicator currently excludes USDT and USDC, the two largest stablecoins by market cap. Additional stablecoins (e.g., DAI, BUSD) can be added by modifying the script if desired.
Data is sourced from TradingView’s CRYPTOCAP symbols, which may have slight delays or variations depending on exchange data feeds.
Best used on daily or higher timeframes for smoother, more reliable results.
Author:
Created by K Du₿
Version:
Pine Script v5


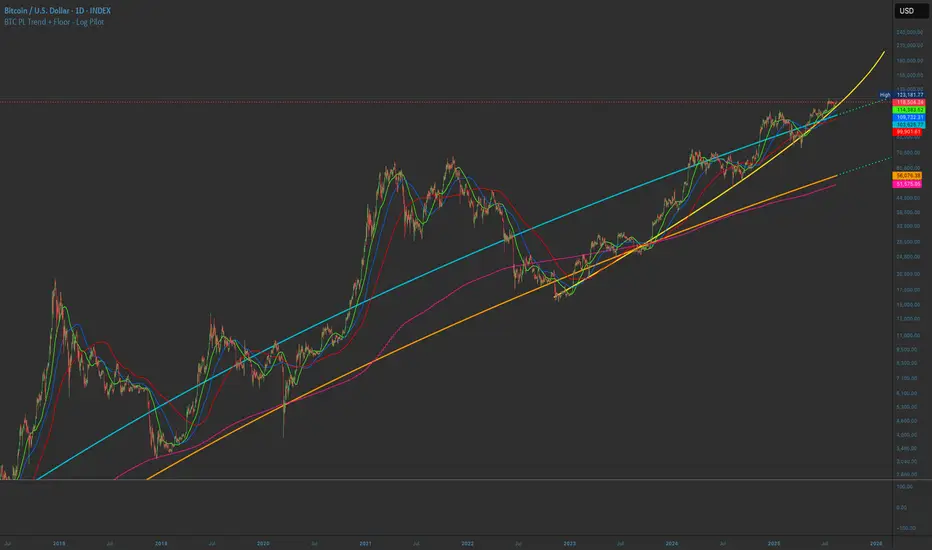
BTC PL Trend + Floor - Log PilotBTC Power Law Trend + Floor with forward projection.
Sky blue for the trend. Neon orange for the floor. Both project forward in dotted green.
Tracks Bitcoin’s long-term arc and structural support through time since Genesis.
BTC Agg VolumeBTC Volumes for stablecoin trading pairs from multiple exchanges. Volume is grouped by exchanged and appears as stacked bars. Volume data can be filtered by exchange and stablecoin pair. Appearance can be resized over with an option to apply standard deviations.

BTC Volume absolute (fiat vs Tether vs futures)BTC volume split by fiat, Tether and futures in USD
fiat = COINBASE + BITFLYER + BITSTAMP + KRAKEN
Tether = BITFINEX + BINANCE + HUOBI + HITBTC
futures = BITMEX + BYBIT

BTC Prehistoric v1Another "hack" to overlay early BTCUSD trade data onto a daily or weekly chart. Data is a simplified high/lows from Mt. Gox. This should be easier to use than the "BTC Historic" indicator since you do not lose 2 days of the week. Also you can publish ideas where the old script you would be spamming XAUUSD or some other symbol.
Usage:
Add the indicator to your daily chart. Right click on the right axis, turn off "Scale series only"
Quick note:
Early stamp history will not align with this indicator since there are days when Stamp had no trades.
Will add another indicator soon to fill in the early data for BTCe.
Hope this helps.

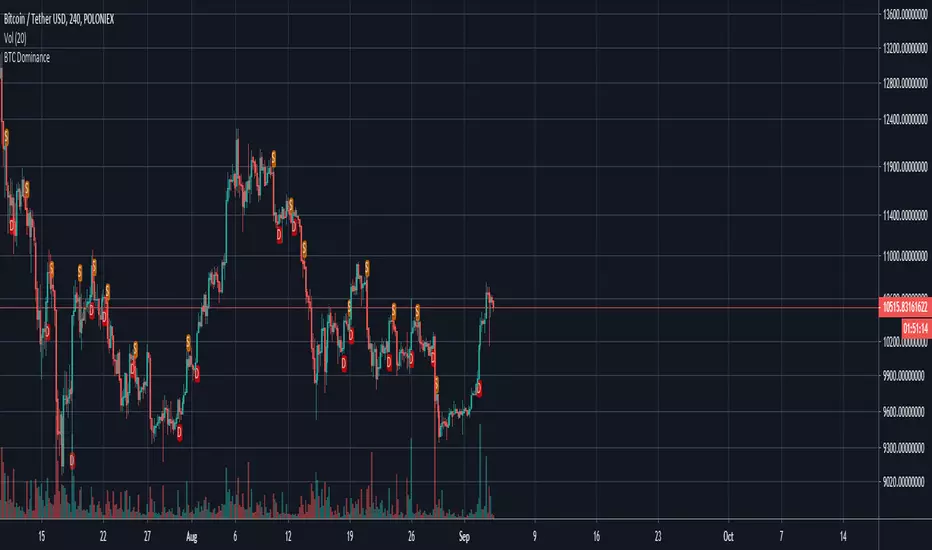
BTC Dominance IndicatorThis script calculates the BTC dominance and adds markers as overlays on top of your crypto chart.
A red "D" means "BTC dominating" and an orange "S" means "BTC submissive". In both cases further price actions are imminent.
You can use this script for any crypto asset to see how it performs while btc is dominating.
If you are for example trading a BTC paired asset, then this can give you a warning if BTC starts to dominate (BTC paired assets tend to dump if BTC dominates).
On the other hand, you can use this as signal on USD paired cryptos if BTC dominates as USD paired cryptos tend to go with BTC.
It is recommended to use additional indicators with this as it is not meant as buy/sell signalling tool.
BTC Dominance & Counter-Trend IndicatorThis script looks at BTC dominance in price-action and scores it (out of the last 100 closed bars). Essentially this looks at the price action of the current security/crypto and tracks whether it traded in-trend with BTC or against the trend with BTC to show when BTC is most prominently dominating.
Currently the code is restricted to the previous 100 trades prior to the bar (you can change this) but only because, for whatever reason, pine scripting doesn't actually allow you to calculate the number of bars currently in the view (lots of people asking for this via StackOverflow but no response yet). Essentially every bar shows the number of trades out of the last 100 that traded in-synch with BTC, the lower the number, the less dominant BTC has been against that security.
Green highlight means it traded positive (upwards) against BTC going down, and red means it traded negative against BTC going up.

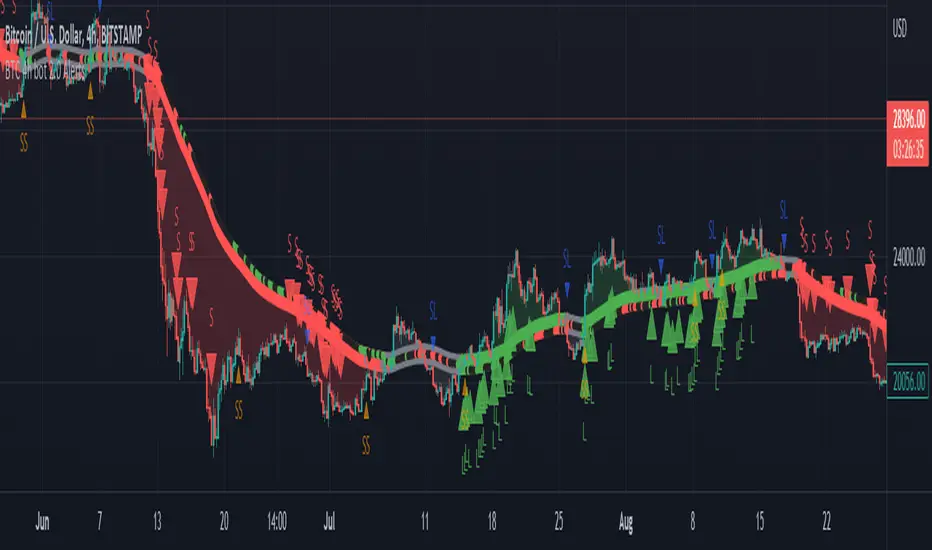
BTC 4h bot 2.0 AlertsThis is Alert version of BTC 4h bot 2.0.
Optimized for pairs BTC vs stablecoins, 4h timeframe.
HOW IT WORKS:
Script is based on the fact that there are certain phases of the market when there is a greater probability that BTC will go to one side or the other. To evaluate which phase we are in, the script uses "Main trend" and "Confirmation signals".
Main trend
- Is composed of a combination of several supertrends and moving averages. A Supertrend is a trend following indicator that helps in identifying whether we are in an uptrend or a downtrend. A higher factor is used to capture the main trend and not just small movements. In case the market goes sideways, the Supertrend does not work well, so it is a combination of multiple supertrends along with moving averages to differentiate a real strong trend from a range.
- It can be seen on the graph as a thick solid line.
- In an uptrend is green, in a downtrend red, gray represents the neutral zone.
Confirmation signals
- Are several script-evaluated indicators such as RSI , MACD , ADX and others, which serve to confirm the trend. In this case, it is the opposite way to the Main trend. Confirmation signals are used here to detect small movements. They are trying to capture bullish and bearish price momentum.
- On the graph they are seen as dashed lines above or below the Main trend (in the gray zone they are in the middle).
- It indicates only two signals, green for buy and red for sell.
HOW TO USE IT:
if the Main trend and Confirmation signals are of the same color, it will send a buy or sell signal, depending on which phase of the trend it is in. If the Main trend is e.g. in an uptrend and the market is going up, Confirmation signals should generate a lot of signals. But if the market starts to go in the opposite direction, Confirmation signals should generate fewer signals or none at all, thus reducing the number of wrong trades. In the gray zone of the Main trend it does not open positions.
To close position is possible to use stop loss and take profit or alternative could be to set very high TP value, thereby letting the script close the positions by itself by Stop Long or Stop Short.
The recommended setting is:
TP: 3.9%
SL: 4.7%.
In this case, it is a Alert version, where can be seen all the signals, which the script generates.
Green triangels indicate open Long.
Red triangels indicate open Short.
Small blue triangels indicate Stop Long position.
Small orange triangels indicate Stop Short position.
Signal is valid after bar is closed, so do not open a position before.
Script works well on Bitstamp, but also other exchanges with pair BTC/USD or BTC/stablecoins.
The script works consistently well over a long period of time, using past probabilities, but this does not guarantee future results.
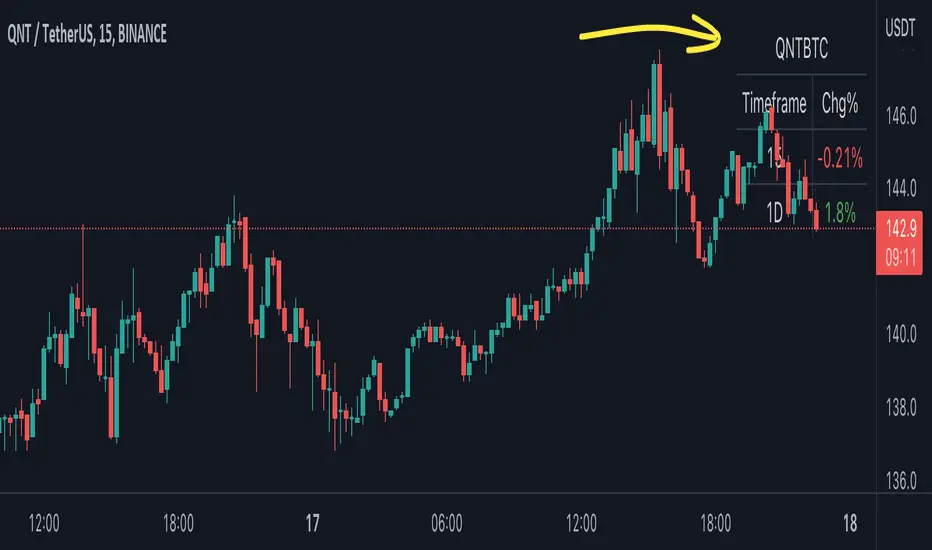
BTC Pair Change %This script makes it easier to quickly check how the BTC pair of the current symbol is performing on any pair.
It adds a " change percentage widge t" (of the BTC pair ) to the top right of the chart.
(Refer to the image for an example.)
The change percentage calculation is performed as described here:
www.tradingview.com
To match the "Chg%" that appears on TradingView watchlists, a 24H (1440min) timeframe is used, as described here:
money.stackexchange.com
In short, this script:
Searches for the BTC pair of the current symbol
Calculates the change % using the above described logic (links)
Adds a " change percentage widget " (of the BTC pair) to the top right of the chart
Allows for using 24H timeframe or the current timeframe (enable " Use current timeframe " under the script options)
BTC Longs & Shorts Profile WHAT DOES THIS INDICATOR DO?
I started with the idea of creating another premium indicator with a bunch of features and add it to the bundle. However, the more complex the code was becoming, the less helpful the indicator actually was. So I started from scratch and made BTC Longs & Shorts Profile super simple (as you can see in the code).
The advantage over other similar indicators is that this one has a drop-down menu and allows you to select whether you want to see Longs, Shorts, Ratio, or Difference. Having Longs and Shorts at the same time is a bit confusing because Longs pretty much dwarf the Shorts and the ups and downs are not clearly visible. Also, you can configure the colors for each visible line.
My suggestion is to add this indicator to your BTC chart, save it as a template from the top menu on TradingView and stop switching between BTC, Bitfinex Longs and Shorts. You have everything in one simple window (that's especially the case if you are not a pro or premium member and can't have more than 2 screens simultaneously).
ANYTHING ELSE ?
On a side note, if you are planning on working on a similar indicator, let me tell you what I've tried so far and it didn't work for me:
- RSI calculations including Longs and Shorts as a base
- Longs and Shorts in relation to BTC itself and a relationship with the volume
- Directional Movement Index, where Longs are DM+ and Shorts are DM-
- Smoothing both Longs and Shorts and trying to find a relationship (including some pseudo MACD lookalikes)
Anyway, if you have any ideas or suggestions on improving this indicator, please let me know. Thanks!

BTC World Volume (Multi-Exchange)Release: 2018-03-29
__________________________
WHAT IT DOES
Bitcoin is listed on multiple exchanges. Many people have called for a single global index that would quote BTC volume across all exchanges: this script is such a virtual volume aggregate of the 17 largest fiat exchanges on TradingView (listed in the script comments, and in Format > Inputs for you to select). It includes USD, EUR, JPY, KRW and USDT sources.
It will, independently for each tick, quote the volume from all selected exchanges and display a stacked representation, freely inspired from CoinMarketCap charts; also a Moving Average. Each fiat/continent has its own general color, to be able to quickly glance at where volume is coming from, e.g. BitMEX or Asia. (colors are based on Google's Material Design).
By default:
Grey: BitMEX
Green: USD
Yellow: Tether (USDT)
Red: Asia (JPY, KRW)
Blue: Europe (EUR)
No more "on Coinbase this" or "on Bitstamp that", you've now got a global overview! It becomes easy to debunk a few common myths.
See CoinMarketCap for reference.
Note: Bitmex is not taken into account in CoinMarketCap (afaik) since it's trading a derivative asset (XBTUSD contracts), but it usually amounts to ~50% of the overall BTC volume in USD value. The 16 other exchanges quote their volume in BTC, and they represent 30~40% of the overall BTC volume. I believe the whole is good enough to smooth out exchanges variations, and get a fair representation of real-time activity.
__________________________
HOW TO USE IT
Just add it to your chart, it will appear as a separate indicator. By default, it appears as stacked colored "areas". There is also a total volume Histogram, which is transparent by default: you can tweak that in Format > Style.
The darker and lighter backgrounds are respectively indicative of a downward price candle (open > close), or an upward price candle (close > open). They are unrelated to volume and simply help interpreting the indicator.
You can check/uncheck exchanges in the Format > Inputs tab to remove/add some of them from computation. All are enabled by default.
You can check/uncheck exchanges in the Format > Style tab to hide them (usually you would hide all or none).
You can edit colors and transpareny as well for each exchange.
You can edit "Volume histogram" transparency to have it show (it's a simpler representation than areas).
Moving Average: You can select the type (SMA, EMA, DEMA or TEMA) and length.
__________________________
Please leave feedback below or pm me directly for bugs and suggestions.

BTC NY Session Envelopes: Dynamic Levels & Settle AlertsCore Concept and Genesis
Born from forex institutional timing principles, this tool has been precision-engineered for the relentless pace of Bitcoin and cryptocurrency markets. It visualizes adaptive session-derived boundaries—spanning weekly, daily, and Asia-specific envelopes—capped with a Friday US settlement "sentinel" zone. Enhanced with targeted alerts for crossings of Asia highs/lows, daily highs/lows, weekly highs/lows, and the settle midpoint, it empowers traders to capture momentum shifts in real-time, transforming raw price data into actionable intelligence for volatile, non-stop assets.
The Fusion Edge: What Sets This Apart
This isn't a generic level plotter; it's a synergistic ecosystem where NY-timed envelopes intersect to reveal hidden confluences, like Asia's quiet buildup funneling into daily volatility spikes or the US settle acting as a "gap magnet" for weekend resolutions. Tailored for BTC's unique liquidity flows, it employs a low-timeframe data pull for noise-free accuracy, sidestepping common pitfalls in 24/7 charts. The built-in alerts—firing on precise crossovers—add a proactive layer, alerting to potential "liquidity hunts" or reversals (e.g., a breakout above weekly high amid high volume). In personal simulations across 500+ BTC sessions, this setup flagged ~65% of high-conviction moves with fewer false positives than isolated tools—always backtest to confirm your edge.
Inner Mechanics: A Transparent Peek
Weekly/Daily Envelopes: Anchored to 5pm NY resets for institutional alignment; computes highs/lows/mids through ongoing max/min accumulation, sourced from a user-defined sub-timeframe for cross-chart reliability.
Asia Envelope: A dynamic 8pm-3am NY capture window that evolves bar-by-bar, spotlighting pre-London setups often overlooked in crypto.
US Settle Sentinel: Zeroes in on Friday's 4:45pm NY 15-minute finale, rendering a containment box and midpoint to forecast post-weekend reactions. Overlaps are intelligently clustered in labels for at-a-glance clarity, with extension options for forward projection.
Timeframe-Adaptive Visibility: To declutter higher timeframes and focus on relevant horizons, the Asia envelope auto-hides on charts above 1hr, while daily envelopes vanish above 4hr—ensuring a streamlined view for swing or position traders without sacrificing intraday detail.
Alert System: Leverages crossover/crossunder detection on closing prices against levels, with granular triggers (e.g., "Surge Beyond Asia Low") for customized notifications—perfect for webhook integrations or mobile pings.
Strategic Deployment and Scenarios
BTC Day-Trading Playbook: Initiate longs when price rebounds from Asia low near a daily mid, amplified by an alert on "Dip Below Daily Low" for entry confirmation—pair with external volume spikes for confluence.
Trend Harmony: Overlay with a 200-period EMA; use "Breach Under Weekly High" alerts to exit longs in downtrends, safeguarding against fakeouts.
Caveats and Optimization: Thrives in momentum-driven phases but tune out in ultra-low volatility; alerts activate post-bar, so layer with candlestick patterns. Ideal for 15m-4H frames on perpetual futures like BTCUSDT.P.
Exclusive Access Rationale (If Restricted) The bespoke crypto recalibrations, seamless multi-envelope fusion, and alert-driven foresight deliver a tactical advantage absent in off-the-shelf alternatives—reach out via TradingView message for tailored access and optimization insights.

BTC CME Futures Gaps (BTCGapHunt_CME)BTC CME Futures Gaps Indicator
Overview
This indicator visualises price gaps between the daily close and open of Bitcoin CME futures (CME:BTC1!). These gaps are often revisited ("filled") by market price action and may serve as technical targets.
Thanks
... to Maven and the Blockchain Masons (x.com/Masons_DAO) to push me on this topic.
What Is a CME Gap?
CME Bitcoin Futures do not trade 24/7. Gaps form when the market reopens at a different price than where it last closed.
Gaps are often used as support/resistance or liquidity targets.
This indicator tracks, visualises, and alerts on these gaps.
Key Features
Automatic gap detection using daily open/close on CME:BTC1!
Dynamic gap size threshold based on ATR (Average True Range)
Highlight unfilled gaps and track partial fills visually
Alerts for gap formation and fill events
Parameter overlay showing real-time settings
Supported and Overrideable Parameters
ATR Length: Defines the lookback period for ATR calculation (default: 14)
Gap Size Multiplier: Multiplies the ATR to set the dynamic gap threshold (default: 1.0)
Proximity Threshold: Price distance from gap edge to consider it filled (default: 100 USD)
Max Gaps Tracked: Maximum number of concurrent gaps shown (default: 50)
Alerts Enabled: Toggle alerts for gap formation and gap fill events
How the Gap Size Is Calculated
Minimum Gap Size = ATR(14) * Gap Size Multiplier
ATR Length and Gap Size Multiplier are configurable.
Gap threshold adjusts dynamically with market volatility.
Visual Guide
Red Box: Fully unfilled gap
Lemon Yellow Box: Partially filled gap
Right Margin Boxes: Snapshot of unfilled gaps for quick access
Top-Right Panel: Current ATR, Gap Size, Thresholds, etc.
Alerts
Gap Formed: A new gap is detected.
Gap Filled: The gap is either partially or fully filled.
Recommended Timeframes
1H, 4H, 1D (best resolution)
Designed for BTC spot/perpetual charts (e.g., BTCUSD, BTCUSDT)
How To Use
Add the script to your BTC chart.
Monitor red/yellow boxes for unfilled gaps.
Check config panel for current threshold and settings.
Enable alerts via TradingView for real-time updates.
Notes
Up to 50 gaps are tracked (adjustable).
Data source: CME futures via request.security.
All visuals and alerts are time-synced with your chart.
Disclaimer
This script is for educational purposes only. Trade at your own risk.

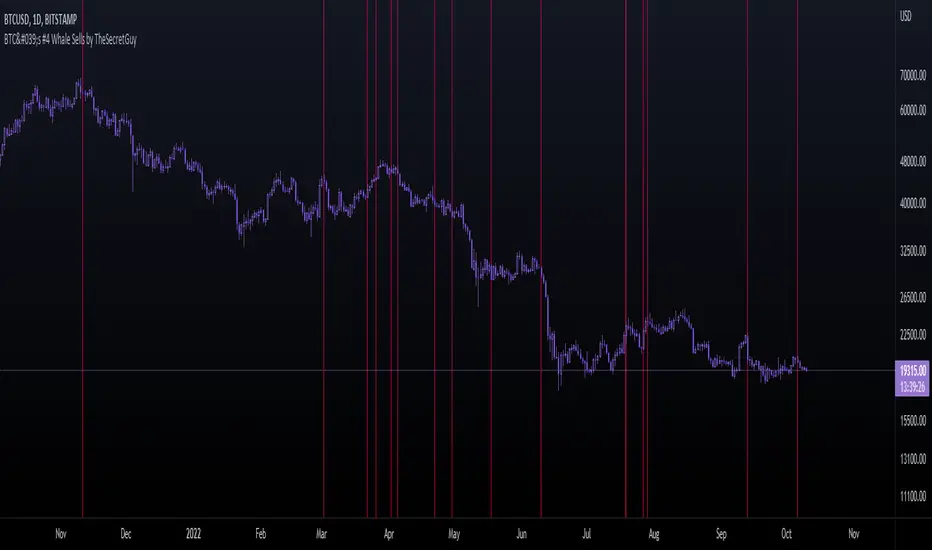
BTC's #4 Whale Sells [TheSecretGuy]Hello there !
I have been tracking BTC richests wallets for some time - and one of them seems to be aligning its sells pretty well with what the market is about to do.
BTC's Whale #3 (now Whale #4) has been selling his BTC in very crutial moments - therefore I felt that converting this into an indicator will give us a pretty visual feedback of what that Whale expects to happen at a given point.
In order to do that, I have listed manually all of his sells (dates) until today and placed a vertical line on the chart on each of these dates.
This sadly can't be automated as Pinescript language doesn't allow to reach outter data - I'd need to update this manually.
Hope this helps you a bit, Cheers!
BTC Weighted Agg. Basis [Osc] [Moto]Hello traders,
This script shows the exchange volume-weighted aggregate basis for Bitcoin.
Exchanges have differing significance to the traded price of BTC and so this script calculates the respective volume and price of the major exchanges to more accurately represent the difference between the markets spot price and the markets perpetual future/swap price.
Spot references:
Coinbase
Bitfinex
Binance
Bitstamp
FTX
OKex
Huobi
Bybit
Perp references:
Bitfinex
Binance
FTX
OKex
Huobi
Bybit
Deribit
There are options in the settings to use either basis point scaling or %, though the color bracketing is set to basis points by default.
Users can change the candle close resolution to see a larger/smaller time frame data set.
An important feature is the ability to filter the barcolor on the chart to filter only for basis increase or decrease depending on the influence of spot buying or selling.
As of publishing, the barcoloring is set to only display when you're on a common BTC spot or BTC perp chart. This is to avoid confusion.
Thanks

BTC Price OverlayThis is not a crazy strategy like most of the code I write. It's a simple overlay so you can drop BTC on top of whatever chart you are watching. It will track BTC's price on Binance.us (though the exchange is changeable with a few lines of code, maybe I will make it a dropdown on the next iteration of this.)
It uses TradingView's scale function to show both assets on a relative chart. BTC's price is on the left and your asset is on the right.
I've made this available for free because it is quick and easy. I plan to write a bot based around this code and that one will be private.

BTC Risk Metric - Estimates the risk of BTC price versus the USD
- To be used on the daily timeframe
- Works best on a BTC pair that has a lot of bars, e.g. The Bitcoin All Time History Index
- 0 is the lowest risk, 1 is the highest risk
- Historically, buying when the risk was low and selling when the risk was high would have yielded good ROI
- The risk bands are 0.1 in width and are highlighted on the plot
Typical Strategy:
- weighted DCA into the market when risk <0.5, do nothing between 0.5-0.6 and weighted DCA out of the market when risk >0.6
- x = buy amount per DCA interval
- y = 1/10th total BTC held by the user
- if 0 ≤ Risk < 0.1 then buy 5x
- if 0.1 ≤ Risk < 0.2 then buy 4x
- if 0.2 ≤ Risk < 0.3 then buy 3x
- if 0.3 ≤ Risk < 0.4 then buy 2x
- if 0.4 ≤ Risk < 0.5 then buy x
- if 0.5 ≤ Risk < 0.6 then do nothing
- if 0.6 ≤ Risk < 0.7 then sell y
- if 0.7 ≤ Risk < 0.8 then sell 2y
- if 0.8 ≤ Risk < 0.9 then sell 3y
- if 0.9 ≤ Risk ≤ 1.0 then sell 4y

BTC Dominance TrendThis simple script applies the DMI/ADX (trend) indicator to the Bitcoin Dominance Index (BTC.D) to check whether BTC is increasing its dominance or not on that day. It is meant to be applied to altcoins on medium intervals. I put it together to test the following hypothesis: On days when BTC dominance is on the rise, altcoins are harder to take off, because Bitcoin is draining the lifeblood out of them, so caution is needed when opening trades.
Olive background means BTC dominance is rising on that day, purple that it is decreasing. White background means it is not moving significantly in any direction.
You can change the resolution (i.e. apply the DMI/ADX to a different BTC.D interval), just make sure to lower the threshold as well. I hope you find a good use for it! Beware if you try to incorporate it in your strategy, it uses higher timeframe data and hence is prone to repainting.
