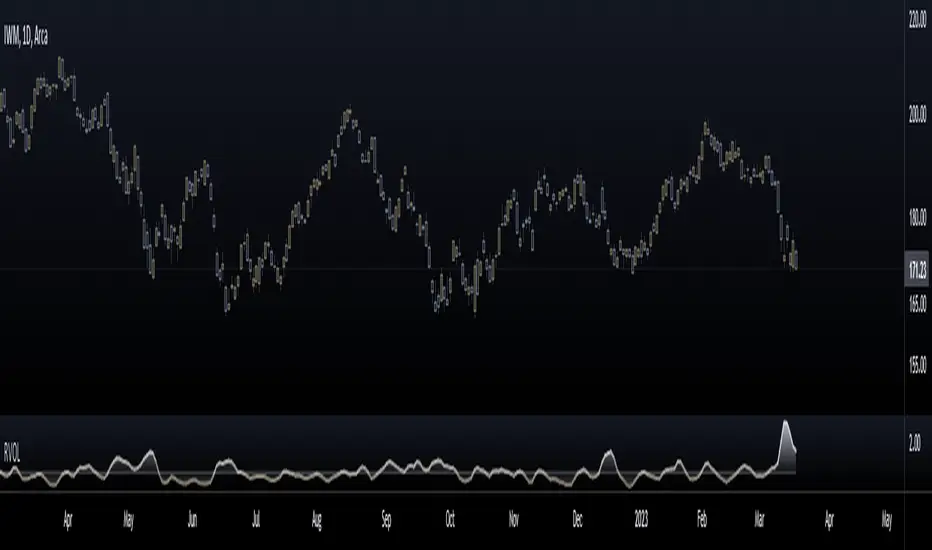
Relative Volume (RVOL)Relative Volume is calculated by taking the ratio of current volume relative to a moving average of your choice. It gives you a quick way to see how much volume is involved in the current movement relative to a recent period.
Features:
-Customizable Moving Average: You can choose the period (default is 21) and type (SMA or EMA)
-Customizable base level: Default setting is 1.
-Smoothing option: Uses a Hull moving average to smooth out the RVOL area plot, by default its turned off.
Enjoy!
Rvol
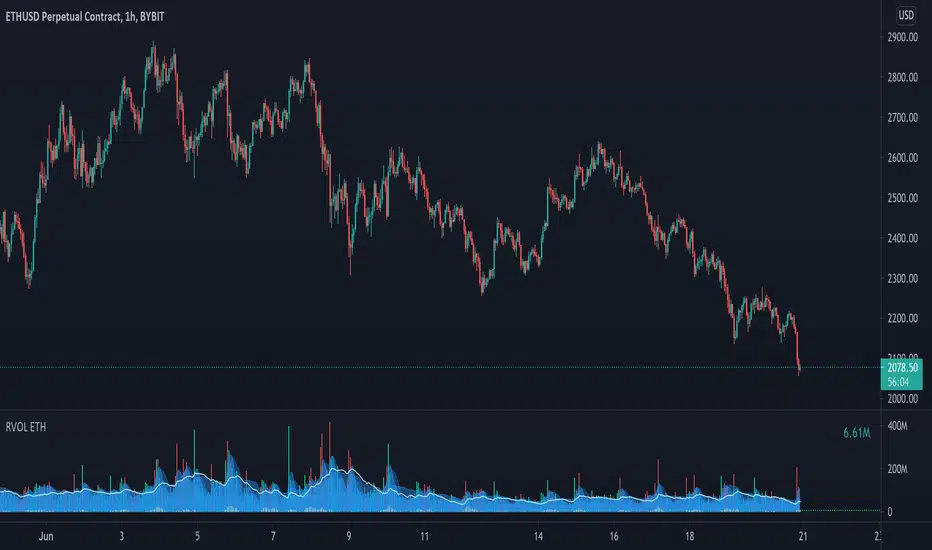
Relative Volume - ETHEREUMRelative Volume indicator that pulls data from 9 different Ethereum exchanges. Please note that this indicator only works with ETH and will not use data from your current chart.
Includes the following exchanges:
BYBIT:ETHUSD
BITFINEX:ETHUSD
BITSTAMP:ETHUSD
INDEX:ETHUSD
COINBASE:ETHUSD
FTX:ETHUSD
PHEMEX:ETHUSD
BITTREX:ETHUSD
POLONIEX:ETHUSDT
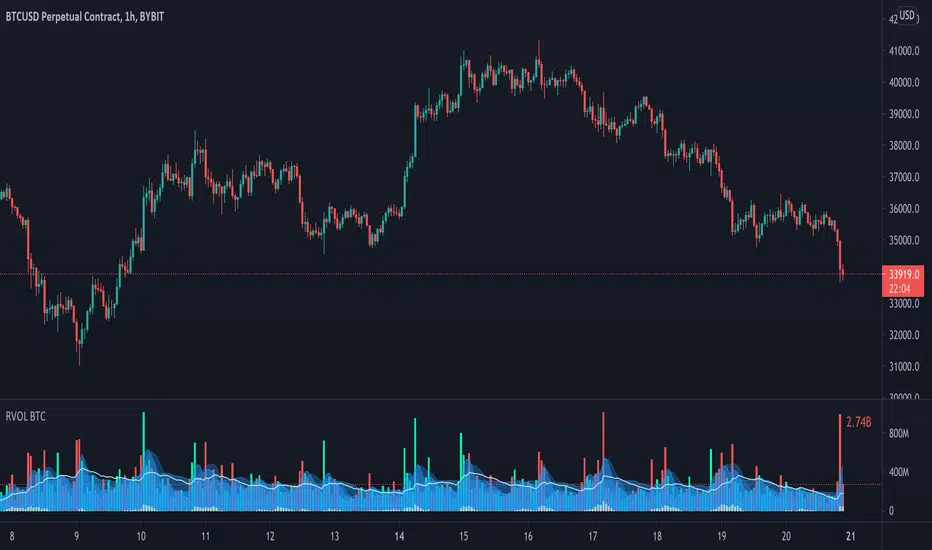
Relative Volume - BITCOINRelative Volume indicator that pulls data from 9 different Bitcoin exchanges. Please note that this indicator only works with BTC and will not use data from your current chart.
Includes the following exchanges:
BYBIT:BTCUSD
BITFINEX:BTCUSD
BITSTAMP:BTCUSD
INDEX:BTCUSD
COINBASE:BTCUSD
FTX:BTCUSD
PHEMEX:BTCUSD
BITTREX:BTCUSD
POLONIEX:BTCUSDT
Relative VolumeVolume can be a very useful tool if used correctly. Relative volume is designed to filter out the noise and highlight anomalies assisting traders in tracking institutional movements. This tool can be used to identify stop loss hunters and organized dumps. It uses a variety of moving averages to hide usual activity and features an LSMA line to show trend. Trend columns are shown to highlight activity and can be seen at bottom of the volume columns, this is done using ZLSMA and LSMA.
The above chart shows an example of 2 indicators being used on the 15 min chart. The bottom indicator is set to the 1 min chart. Traders can see a large dump on the 1 min chart as institutions wipe out any tight stop losses. Next they buy back in scooping up all those long positions.
This is an example layout using a split screen setup and multiple timeframes ranging from 1 min to 30 mins. This gives a clear indication of trends and make it easy to pickup on institutional behaviour. Tip: Double clicking indicator background will maximize RVOL to the split screen window.

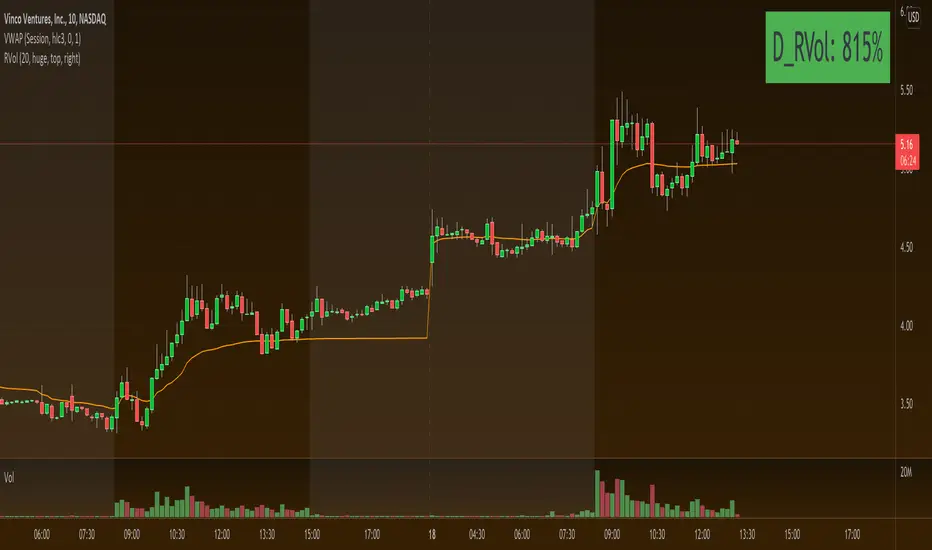
Relative Volume TableRelative Volume Table in percent. So 400% RVol means, today's volume is 4x compared to avg volume for the length you selected.
1. When chart resolution is Daily or Intraday (D, 4H, 1H, 5min, etc), Relative Volume shows value based on DAILY.
2. When resolution is changed to Weekly or Monthly, then Relative Volume shows corresponding value. i.e. Weekly shows weekly relative volume of this week compared to past 'N' weeks. Likewise for Monthly. You would see change in label name. Like, Weekly chart shows W_RVol (Weekly Relative Volume). Likewise, Daily & Intraday shows D_RVol. Monthly shows M_RVol (Monthly Relative Volume).
3. Added a plot (by default hidden) for this specific reason: When you move the cursor to focus specific candle, then Indicator Value displays relative volume of that specific candle. This applies to Intraday as well. So if you're in 1HR chart and move the cursor to a specific candle, Indicator Value shows relative volume for that specific candlestick bar.
Hope you find this useful.

HamStar Tweezer Engulfing DetectorStandard candle pattern identifier like many already available, however this one allows to filter with ATR or RVOL to help remove false signals.
Please comment any suggestions, questions or requests.
*Disclaimer*
some of the pattern logic was located throughout the internet and is not mine. I have simply cobbled it together and added the filters.

Relative VolumeRelative Volume label in percent. So 400% RVol means, today's volume is 4x compared to avg volume for the length you selected.
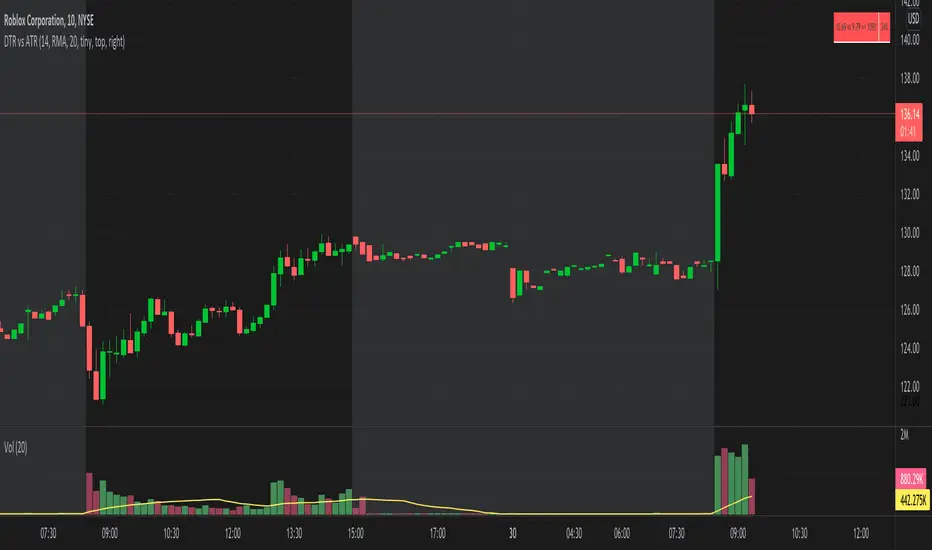
DTR vs ATR w RVolDTR vs ART along with Relative Volume in Percentage. So if you see RVol as 200% with input length of 10 days, today's volume is 2x compared to past 10 days. It helps if today's volume is already reached 20% or 30% within 30mins of market open, etc.
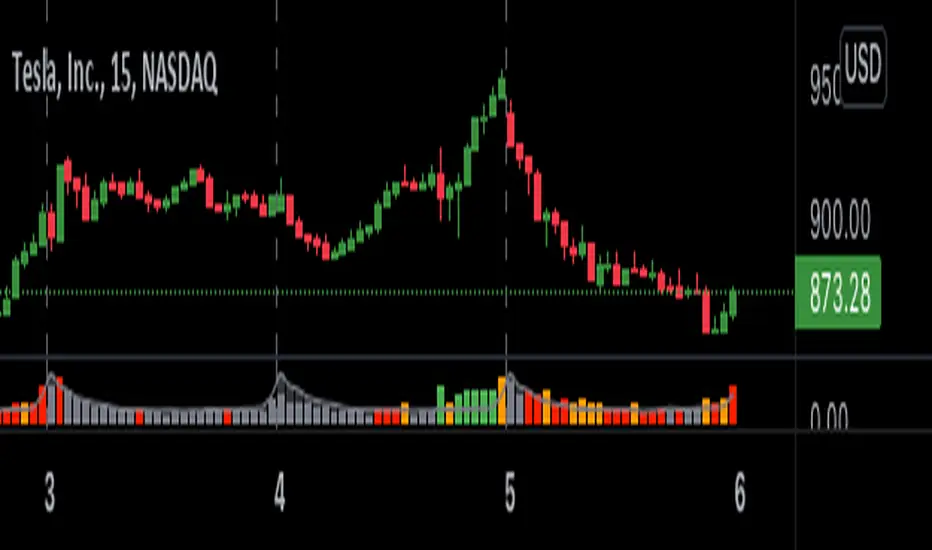
OPINICUS VOLUME DATA - Time Of Day Relative Volume (RVOL)This tool calculates the relative volume (RVOL) based on the normal average volume at that particular time of day.
Relative volume is a powerful piece of information because it offers a gauge as to whether a stock is in play or not. If RVOL is less than 1 it is not in play on this trading day or during this timeframe. If RVOL is above 2, it IS in play and can potentially be traded.
This script allows you to determine if relative volume is average, above average, 2x, or 3x via different color volume bars, at that particular time of day.
There are 2 different settings on this volume indicator.
The first setting is "Gradient." This is the preferred setting, and the one I personally use. Gradient is going to show you different color volume bars based on the RVOL multiple.
The color scheme is as follows:
Gray for average volume
Red if RVOL is between 1.0 and 1.5
Orange if RVOL is between 1.5 and 2
Green if RVOL is between 2.0 and 3.0
Lime green (bright green) if RVOL is greater than 3.
The second setting is "Price." This setting simply shows you the color of the candlestick. This is useful if you find the gradient setting to be too distracting, but still want to see if there is increased relative volume.
There is an alerts setting, which I find to be useful but can also be very distracting. If you leave the "Alert At RVOL %" setting at 0, then alerts will only be triggered if the current candle exceeds the 1.0 (100%) RVOL level. This happens far too frequently, so I prefer to put the alert at 2 or 3. If you change the "Alert At RVOL %" setting then alerts will be triggered if the RVOL percentage (blue number) exceeds your given value. The blue number is a percentage of the average, so if it’s at 1, then it’s 100% of the average.
Note: This tool does not work if you have after-hours or pre-market data displayed. The preferred setting for this tool is the 15' chart, with a 21 day look back period. It is also very useful on the daily chart when doing higher timeframe research.
Cumulative Volume AverageHey traders!
I've received dozens of requests for this style of Cumulative Volume indicator over the past year since I released my RVOL By Time and standard RVOL indicators.
After studying Pine Script deeply and using a bit of old fashioned trial and error over the past few months, I finally got it to work!
This script adds up the cumulative volume throughout any given trading day (the blue & green volume bars) on any given intraday timeframe on any given market - and then it compares that cumulative volume value to the total volume of the previous day AND the average cumulative volume of the previous X days for whatever time of day the current bar is printing on.
By default it compares today's cumulative volume to yesterday's, but you can set the Lookback higher in the settings menu if desired.
It even takes into consideration random gaps in price action (unlike my RVOL By Time indicator) – so as far as I can tell, it’s as accurate as I can possibly make it.
However it does not work on extended hours for stocks so don’t use it if you have pre-market hours enabled. And there is an inbuilt limitation to how many bars a script can reference on TradingView, so on 5-minute timeframes and lower your Lookback period will be limited and may crash the script if you set it too high.
The PURPLE LINE is the total volume of the previous day.
The GRAY COLUMN is the average cumulative volume of the previous X days.
The COLORED COLUMN is the current cumulative volume for the current bar.
The BLACK LINE is the Previous Cumulative Volume Line which represents the average cumulative volume for the past X days. It only draws if today’s CV exceeds the average – this is useful for comparing exactly how far today’s cumulative volume exceeds the average, but it can be turned off in the Style menu if you don't want it there.
The ORANGE NUMBER is the ratio of today's CV compared to the average (CV ÷ Average CV).
If the current cumulative volume is less than the previous day's cumulative volume for that time of day, the bar is blue.
If the current cumulative volume is greater than the previous day's cumulative volume for that time of day, the bar is dark green.
If the current cumulative volume is greater than the previous day's total volume, the bar is bright green.
This script also comes with alert functionality.
You can set a Cumulative Volume Alert which will trigger an alert if the current bar's cumulative volume exceeds the average cumulative volume for that time of day.
You can also set a Total Cumulative Volume Alert which will trigger an alert only if the current bar's cumulative volume exceeds the total volume of the previous day.
And you can set a CV Ratio Alert which will trigger an alert if today's CV ÷ Average CV >= Specified Ratio.
Apart from that, the script is fairly self-explanatory so I hope you enjoy using it!
Check my signature for a link to the source code + all my other indicators.
Good luck with your trading, and feel free to drop any suggestions or bug reports and I'll do my best to help out :)
Kind regards,
Matthew

Relative Strength of Volume Indicators by DGTThe Relative Strength Index (RSI) , developed by J. Welles Wilder, is a momentum oscillator that measures the speed and change of price movements.
• Traditionally the RSI is considered overbought when above 70 and may be primed for a trend reversal or corrective pullback in price, and oversold or undervalued condition when below 30. During strong trends, the RSI may remain in overbought or oversold for extended periods.
• Signals can be generated by looking for divergences and failure swings. If underlying prices make a new high or low that isn't confirmed by the RSI, this divergence can signal a price reversal. If the RSI makes a lower high and then follows with a downside move below a previous low, a Top Swing Failure has occurred. If the RSI makes a higher low and then follows with an upside move above a previous high, a Bottom Swing Failure has occurred
• RSI can also be used to identify the general trend. In an uptrend or bull market, the RSI tends to remain in the 40 to 90 range with the 40-50 zone acting as support. During a downtrend or bear market the RSI tends to stay between the 10 to 60 range with the 50-60 zone acting as resistance
This study aim to implement Relative Strength concept on most common Volume indicators, such as
• Accumulation Distribution is a volume based indicator designed to measure underlying supply and demand
• Elder's Force Index (EFI) measures the power behind a price movement using price and volume
• Money Flow Index (MFI) measures buying and selling pressure through analyzing both price and volume (used as it is)
• On Balance Volume (OBV) , created by Joe Granville, is a momentum indicator that measures positive and negative volume flow
• Price Volume Trend (PVT) is a momentum based indicator used to measure money flow
Plotting will be performed for regular RSI and RSI of Volume indicator (RSI(VOLX)) selected from the dialog box, where the possibility to apply smoothing is provided as option. Additionally, labels can be added optionally to display the value and name of selected volume indicator
Secondly, ability to present Volume Histogram within the same study along with its Moving Average or Volume Oscillator based on selection
Finally, Volume Based Colored Bars , a study of Kıvanç Özbilgiç is added to emphasis volume changes on top of the bars
Nothing excessively new, the study combines RSI with;
- RSI concept applied to some of the common Volume indicators presented with a highlighted over/under valued threshold area, optional labeling and smoothing,
- added Volume data with additional information and
- colored bars based on volume
Thanks @Vishant_Meshram for the inspiration 🙏
Disclaimer:
Trading success is all about following your trading strategy and the indicators should fit within your trading strategy, and not to be traded upon solely
The script is for informational and educational purposes only. Use of the script does not constitute professional and/or financial advice. You alone have the sole responsibility of evaluating the script output and risks associated with the use of the script. In exchange for using the script, you agree not to hold dgtrd TradingView user liable for any possible claim for damages arising from any decision you make based on use of the script

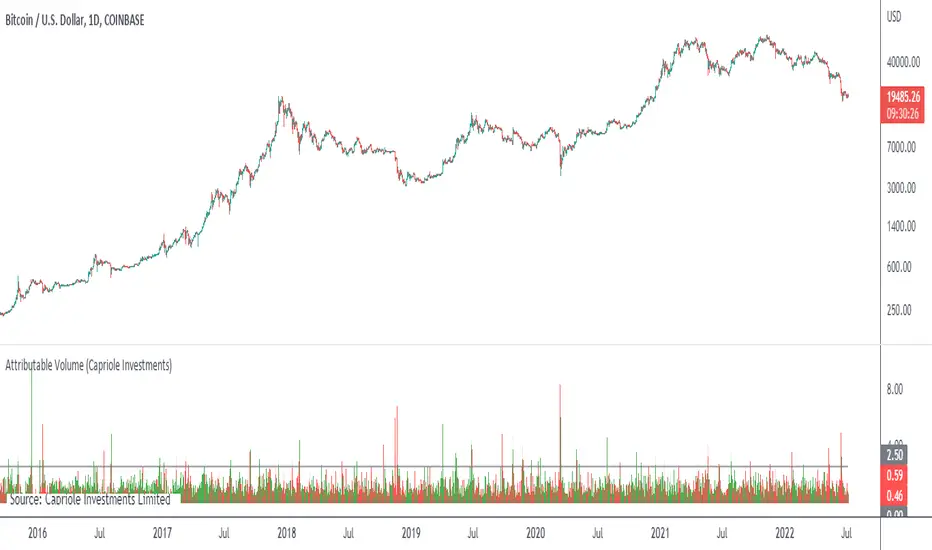
Attributable VolumeA volume indicator which calculates "Attributable Volume”, the portion of volume which contributed to the direction in which the candle moved.
Attributable Volume is calculated as: Total volume excluding the "counter wick" volume.
Where for a green (up) candle, the "counter wick" volume is the top wick volume.
In theory, Attributable Volume should better represent the effort of directional thrust of each candle.
By default, this indicator displays “Attributable RVOL”, but can be set to:
Attributable RVOL
RVOL
Attributable Volume
Volume
Note: RVOL = Relative Volume, the current volume divided by the Volume moving average. RVOL can be used to identify major moves, and potential starts/ends to trends.
Multi-Exchange Volume (30 Tickers) by kurtsmock + BV + rVolauthor: kurtsmock
Fully Customizable ticker set. Up to 30 Tickers. Bitcoin set as default.
-- IMPORTANT NOTE: --
30 Exchanges are a lot. It can take a while to load. You can fully customize this indicator to your liking. Here's how:
1. Load indicator
2. Open Settings
3. Uncheck the switch box for exchanges you want unincluded
4. At the bottom of the settings menu click "Defaults" and hit "Save as Default"
5. To turn them all back on, hit "Reset Settings" in that same "Defaults" menu and click "Save as Default" again.
Also, you don't have to use this with Bitcoin. This works with any asset, just change the ticker in the settings.
There's a lot going on with this indicator so the following is descriptions and instructions to help you better understand what's going on here. Thanks!
Goal:
- To provide a mechanism for assets on multiple exchanges to have their volume evaluated together
Edge:
- Having better and more complete volume information
Notes:
- The Default Exchanges for this indicator are highest volume bitcoin exchanges, but may contain "fake volume"
- Indicator is set for Bitcoin by default. However, you can change the tickers to reflect any asset you want
////// rVol //////
Goal:
- To understand how much volume is being executed relative to the same candle on previous days/periods
Edge:
- Higher rVol implies higher volatility and market interest.
- High rVol = higher than average volume . Markets move on volume so higher than average volume indicates increased market activity/volatility
- rVol is an indirect measure of active or anticipated volatility
Definitions:
- rVol: The volume of a period compared to the Average Volume of that same period in past sessions
- Important to note it does NOT add up the last 10 (default) candles, but rather the last 10 candles at session intervals.
- Example:
-- On a Tuesday, 1h chart it will add up the last ten Tuesday, 9:00 am candles, not including the current, active candle.
-- It then averages those lookback candles.
-- It then plots the percentage relationship between the most recent candle and the average of the lookback candles
-- Avg Vol of Lookback candles = 5000,
-- Volume of most recent candle = 4000: Output = rVol = 80:
-- Volume of most recent candle was 80% of the average volume in the 9 am time period of the last ten Tuesdays in the 9 am, 1h period
Notes:
- rVol does not add current candle volume into lookback sum. So, you set lookback to be: (not including the current day)
- rVol is on a switch. So, if you want to see rVol instead of volume, hit the switch in the settings
- If you want to see both, load 2 instances of the indicator.
////// Better-er Volume //////
Goal:
To Identify:
- When a candle closes at the highest volume * range relative to the lookback period and close > open
- When a candle closes at the highest volume * range relative to the lookback period and close < open
- When a candle closes at the highest volume / price relative to the lookback period
Edge:
- Identifies beginnings of price expansion, climax of price expansion, breakouts, pivots, and take profit points on the volume chart
Notes:
- Based generally on Barry Taylor's "Better Volume" indicator and ideas from Pascal Willain's book "Value in Time."
- Better-er Volume rules are applied to both Total Volume or rVol.
-- When rVol is displayed Better-er Volume is applied to rVol
-- When Total Volume is displayed Better-er Volume is applied to Total Volume
// Plot Key: //
Green Triangle Up = Often marks the beginning and/or end of price expansion to the upside
Red Triangle Up = Often marks the beginning and/or end of price expansion to the downside
Yellow Square = High Volume but Tight Range. Implies a Battle of Bulls and Bears. High Liquidity area. Provided Liquidity is not enough to move price. Thick Limit Order Book.
Purple Triangle Up or Down = Implies high market participation. Typically at the end of expansion when very significant s/r is hit
category: volume Volatility
tags: Volume rVol relativevolume Bitcoin cryptocurrency bettervolume
Many More Volume Indicators Coming Out Soon!

Relative Volume RVOL AlertsRelative Volume or RVOL is an indicator used to help determine the amount of volume change over a given period of time.
It is often used to help traders determine how in-play a ticker is.
General rule of thumb is the higher the RVOL, the more in play a stock is.
I myself like to use it as a substitute of the volume indicator itself.
Basic Calculation:
Relative Volume = Current Volume / Average Volume
Crossover Signals:
Any time there is a volume spike which causes a crossover of the user set 'Smoothed Moving Average' or 'Threshold' a green/red dot will appear at the top. The color of the dot is dependent on closing of the candle. Therefore it does not necessarily mean price will continue in that direction since volume spikes often happen in peaks or valleys.
Threshold:
The level at which custom alerts and signal can be set. The higher the value, the more volume required to trigger.
Built in Alerts:
You can set custom alerts for the crossovers of the adjustable threshold, or the average RVOL band.

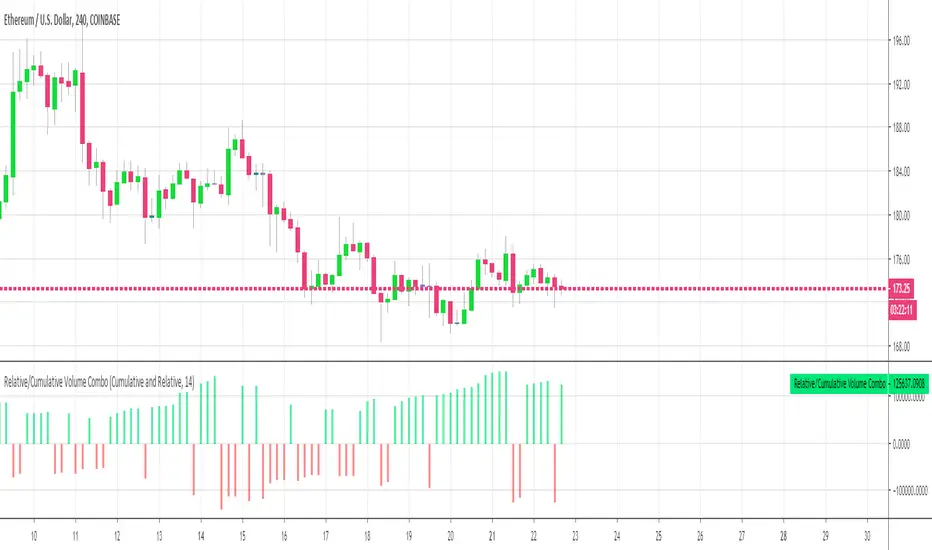
Relative Volume Combined With a Cumulative FunctionHi everyone
The today's script was suggested by a follower.
--------------------------------------
1 minute of Knowledge
--------------------------------------
Many traders look at volume as a pre-signal that a move may happen.
In trading, some say that "the volume precedes the movement".
This simply means that often volume will increase before a significant move in the stock.
Imagine if a unique trader is buying a crypto/stock. The volume is unlikely to move.
But, if all the mass goes to mass spot buy an asset, then we could see a volume spike announcing a potential upwards move.
---------------------------------------------
What's the story with that indicator?
---------------------------------------------
It's an interesting way of presenting the volume data.
Will show the total volume for the selected period.
You can choose between relative and cumulative presentation.
The users can display the consecutive rising volume above the 0 line and the failing volume below that line.
--------------------------------------
Mix knowledge with usefulness
--------------------------------------
A price making a higher/high (HH) or lower/low (LL) has a real and strong meaning- a HH or LL on a volume has a significant meaning also.
Increasing volume for a stock/crypto, could signify that buyers were willing to purchase a bigger number of shares at a higher price (comparatively to the day before)
Obviously, non-stop crazy buying/shorting won't work at some point - and that "some point" may hurt a bit.
Such volume indicator combined with others like momentum or strength indicators is a nice trading strategy.
The volume announces that a move may happen and the other indicators will confirm the prophecy :)
Peace
Dave
Relative Volume (RVOL) - ATR - R4RocketHello !!
This is a big upgrade on my earlier Indicator called "RVOL - R4Rocket". I could have updated the existing script, but there were two reasons for me to not do so.
1. I changed a lot of the previous code and added a lot of statistics like
a. Intraday Daily ATR Plot
b. Progressive (High - Low) Range as % of Daily ATR
c. % of RVOL Days in available chart data in any timeframe
d. In the new script RVOL Sectional has been removed as I did't find it very useful (Old script still has that feature)
e. And lastly and greatly, I modified the actual RVOL code (Huh ? Well I'll explain what I mean by this below)
2. Earlier I named my script just as RVOL. But then I though, well not everyone is going to search "Relative Volume" Indicator as "RVOL" Indicator, right? And Then during my second update I even tried to see whether I can change the script name but I couldn't figure it out. (Maybe it's not possible or maybe you know, "I DON'T HAVE ENOUGH BRAIN POWER" :P). So in order to make my script more accessible and easy to find for everubody so that it may add a little value to them in their trading, I'm changing the name of the script in this publication to "Relative Volume (RVOL) - ATR - R4Rocket". (Quite a big name, don't you think?)
Now as my reasons are out of the way, let me tell you about the indicator and the available options.
First let me explain what is RVOL basically. (Even after making 4 updates to my last script, I forgot to explain this......BIG BRAIN POWER :P)
It is calculated as (Cumulative sum of volume till time t from the start of the session) divided by the (Average of same period volume over a given number of days).
Lets say market starts at 09:30 am and right now the time is 10:00 am. So what RVOL does is it takes the sum of volume done from 9:30 am to 10:00 am for today and divides it by the same average volume that occurred between 9:30 to 10:00 in lets say X number of last days.
What this does is gives you the means to quantify how much everybody is interested today in the given stock w.r.t last X days. Generally higher the RVOL value - higher the public interest (due to some known or unknown reason like results / news / market condition etc) - and hence higher is the probability of stock movement on intraday basis. (Mostly everybody prefers to trade stocks intraday with RVOL > 2)
Now let's get back to the changes and the features.
1. It calculates Relative Volume
Adjusted in a way that the recent volume spike (e.g say due to quarterly result announcement or some other big news) don't skew the next day's
RVOL calculation. What this will do is, it will give you a good idea whether the stock is still in play the next day or a day after that.
LIGHTS !! CAMERA !! ANNNNNNDD ACTION !! (I love to watch movies, not very relevant here I know, but couldn't help it :P)
Now you can see in the image below the difference between old and new script RVOL calculations. This will help you to find out 2nd Day, 3rd Day plays.
To calculate RVOL first you have to choose your local exchange trading hours
E.g. NSE (India) trades from 09:15 to 15:30
NASDAQ (USA) trades from 09:30 to 16:00
LSE (UK) trades from 08:00 to 16:30 etc
Then you have to choose the RVOL period. This is the lookback period for cumulative volume average calculations.(I suggest using default value of 4 but it depends upon your preference and one more thing to note is that too high of a value will not even load the script due to some constraints that I don't know)
And last parameter is RVOL Trigger = What RVOL value YOU CONSIDER IMPORTANT. (I like 2 and if RVOL > RVOL Trigger then the columns will turn Green otherwise they will be Red. SIMPLE !!)
You can use any timeframe from 1 min to 1 Day. (Even custom timeframes like 2,4,6 will work fine)
1 min Chart
2 min Chart
2. It calculates Daily ATR in % terms of the day's open and plots it on intraday charts (and on daily charts too, if you want)
It's just what I just said - plain & simple.
You can see it in the image below. (Yellow dotted line and value in yellow color)
This will help you if you use profit targets or stop losses based on previous day's ATR values.
All you have to do is tick the Plot Daily ATR % box in inputs and choose the ATR Average.
3. The indicator calculates (High - Low) range as and when it extends throughout the day as the % of Daily ATR
This will help you quickly in finding which stocks are trading with extreme volatility.
Can be seen in the image below where the stocks trade @ almost 3 times or 300 % of the previous days ATR (Blue dotted line and value in blue color)
4. And lastly it gives you the statistic that will tell you how much is the average % of total days are RVOL days. (Did you get that ? It sounded great in my head but really don't know what I just said)
Let me tell you in terms of numbers. Lets say on daily timeframe Tradingview provides some 5000 bars worth of historical data. Out of that there were 16% days where RVOL was more than 2. Roughly speaking if you were to trade this stock every day then you would find on an average about 3 days per month with RVOL > 2.
(If you reduce the RVOL Trigger, then you will get more % RVOL days. In the second image if you reduce RVOL Trigger to 1.5 then you will have almost 27 % good trading days AS PER YOUR DESIRED & DEFINED PARAMETER OF RVOL TRIGGER = 1.5. Which translates to almost 6 days per month. You can play with it as you want and deem fit.)
RVOL Trigger = 2
RVOL Trigger = 1.5
“The goal of a successful trader is to make the best trades. Money is secondary.” – Alexander Elder
With best regards.
R4Rocket

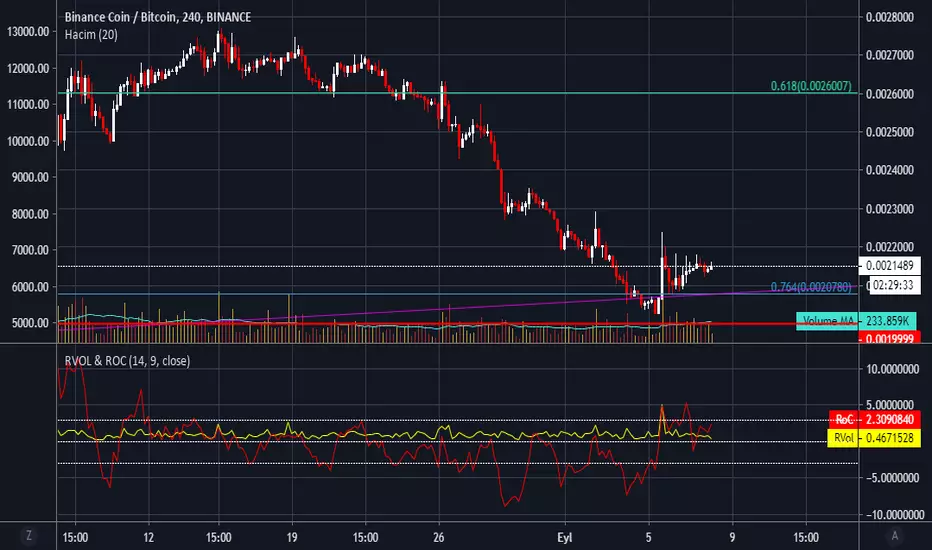
RVol & RoC - Relative Volume & Rate of Change by haciyatmazRelative Volume ( RVol ) is a critical measure of volume flows. It measures current volume in relation to the "usual" volume for this time of the day.
Rate of Change ( RoC ) is a momentum-based technical indicator that measures the percentage change in price between the current price and the price a certain number of periods ago.
ATR (Average True Range) By TimeWhat is ATR By Time?
This premium indicator was inspired by my RVOL By Time indicator . It works on Stocks, Forex, Crypto and most Futures markets. Instead of calculating the ATR by recent price data, it calculates an ATR value for each candle based on that candle’s time of day.
For example, if you set the Lookback setting on this indicator to 14, then instead of calculating the ATR based on the past 14 candles, it will calculate an ATR value based on the past 14 trading sessions for each candle.
This is extremely useful for day traders in particular as it allows you to gauge the average range of candles during certain times of day instead of only by the most recent price action.
It also draws a regular ATR (optional) – so this is essentially an enhanced ATR script that gives you multiple readings on price volatility.
If you are interested, you can purchase access to the script or register for a free trial on my website: ATR By Time Feature Page .
Why Does It Cost Money?
The reason why this is a premium script that requires payment to access is because it took a lot of time, research and development in order to create. The other advantage of charging for it is that it retains exclusivity to only a select few dedicated traders.
By paying the yearly fee you get access to ALL of my premium indicators including lifetime updates and technical support.
If you don’t want to pay for this script then I completely understand and I have plenty of other free indicators and scripts that you might be interested in!
Free Trial
I am a trader myself and so I know how skeptical you might be that this indicator is worth your time and money. That is why I am offering a free trial of this indicator.
All you need to do to initiate your trial is Join My Mailing List/ on my website: zenandtheartoftrading.com
How It Works
This script uses a complex formula to calculate ATR values across distant historical bars.
Depending on the timeframe you select it will skip through historical bars to find previous bars from the same time of day. It collects these values then applies the traditional ATR formula to them.
The ATR value is determined by the maximum result of the following three calculations:
- Current high minus the current low
- The absolute value of the current high minus the previous close
- The absolute value of the current low minus the previous close
- Whichever of these three calculations comes out highest, that is your ATR for the given candle.
Once this value is calculated for historical bars the ATR indicator’s reading is typically determined by a 14-period moving average of these individual ATR values. So the ATR reading you see on your screen is an average of the past 14 ATR values.
This means that as markets expand and contract this volatility reading will adapt to the change in candle price ranges.
The difference with the ATR By Time indicator’s calculation formula is that rather than referencing recent bars it references bars based on their time of day.
For example, if you are on the 1-Hour chart and you check the ATR By Time value at 9:00AM with a Lookback period of 14, then the value you see will be the result of the ATR calculation of every 9:00AM 1-Hour candle over the past 14 trading sessions.
You can also choose to enable the ATR moving average in the settings menu if you wish. This will give you a smoothed ATR reading by averaging the current session’s ATR value with previous sessions.
This versatility gives you a sophisticated reading on price volatility which is particularly helpful for day trade setups based around market opens or market closes when volatility tends to spike.
The regular ATR indicator will not account for this on the lower timeframes, but this indicator will!
Examples
Stocks - Heatmap Scheme with regular ATR
Stocks - Price Scheme - No ATR
Stocks - Traffic Scheme - Session Average Line RMA
Stocks - Trigger Scheme - 10 sessions
Forex - RMA
Forex - No RMA
Forex - Normal ATR Stop
Forex - Session ATR Stop
RVOL - Final on 814 for 3m Candles ONLYRelative Volume for 3 minute charts ONLY.
Lookback 20 days.
Historical and average values are used to formulate the ratio.
Thank you to R4Rocket for the initial code.
I also researched the RVOL output in Trade Ideas to align the final ratio as close as possible.
The colors change at different levels:
<0.5 ; Red
0.5 > and <=.65 ; Orange
0.65 > and <=1 ; Dark Yellow
1 > and <=1.25 ; Bright Yellow
1.25 < and <=1.5 ; Dark Green
1.5 < and <=2 ; Brighter Green
Above 2 ; Very Bright Green

RVOL - R4RocketRelative volume or RVOL for short is an indicator that is used to measure how 'In Play' the stock is. Simply put, it helps to quantify how interested everybody is in the given stock - higher the value, higher the interest and hence higher is the probability for movement in the stock.
I have tried to create RVOL (Relative Volume ) Indicator as per the description that I read on SMB Capital blog. The blog is a great resource.
...................................................................................................................................................................................
How to use the indicator - The indicator is meant for INTRADAY ONLY.
The indicator has following inputs -
1. RVOL Period - Value from 3 to 14 (Default Value = 4)
This is used to calculate the average volume over the given period of days. e.g. average volume for the last 5 days, last 3 days, last 10 days etc. NOTE - If you use higher RVOL Period on smaller timeframes, the code will give an error. So I recommend using 4 or lower for 5 min timeframe. (Nothing will work on 1 min chart and you can experiment for other timeframes.)
2. RVOL Sectional - True / False (Default Value = False)
If you check this box then you will be able to calculate the RVOL for a particular session (or between particular sessions) in that trading day.
What do I mean by session?
Well I have divided the trading day into 6 (almost) equally spaced sessions in time, i.e. 6 hours and 15 mins (for NSE - India) of trading day is divided into 1 hr - 1st session, 1 hr - 2nd session, 1 hr - 3rd session, 1 hr - 4th session, 1 hr - 5th session, 1 hr and 15 min - 6th session.
Before using 3rd and 4th inputs of indicator, RVOL Sectional box MUST BE CHECKED FIRST.
3. RVOL From Session - 1 to 6 (Default Value = 1)
4. RVOL To Session - 1 to 6 (Default Value = 2)
Now if you select 2 in "RVOL From Session" input and 3 in "RVOL To Session" input, the indicator will calculate RVOL for the 2nd and 3rd hour of the trading day. If you select 3 in both the inputs, then the indicator will give RVOL for the 3rd hour of the trading day.
5. RVOL Trigger - 0.2 to 10 (Default Value = 2)
Filter to find days having RVOL above that value. The indicator turns green (or colour of your choice) when RVOL is more than "RVOL Trigger".
...................................................................................................................................................................................
Hope this indicator will add some value in your trading endeavor.
“Only The Game, Can Teach You The Game” – Jesse Livermore
Yours sincerely,
R4Rocket
**If you have some awesome idea for improvement of the indicator - request you to update the code and share the same.

Volume+ (RVOL By Time of Day)This script is an enhanced volume indicator.
It calculates relative volume (RVOL) based on the average volume at that time of day (rather than using a moving average).
For example, using this indicator you can see today’s volume during the first 5-minute candle of the market open compared to the previous day’s volume at the market open. Or you can see today’s volume at the market close during the last 15-minute candle compared to the average of the past 20 days of volume at the market close.
Due to the different quantity of candlesticks in a session between Stocks and Forex/Crypto, I separated those markets into separate settings, making this an all-in-one volume indicator that works on all markets.
Settings:
Stocks
If you set the lookback period to 1 on the 5-minute chart and look at the 9:30am candle for a stock, then the current volume bar will show you what today’s volume is compared to yesterday’s 9:30am 5-minute candle.
If you set the lookback period to 15, then the current volume bar will show you what today’s volume is compared to the average of the last 15 days of 9:30am 5-minute candles.
Max Lookback: 64 Sessions
Stocks
This setting is for traders who want to use this indicator on a timeframe lower than the 5-minute chart.
Due to limitations in how many historical bars PineScript can reference, referencing 1-minute and 3-minute bars requires a lot more historical data so I separated the two to allow the 5-minute+ timeframes to have a longer lookback period.
Max Lookback: 12 Sessions
Forex/Crypto
When you set the script to Forex/Crypto, it does the same thing for stocks but calculates based on a 24-hour period.
So if you set the lookback period to 1 on the 1-hour chart and look at the 11:00am candle for a currency pair, then the current volume bar will show you what today’s volume is compared to yesterday’s 11:00am 1-hour candle.
If you set the lookback period to 10, then the current volume bar will show you what today’s volume is compared to the average of the last 10 days of 11:00am 1-hour candles.
Max Lookback: 17 Sessions
What Doesn’t It Work On?
Because I had to manually calculate how many volume candles to look back per timeframe to get the previous session’s candle, I had to hard-code the math in this script.
That means that this indicator will only work on 1m, 3m, 5m, 15m, 30m, 45m, 1h, 2h, 3h, 4h, Daily and Weekly timeframes. If you try to use it on any other timeframe it will revert to a regular volume indicator.
Why Is It Useful?
Similar to volume profile by price, this gives you a volume profile by time in a way that the default volume indicator does not.
For example, you can use this to determine when a stock has a particularly strong opening drive, or when a currency pair has a weak fake-out leading up to the London open, or for general confirmation on trading signals with time-specific volume information to work with.
Colors
The purple line and the faint gray bar is the RVOL value.
The blue number is the percentage of the current volume bar relative to RVOL.
There are four different bar color settings:
Heatmap – Changes color to be brighter based on higher RVOL
Price – Changes color based on price action (like the default TradingView volume indicator)
Traffic – Changes color based on RVOL percentages (for fast visual cues)
Trigger – Changes color only when the specified alert conditions are met
Heatmap:
Traffic:
Trigger:
Price:
Heatmap:
Turns very bright green at 2.0 RVOL
Turns light green at 1.0 RVOL
Turns normal green at 0.75 RVOL
Turns medium green at 0.5 RVOL
Turns very dark green at 0.25 RVOL
Is gray otherwise.
Price:
Turns red if the price action candle closed bearish.
Turns green if the price action candle closed bullish.
Traffic:
Turns red if RVOL is between 1.0 and 1.5.
Turns orange if RVOL is between 1.5 and 2.0.
Turns dark green if RVOL is between 2.0 and 3.0.
Turns bright green if RVOL is above 3.0.
Is gray otherwise.
Trigger:
Turns teal if any of the given alert conditions in the user settings are met.
Alerts
Alerts are optional. You have to set them like any other indicator, by creating a new alert and selecting this indicator.
If you leave the "Alert At RVOL %" setting at 0, then alerts will only be triggered if the current candle exceeds the 1.0 (100%) RVOL level.
If you change the "Alert At RVOL %" setting then alerts will be triggered if the RVOL percentage (blue number) exceeds your given value. The blue number is a percentage of the average, so if it’s at 0.5, then it’s 50% of the average.
Notes
- This indicator only works with regular time bars. It will not work with range, tick, renko etc.
- This script has lookback limitations due to restrictions on how many historical bars PineScript can reference. The lookback limit varies based on the market type you choose. The more bars required for calculation the lower the lookback limit.
- If you use it on the Daily timeframe the lookback period will count as 1 week. If you use it on the Weekly timeframe the lookback period will count as 1 month. So a Lookback of 3 on the Daily would be 3 weeks of averages, a Lookback of 5 on the Weekly would be 5 months of averages (for that Day of Week or Week number).
- Big thanks to @tb12345 for the idea and for helping to field-testing the indicator!

Volume+ (RVOL/Alerts)This indicator colors the volume bars based on any of the three follow criteria:
- Volume Amount
- RVOL (Relative Volume)
- Lookback (Highest Over Period)
You can use one, two or all three of these settings at the same time.
You can also set alerts with this indicator. The script will trigger an alert whenever any of the three specified flags are triggered.
RVOL is calculated as: Volume divided by Moving Average value. You can change the moving average period (and type) in the settings.
Relative Volume (RVOL) - Beasley SavageRelative Volume, often times called RVOL, is an indicator that tells traders how current volume is compared to past trading volumes over a given period. It is kind of a like a radar for how “in-play” a stock is. The higher the relative volume is the more in play it is.
Relative Volume is displayed as a ratio. So if it is showing 3.5 relative volume, that means it is trading at 3.5 times its normal volume.
