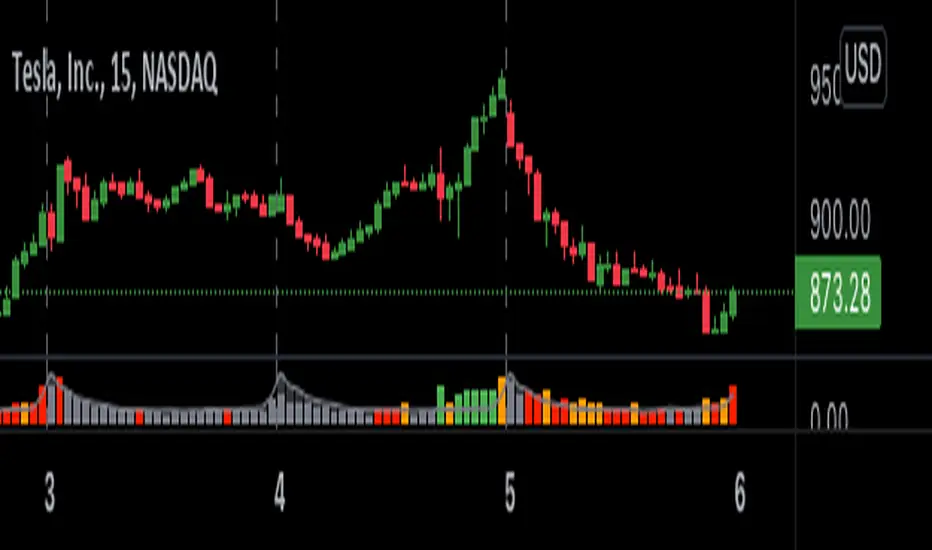
OPINICUS VOLUME DATA - Time Of Day Relative Volume (RVOL)This tool calculates the relative volume (RVOL) based on the normal average volume at that particular time of day.
Relative volume is a powerful piece of information because it offers a gauge as to whether a stock is in play or not. If RVOL is less than 1 it is not in play on this trading day or during this timeframe. If RVOL is above 2, it IS in play and can potentially be traded.
This script allows you to determine if relative volume is average, above average, 2x, or 3x via different color volume bars, at that particular time of day.
There are 2 different settings on this volume indicator.
The first setting is "Gradient." This is the preferred setting, and the one I personally use. Gradient is going to show you different color volume bars based on the RVOL multiple.
The color scheme is as follows:
Gray for average volume
Red if RVOL is between 1.0 and 1.5
Orange if RVOL is between 1.5 and 2
Green if RVOL is between 2.0 and 3.0
Lime green (bright green) if RVOL is greater than 3.
The second setting is "Price." This setting simply shows you the color of the candlestick. This is useful if you find the gradient setting to be too distracting, but still want to see if there is increased relative volume.
There is an alerts setting, which I find to be useful but can also be very distracting. If you leave the "Alert At RVOL %" setting at 0, then alerts will only be triggered if the current candle exceeds the 1.0 (100%) RVOL level. This happens far too frequently, so I prefer to put the alert at 2 or 3. If you change the "Alert At RVOL %" setting then alerts will be triggered if the RVOL percentage (blue number) exceeds your given value. The blue number is a percentage of the average, so if it’s at 1, then it’s 100% of the average.
Note: This tool does not work if you have after-hours or pre-market data displayed. The preferred setting for this tool is the 15' chart, with a 21 day look back period. It is also very useful on the daily chart when doing higher timeframe research.
Relativevolume
Freedom of MovementFreedom of Movement Indicator
---------------------------------------------------------
In “Evidence-Based Support & Resistance” article, author Melvin Dickover introduces two new indicators to help traders note support and resistance areas by identifying supply and demand pools. Here you can find the support-resistance technical indicator called "Freedom of Movement".
The indicator takes into account price-volume behavior in order to detect points where movement of price is suddenly restricted, the possible supply and demand pools. These points are also marked by Defended Price Lines (DPLs).
DPLs are horizontal lines that run across the chart at levels defined by following conditions:
* Overlapping bars: If the indicator spike (i.e., indicator is above 2.0 or a custom value) corresponds to a price bar overlapping the previous one, the previous close can be used as the DPL value.
* Very large bars: If the indicator spike corresponds to a price bar of a large size, use its close price as the DPL value.
* Gapping bars: If the indicator spike corresponds to a price bar gapping from the previous bar, the DPL value will depend on the gap size. Small gaps can be ignored: the author suggests using the previous close as the DPL value. When the gap is big, the close of the latter bar is used instead.
* Clustering spikes: If the indicator spikes come in clusters, use the extreme close or open price of the bar corresponding to the last or next to last spike in cluster.
DPLs can be used as support and resistance levels. In order confirm and refine them, FoM (Freedom of Movement) is used along with the Relative Volume Indicator (RVI), which you can find here:
Clustering spikes provide the strongest DPLs while isolated spikes can be used to confirm and refine those provided by the RVI. Coincidence of spikes of the two indicator can be considered a sign of greater strength of the DPL.
More info:
S&C magazine, April 2014.

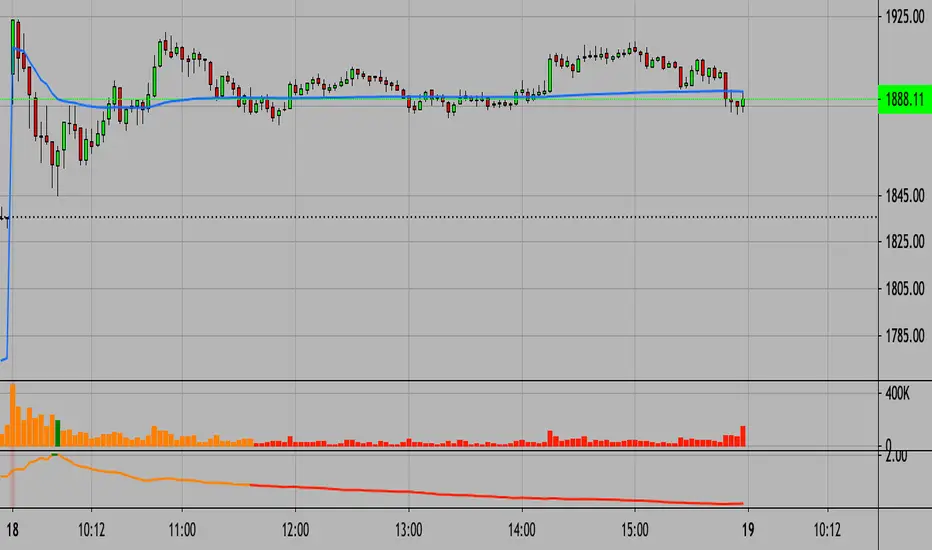
Real Relative Volume - Bar Indicator - Time Adjusted - DE & ENEnglish version below
Die richtige Aktie zu finden, ist nich immer einfach. Eine wichtige Variable bei der Aktienauswahl stellt das relative Volumen dar, welches von vielen erfolgreichen Tradern und Trading Firmen benutzt wird. Stell es Dir so vor: Statt sich das absolute Volumen anzuschauen, schauen wir uns die tatsächliche Stärke an. Wie viel Volumen wird also heute im Vergleich zu einem regulären Tag gehandelt. Dies gibt Aufschluss darüber, ob die Aktie "In-Play" ist.
Merke: Ist das RVOL (Relative Volumen) erhöht, sind mehr Marktteilnehmer an dieser Aktie interessiert als üblich. Dies ist besonders dann wichtig, wenn die Marktrichtung und die Richtung der Aktie nicht übereinstimmen.
Wenn der Markt steigt, steigen auch die meisten Aktien. Dies kann folglich auch ohne erhöhtes RVOL passieren. Was ist aber, wenn der Markt gegen uns geht? Dann werden wir schnell bei RVOL-schwachen Aktien ausgeschüttelt. Daher wollen wir unseren Fokus immer auf Aktien setzen, die ein erhöhtes relatives Volumen haben! Dies sind die Aktien, die gerade wirklich stark gehandelt werden und wahrscheinlich einen Katalysten dafür haben.
Der Real Relative Volume - Bar Indicator zeigt Dir das aktuelle relative Volumen an. Unser Algo benutzt dabei das tatsächliche kumulative Volumen des aktuellen Tages zum jeweiligen (aktuellen) Zeitpunkt und vergleicht dieses mit dem historischen Durchschnittsvolumen zum gleichen Zeitpunkt. Damit bekommen wir ein korrektes Abbild der aktuellen Stärke. Mit Hilfe des Indikators können wir durch die farbliche Veränderung der Volumenbalken ebenfalls sehen, ob diese Stärke zunimmt, gleich bleibt, oder gegebenenfalls schnell and Power verliert. Im Gegensatz zu anderen Skripten nutzen wir eine fortschrittliche Methode, die aktuelle Position am Tag erkennt und damit nicht die Session in gleiche Teile teilt. Vorteil: Der Indikator funktioniert auch in Krypto, Forex, DE-Aktien, Indizes etc.
Funktionen:
Bitte ohne verlängerte Handelszeiten nutzen!
Sessions Back: Verändert die Baseline, die Du mit dem heutigen Volumen vergleichst. Beispiel: 10 - Zur aktuellen Uhrzeit siehst Du das reale relative Volumen von heute in Relation zu den letzten 10 Sessions (zur gleichen Zeit). (*max 5000 Kerzen)
RVOL Threshold: Wert für die RVOL Alarme sowie zur Färbung bei Nutzung des Modus Threshold.
Plot styles: Du hast die Möglichkeit aus 4 verschiedenen Styles zu wählen.
Heatmap (greift auf die Werte und Farben von HM1-HM5 zurück)
Traffic (greift auf die Werte und Farben von T1-T4 zurück) -
Threshold (greift auf den Werte RVOL Threshold zurück)
Kurs (zeigt die normalen Volumenbalken)
HM1-5: Stelle unterschiedliche RVOL Werte für den Plot Style Heatmap ein.
T1-4: Stelle unterschiedliche RVOL Werte für den Plot Style Traffic ein.
Dieser Indikator wird häufig mit unserer zweiten Version Real Relative Volume - Line Indicator - Time Adjusted - DE & EN verwendet. Stelle sicher, dass Du in beiden Indikatoren die gleichen RVOL Werte nutzt!
-------------
English version
Finding the right stock to trade is not always easy. An important variable in stock selection is the relative volume, which is used by many successful traders and trading firms. Think of it like this: Instead of looking at absolute volume, we look at actual strength. So how much volume is traded today compared to a regular day? This gives an indication of whether the stock is "in play".
Note: If the RVOL (relative volume) is increased, more market participants are interested in this share than usual. This is especially important if the market direction and the direction of the stock do not match.
If the market rises, most shares will also rise. This can, therefore, happen without an increased RVOL. But what happens if the market goes against us? Then we are quickly shaken out of RVOL-weak stocks. Therefore, we always want to focus on stocks that have an increased relative volume! These are the stocks that are trading really strongly right now and probably have a catalyst for that.
The Real Relative Volume - Bar Indicator shows you the current relative volume. Our Algo uses the actual cumulative volume of the current day at the respective (current) time and compares it with the historical average volume at the same time. This gives us a correct picture of the current strength. With the help of the indicator, we can also see by the color change of the volume bars whether this strength increases, remains the same, or loses power quickly. Unlike other scripts, we use an advanced method that recognizes the current position on the day and does not split the session into equal parts. Advantage: The indicator also works in crypto, forex, foreign stock markets, indices, etc.
Features:
Please use without extended trading hours!
Sessions Back: Changes the baseline that you compare to today's volume. Example: 10 - At the current time you see the real relative volume of today in relation to the last 10 sessions (at the same time). (*max 5000 candles)
RVOL Threshold: Value for the RVOL alarms as well as for coloring when using the Threshold mode.
Plot styles: You have the possibility to choose from 4 different styles.
Heatmap (uses the values and colors of HM1-HM5)
Traffic (uses the values and colors of T1-T4) -
Threshold (accesses the values RVOL Threshold)
Price (shows the normal volume bars)
HM1-5: Set different RVOL values for the Plot Style Heatmap
T1-4: Set different RVOL values for the Plot Style Traffic.
This indicator is often used with our second version Real Relative Volume - Line Indicator - Time Adjusted - DE & EN. Make sure that you use the same RVOL values in both indicators!

Real Relative Volume - Line Indicator - Time Adjusted - DE & EN// English description below
Die richtige Aktie zu finden, ist nich immer einfach. Eine wichtige Variable bei der Aktienauswahl stellt das relative Volumen dar, welches von vielen erfolgreichen Tradern und Trading Firmen benutzt wird. Stell es Dir so vor: Statt sich das absolute Volumen anzuschauen, schauen wir uns die tatsächliche Stärke an. Wie viel Volumen wird also heute im Vergleich zu einem regulären Tag gehandelt. Dies gibt Aufschluss darüber, ob die Aktie "In-Play" ist.
Merke: Ist das RVOL (Relative Volumen) erhöht, sind mehr Marktteilnehmer an dieser Aktie interessiert als üblich. Dies ist besonders dann wichtig, wenn die Marktrichtung und die Richtung der Aktie nicht übereinstimmen.
Wenn der Markt steigt, steigen auch die meisten Aktien. Dies kann folglich auch ohne erhöhtes RVOL passieren. Was ist aber, wenn der Markt gegen uns geht? Dann werden wir schnell bei RVOL-schwachen Aktien ausgeschüttelt. Daher wollen wir unseren Fokus immer auf Aktien setzen, die ein erhöhtes relatives Volumen haben! Dies sind die Aktien, die gerade wirklich stark gehandelt werden und wahrscheinlich einen Katalysten dafür haben.
Der Real Relative Volume - Line Indicator zeigt Dir das aktuelle relative Volumen an. Unser Algo benutzt dabei das tatsächliche kumulative Volumen des aktuellen Tages zum jeweiligen (aktuellen) Zeitpunkt und vergleicht dieses mit dem historischen Durchschnittsvolumen zum gleichen Zeitpunkt . Damit bekommen wir ein korrektes Abbild der aktuellen Stärke. Mit Hilfe des Indikators können wir ebenfalls sehen, ob diese Stärke zunimmt, gleich bleibt, oder gegebenenfalls schnell and Power verliert. Im Gegensatz zu anderen Skripten nutzen wir eine fortschrittliche Methode, die aktuelle Position am Tag erkennt und damit nicht die Session in gleiche Teile teilt. Vorteil: Der Indikator funktioniert auch in Krypto, Forex, DE-Aktien, Indizes etc.
Funktionen:
Bitte ohne verlängerte Handelszeiten nutzen!
Sessions Back: Verändert die Baseline, die Du mit dem heutigen Volumen vergleichst. Beispiel: 10 - Zur aktuellen Uhrzeit siehst Du das reale relative Volumen von heute in Relation zu den letzten 10 Sessions (zur gleichen Zeit). (*max 5000 Kerzen)
Threshold: Stelle eine bestimmte Schwelle ein, bei der Du dich über die TradingView Funktion alarmieren lassen möchtest.
T1-4: Stelle unterschiedliche RVOL Werte ein.
Use Traffic Color for Line: Die unterschiedlichen T1-4 Werte und Farben werden für das Liniendiagramm genutzt.
Dieser Indikator wird häufig mit unserer zweiten Version Real Relative Volume - Bar Indicator - Time Adjusted - DE & EN verwendet.
/////// English version
Finding the right stock is not always easy. An important variable in stock selection is the relative volume, which is used by many successful traders and trading firms. Think of it like this: Instead of looking at absolute volume, we look at actual strength. So how much volume is traded today compared to a regular day? This gives an indication of whether the stock is "in play".
Note: If the RVOL (relative volume) is increased, more market participants are interested in this stock than usual. This is especially important if the market direction and the direction of the stock do not match.
If the market rises, most shares will also rise. This can, therefore, happen without an increased RVOL. But what happens if the market goes against us? Then we are quickly shaken out of RVOL-weak stocks. Therefore, we always want to focus on stocks that have an increased relative volume! These are the stocks that are trading really strongly right now and probably have a catalyst for that.
The Real Relative Volume - Line Indicator shows you the current relative volume. Our Algo uses the actual cumulative volume of the current day at the respective (current) time and compares it with the historical average volume at the same time . This gives us a correct picture of the current strength. With the help of the indicator, we can also see whether this strength increases, remains the same, or if it loses power quickly. Unlike other scripts, we use an advanced method that recognizes the current position on the day and thus does not split the session into equal parts. Advantage: The indicator also works in crypto, forex, foreign stock markets, indices, and many more.
Functions:
Please use without extended trading hours!
Sessions Back: Changes the baseline that you compare to today's volume. Example: 10 - At the current time you see the real relative volume of today in relation to the last 10 sessions (at the same time). (*max 5000 Bars)
Threshold: Set a certain threshold at which you want to be alerted via the TradingView function.
T1-4: Set different RVOL values.
Use Traffic Color for Line: The different T1-4 values & colors are used for the line plot.
This indicator is often used with our second version Real Relative Volume - Bar Indicator - Time Adjusted - DE & EN .
Black Corsair VolumeBuilt-in volume script allows you to enable moving average over the volume. It is useful, but not as effective since it doesn't rate extremes which are the most interesting part about volume.
Black Corsair script adds two more measurements. One that picks highs over 100 periods and averages them. It is called High Tides. The other, Low Tides, picks lowest levels and averages them.
Anything below Low Tide is considered extremely low volume. Anything above High Tide is extremely high volume. However, these are the extremes. Volume is relatively high even when it approaches High Tide or relatively low when it approaches low tide.
Good luck!

Volume, Simple Relative Volume HighlightThis script plots volume bars and highlight bars that have an unusual activity, compare to the average (Standard: Simple Moving Average, 50 periods).
The script is useful for checking daily volume levels on equities. Where there is high volume, there is likely volatility, wich is good for day trading and swing trading entries.

Rolling Relative VolumeThis script sums the volume for the selected period and compares it to the selected period before that. It works on a rolling basis, so it is suitable for 24/7 markets such as crypto. That is the main difference between this and the regular RVOL indicator. Of course lower timeframes can also be selected for comparing changes in volume, but you should be aware how the times when markets are closed affect the calculation. For example, if used on stocks, the indicator will use the data that is available, meaning that the amount of data needed to calculate daily cumulative volume can be stretched out over a few days. If the stock session is 8 hours long, that comes out to 3 days.
There are 2 windows of reference when summing the volume:
1) The Recent volume window -> sums the volume between the current candle and the start of the window
2) The previous volume window -> sums the volume from the start of the current window until the start of the previous window
An example follows at the end :)
How to set up:
1) In settings, select the Timeframe; weekly, daily and hourly (W,D,H) are supported.
2) Choose the multiplier of the recent timeframe (for example 4 for cumulative volume over the last 4h)
3) Choose the multiplier of the previous timeframe (for example 8, if you want cumulative volume of the 8h before the start of the recent window)
Example:
Settings:
Timeframe: D
Recent volume multiplier: 3
Previous volume multiplier: 1
The chart set to 1h timeframe
This will calculate the cumulative volume for the past 24h, starting at the recent candle. Then it will calculate the cumulative volume for 72 hours before the start of the recent (24h) window. So in total it will need 24 + 72 = 96 hours of data to calculate.
After that it will compare the volume of the recent window with the average of the previous window. If values are above 1 the volume is increasing, if below 1 it is decreasing.
Why is this useful?
It's easy to spot changes in the volume and see if the volume is increasing and by how much, compared to previous days. Of course volume also drives liquidity. If volume is picking up, that could be the start of a bigger move.
WARNING!!!
Use on very low timeframes (1m, 3m) with big lookback periods (W) can break the script or make it execute very slowly due to the nature of the indicator.
Because this works on bar data it's possible that changing timeframes will change the calculation slightly. Generally, lower timeframes produce more accurate results, but take longer to calculate. The selected timeframe for the indicator should always be higher than the timeframe of the chart, otherwise the calculations won't make sense.
Leave a comment or send a DM for any improvements, bugs or ideas for automation / algo trading.

Relative Volume Bars / Moving AverageThis indicator is highly experimental and settings are meant to be adapted to your time frame and asset of choice.
This indicator is a moving average that focuses on relative volume instead of all volume. It only factors in prices of candles that are meeting your relative volume input.
The multipliers can be used to smooth your average towards buy side or sell side or keep them the same.
I have also added in averages for buy side only and sell side only, these are highly experimental and turned off by default. Feel free to play with them.
This indicator is free to all Oasis Trading Group Members.
For Access or Questions Please Private Message Us, Thank you.

Cumulative Volume Ratio v1.0Simple.
NYSE only.
0700am-1200pm only.
5 minute candles only.
The code compares the cumulative volume of the current day to the 20 day cumulative average up to that same point in time.
This is commonly referenced as the Zanger Ratio.
The colors are based on the that version.
Below 60 = drying up (grey)
Above 60 = below average (orange)
Above 80 = average (pink)
Above 120 = High (magenta)
Above 200 = Extreme (red)
I purposely have these bars slightly transparent so we can quickly identify this indicator apart from my Specific Bar Volume Ratio or other bar based indicator.
This example is in Central time.
Contact me if you are interested.

(JS) Ultimate RSISo my goal here was to combine all of my RSI ideas into a single indicator in order to make kind of a "Swiss Army Knife" version of the Relative Strength Index ...
------------------------------------------------------------------------------------------------------------------------------------------------------------------------------------------------------------------------------------------------------------------
So, let's begin with the first RSI indicator I made, which is the RSIDVW (Divergence/Volume Weighted);
To rephrase my original post, the "divergence/volume weighted" portion is meant to expand upon the current RSI format by adding more variables into the equation.
The standard RSI is based off one value that you select (open, close, OHLC4, HLC3, etc.) while this version takes three variables into account.
The default setting is to have RSI normal without anything added to it (Divergence Weight = 0)
1st - it takes the standard variable that RSI normally uses.
2nd - it factors RSI divergence by taking the RSI change % and price change % to form a ratio. Using this ratio, I duplicated the RSI formula and created a divergence RS to be factored in with the standard price RS .
3rd - it takes Relative Volume and amplifies/weakens the move based upon volume confirmation. (So if Relative Volume for a price bar is 1.0, the RSI plot would be the same as it normally would)
So to explain the parameters
- Relative Volume Length: This uses the RV length you specify to determine spikes in volume (or lack of volume ), which then is added into the formula to influence the strength of the RSI move
- RV x Divergence: This is how I calculated the original formula, but you can leave this unchecked to turn Relative Volume off, or apply elsewhere.
- RV x RS: There's two sides, Divergence RS and Standard RS - these check marks allow you to select which part you prefer to be multiplied by Relative Volume .
Checking neither turns off Relative Volume , while checking both amplifies its effects by placing it on both sides of the equation.
-Divergence Weight: This controls how much the DVW portion of the formula influences the RSI plot. As I referred to earlier, default is 0 making RSI normal. The Scale is 0-2, so 1.0 would be the same as 50%.
When I do have DVW on, I generally set it to 0.5
-SMA Divergence: To smooth, or not to smooth, that is the question. UJsing an SMA here is much smoother in my opinon, but leaving it unchecked runs it through an RMA the same way standard RSI is calculated.
-Show Fractal Channel: This allows you to see the whole fractal channel around the RSI (This portion of the code, compliments of the original Ricardo Santos fractal script)
------------------------------------------------------------------------------------------------------------------------------------------------------------------------------------------------------------------------------------------------------------------
The next portion of the script is adding a "Slow RSI"...
This is rather simple really, it allows you to add a second RSI plot so that you can watch for crossovers between fast and slow lines.
-Slow RSI: This turns on the second RSI Plot.
-Slow RSI Length: This determines the length of the second RSI Plot.
------------------------------------------------------------------------------------------------------------------------------------------------------------------------------------------------------------------------------------------------------------------
Pivot Point RSI was something a friend of mine requested I make which turned out pretty cool, I thought... It is also available in this indicator.
-Pivot Points: Selecting this enables the rest of the pivot point related parts of the script
If Pivot Points isn't selected, none of the following things will work
-Plot Pivot: Plots the pivot point .
-Plot S1/R1: Plots S1/R1.
-Plot S2/R2: Plots S2/R2.
-Plot S3/R3: Plots S3/R3.
-Plot S4/R4: Plots S4/R4.
-Plot S5/R5: Plots S5/R5.
-Plot Halfway Points: Plots a line between each pivot .
-Show Pivot Labels: Shows the proper label for each pivot .
When using intraday charts, from a 15 minute interval or less the pivots are calculated based on a single days worth of price action, above that the distance expands.
Here are the current resolutions Pivot Points will work with:
Minutes - 1 , 2, 3, 5, 10, 13, 15, 20, 30, 39, 78, 130, 195
Hours - 1, 2, 3, 4, 5, 6
Daily
Weekly
Currently not available on seconds or monthly
------------------------------------------------------------------------------------------------------------------------------------------------------------------------------------------------------------------------------------------------------------------
Background Colors
Background Colors: I have six color schemes I created for this which can be toggled here (they can be edited).
Gray Background for Dark Mode: Having this on looks much better when using dark mode on your charts.
------------------------------------------------------------------------------------------------------------------------------------------------------------------------------------------------------------------------------------------------------------------
Now finally the last portion, Fibonacci Levels
-Fibonacci Levels: This is off, by default, which then uses the standard levels on RSI (30-50-70). When turned on, it removes these and marks fib levels from 0.146 through 0.886.
------------------------------------------------------------------------------------------------------------------------------------------------------------------------------------------------------------------------------------------------------------------
So the quick rundown:
Ultimate RSI contains "divergence/volume weighted" modifications, a slow RSI plot, pivot points , and Fibonacci levels all while auto-plotting divergence and having the trend illustrated in the background colors.
RSI has always been my "go to" indicator, so I hope you all enjoy this as much as I do!

Multi-Exchange Volume (30 Tickers) by kurtsmock + BV + rVolauthor: kurtsmock
Fully Customizable ticker set. Up to 30 Tickers. Bitcoin set as default.
-- IMPORTANT NOTE: --
30 Exchanges are a lot. It can take a while to load. You can fully customize this indicator to your liking. Here's how:
1. Load indicator
2. Open Settings
3. Uncheck the switch box for exchanges you want unincluded
4. At the bottom of the settings menu click "Defaults" and hit "Save as Default"
5. To turn them all back on, hit "Reset Settings" in that same "Defaults" menu and click "Save as Default" again.
Also, you don't have to use this with Bitcoin. This works with any asset, just change the ticker in the settings.
There's a lot going on with this indicator so the following is descriptions and instructions to help you better understand what's going on here. Thanks!
Goal:
- To provide a mechanism for assets on multiple exchanges to have their volume evaluated together
Edge:
- Having better and more complete volume information
Notes:
- The Default Exchanges for this indicator are highest volume bitcoin exchanges, but may contain "fake volume"
- Indicator is set for Bitcoin by default. However, you can change the tickers to reflect any asset you want
////// rVol //////
Goal:
- To understand how much volume is being executed relative to the same candle on previous days/periods
Edge:
- Higher rVol implies higher volatility and market interest.
- High rVol = higher than average volume . Markets move on volume so higher than average volume indicates increased market activity/volatility
- rVol is an indirect measure of active or anticipated volatility
Definitions:
- rVol: The volume of a period compared to the Average Volume of that same period in past sessions
- Important to note it does NOT add up the last 10 (default) candles, but rather the last 10 candles at session intervals.
- Example:
-- On a Tuesday, 1h chart it will add up the last ten Tuesday, 9:00 am candles, not including the current, active candle.
-- It then averages those lookback candles.
-- It then plots the percentage relationship between the most recent candle and the average of the lookback candles
-- Avg Vol of Lookback candles = 5000,
-- Volume of most recent candle = 4000: Output = rVol = 80:
-- Volume of most recent candle was 80% of the average volume in the 9 am time period of the last ten Tuesdays in the 9 am, 1h period
Notes:
- rVol does not add current candle volume into lookback sum. So, you set lookback to be: (not including the current day)
- rVol is on a switch. So, if you want to see rVol instead of volume, hit the switch in the settings
- If you want to see both, load 2 instances of the indicator.
////// Better-er Volume //////
Goal:
To Identify:
- When a candle closes at the highest volume * range relative to the lookback period and close > open
- When a candle closes at the highest volume * range relative to the lookback period and close < open
- When a candle closes at the highest volume / price relative to the lookback period
Edge:
- Identifies beginnings of price expansion, climax of price expansion, breakouts, pivots, and take profit points on the volume chart
Notes:
- Based generally on Barry Taylor's "Better Volume" indicator and ideas from Pascal Willain's book "Value in Time."
- Better-er Volume rules are applied to both Total Volume or rVol.
-- When rVol is displayed Better-er Volume is applied to rVol
-- When Total Volume is displayed Better-er Volume is applied to Total Volume
// Plot Key: //
Green Triangle Up = Often marks the beginning and/or end of price expansion to the upside
Red Triangle Up = Often marks the beginning and/or end of price expansion to the downside
Yellow Square = High Volume but Tight Range. Implies a Battle of Bulls and Bears. High Liquidity area. Provided Liquidity is not enough to move price. Thick Limit Order Book.
Purple Triangle Up or Down = Implies high market participation. Typically at the end of expansion when very significant s/r is hit
category: volume Volatility
tags: Volume rVol relativevolume Bitcoin cryptocurrency bettervolume
Many More Volume Indicators Coming Out Soon!

Relative Volume RVOL AlertsRelative Volume or RVOL is an indicator used to help determine the amount of volume change over a given period of time.
It is often used to help traders determine how in-play a ticker is.
General rule of thumb is the higher the RVOL, the more in play a stock is.
I myself like to use it as a substitute of the volume indicator itself.
Basic Calculation:
Relative Volume = Current Volume / Average Volume
Crossover Signals:
Any time there is a volume spike which causes a crossover of the user set 'Smoothed Moving Average' or 'Threshold' a green/red dot will appear at the top. The color of the dot is dependent on closing of the candle. Therefore it does not necessarily mean price will continue in that direction since volume spikes often happen in peaks or valleys.
Threshold:
The level at which custom alerts and signal can be set. The higher the value, the more volume required to trigger.
Built in Alerts:
You can set custom alerts for the crossovers of the adjustable threshold, or the average RVOL band.

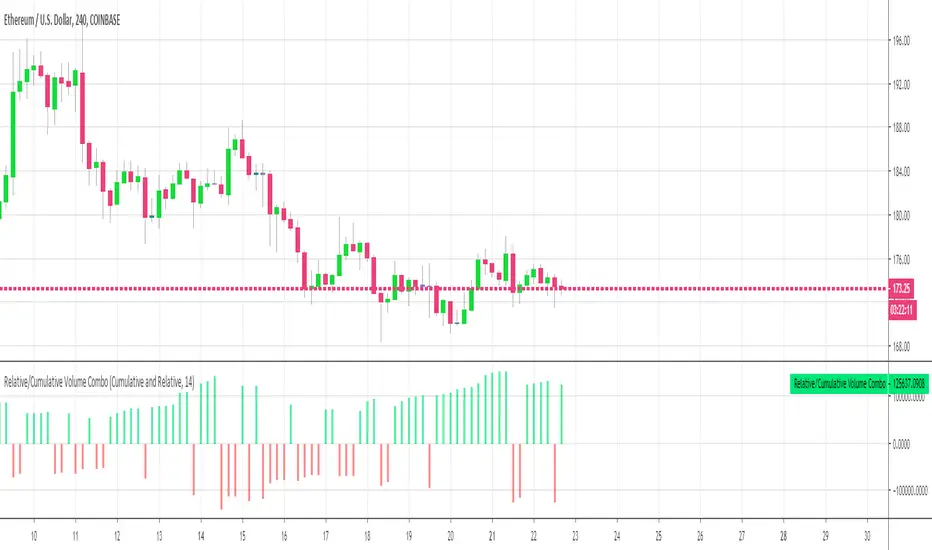
Relative Volume Combined With a Cumulative FunctionHi everyone
The today's script was suggested by a follower.
--------------------------------------
1 minute of Knowledge
--------------------------------------
Many traders look at volume as a pre-signal that a move may happen.
In trading, some say that "the volume precedes the movement".
This simply means that often volume will increase before a significant move in the stock.
Imagine if a unique trader is buying a crypto/stock. The volume is unlikely to move.
But, if all the mass goes to mass spot buy an asset, then we could see a volume spike announcing a potential upwards move.
---------------------------------------------
What's the story with that indicator?
---------------------------------------------
It's an interesting way of presenting the volume data.
Will show the total volume for the selected period.
You can choose between relative and cumulative presentation.
The users can display the consecutive rising volume above the 0 line and the failing volume below that line.
--------------------------------------
Mix knowledge with usefulness
--------------------------------------
A price making a higher/high (HH) or lower/low (LL) has a real and strong meaning- a HH or LL on a volume has a significant meaning also.
Increasing volume for a stock/crypto, could signify that buyers were willing to purchase a bigger number of shares at a higher price (comparatively to the day before)
Obviously, non-stop crazy buying/shorting won't work at some point - and that "some point" may hurt a bit.
Such volume indicator combined with others like momentum or strength indicators is a nice trading strategy.
The volume announces that a move may happen and the other indicators will confirm the prophecy :)
Peace
Dave
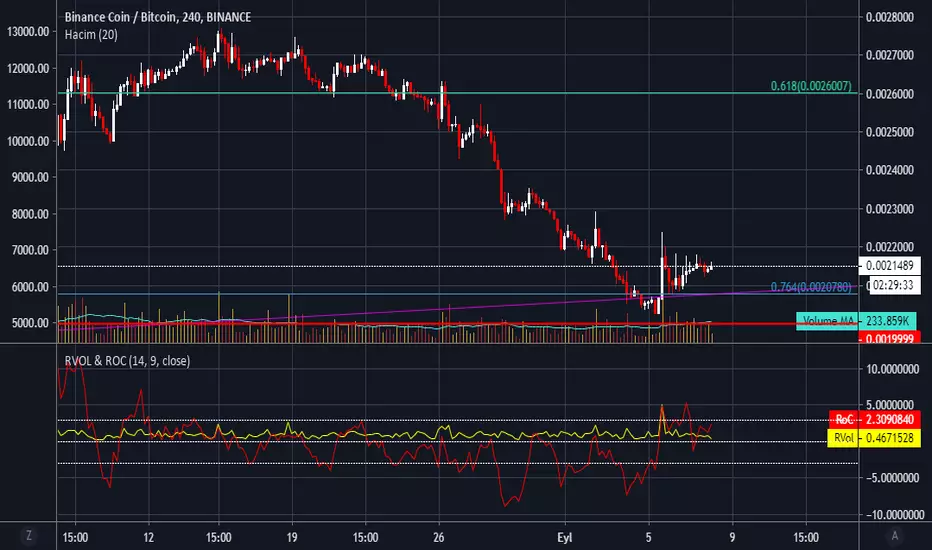
RVol & RoC - Relative Volume & Rate of Change by haciyatmazRelative Volume ( RVol ) is a critical measure of volume flows. It measures current volume in relation to the "usual" volume for this time of the day.
Rate of Change ( RoC ) is a momentum-based technical indicator that measures the percentage change in price between the current price and the price a certain number of periods ago.
RVOL - Final on 814 for 3m Candles ONLYRelative Volume for 3 minute charts ONLY.
Lookback 20 days.
Historical and average values are used to formulate the ratio.
Thank you to R4Rocket for the initial code.
I also researched the RVOL output in Trade Ideas to align the final ratio as close as possible.
The colors change at different levels:
<0.5 ; Red
0.5 > and <=.65 ; Orange
0.65 > and <=1 ; Dark Yellow
1 > and <=1.25 ; Bright Yellow
1.25 < and <=1.5 ; Dark Green
1.5 < and <=2 ; Brighter Green
Above 2 ; Very Bright Green


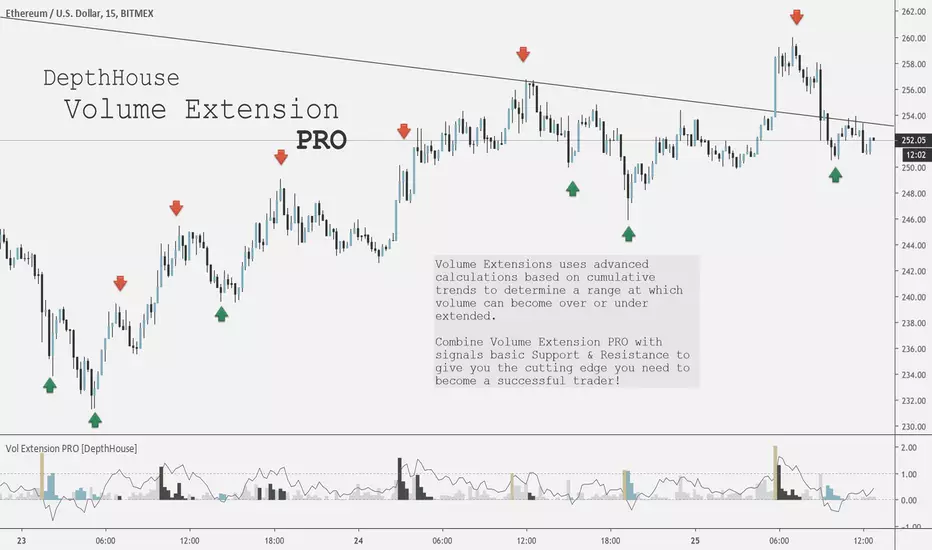
Volume Extension PRO [DepthHouse]Would you like to have an edge over other traders? By being ahead of the competition you can take faster and better decisions. We can provide you with indicators that give you full overview over the most important values that affect the movements of your assets. Get a subscription today! It's never too late to become a pro trader!
Volume Extensions PRO uses advanced calculations based on cumulative trends to determine a range at which volume can become over or under extended.
Thus signalling potential points of support or resistance.
Combine Volume Extension PRO with signals basic Support & Resistance to give you the cutting edge you need to become a successful trader!
TUTORIAL
Volume Extension:
The volume bars represent the current candle volume extension based on historical data. The higher the extension, the more volume present compared to the user set lookback period.
Volume bars that extend past 1 represent a massive surge in volume.
Extension Oscillator:
The extension oscillator is the most advance feature with this indicator. It uses cumulative volume averages to create a range in which volume travels in. The extension oscillator reads very similar to an RSI.
Over 1 = overbought / over extended volume
Under 0 = oversold / under extended volume
The extension oscillator may also be used a tool to pin point levels of volume divergence
Signal Colors:
The colored bars represent either a surge in volume (gold), or over or under extension.
These colored bars may be used to pinpoint key volume levels to help determine short or long term trend reversal points.
Combine these signals with basic support and resistance to give you professional edge!
The chart above has manual placed arrows to represent when and where the Volume Extension PRO indicator gave these signals.
Settings:
Length: Lookback period of the oscillator
Weight: Adds additional weight to the cumulative volume averages for lower volume exchanges.
Warning : This is a based volume indicator. Therefore its results are entire based on the the volume of that exchange! Some exchanges or currency pairs may not provide enough volume to give accurate results. Do not solely rely on this indicator to make your trades. Please use responsibly.
Request a FREE Trail via my website!
RVOL - R4RocketRelative volume or RVOL for short is an indicator that is used to measure how 'In Play' the stock is. Simply put, it helps to quantify how interested everybody is in the given stock - higher the value, higher the interest and hence higher is the probability for movement in the stock.
I have tried to create RVOL (Relative Volume ) Indicator as per the description that I read on SMB Capital blog. The blog is a great resource.
...................................................................................................................................................................................
How to use the indicator - The indicator is meant for INTRADAY ONLY.
The indicator has following inputs -
1. RVOL Period - Value from 3 to 14 (Default Value = 4)
This is used to calculate the average volume over the given period of days. e.g. average volume for the last 5 days, last 3 days, last 10 days etc. NOTE - If you use higher RVOL Period on smaller timeframes, the code will give an error. So I recommend using 4 or lower for 5 min timeframe. (Nothing will work on 1 min chart and you can experiment for other timeframes.)
2. RVOL Sectional - True / False (Default Value = False)
If you check this box then you will be able to calculate the RVOL for a particular session (or between particular sessions) in that trading day.
What do I mean by session?
Well I have divided the trading day into 6 (almost) equally spaced sessions in time, i.e. 6 hours and 15 mins (for NSE - India) of trading day is divided into 1 hr - 1st session, 1 hr - 2nd session, 1 hr - 3rd session, 1 hr - 4th session, 1 hr - 5th session, 1 hr and 15 min - 6th session.
Before using 3rd and 4th inputs of indicator, RVOL Sectional box MUST BE CHECKED FIRST.
3. RVOL From Session - 1 to 6 (Default Value = 1)
4. RVOL To Session - 1 to 6 (Default Value = 2)
Now if you select 2 in "RVOL From Session" input and 3 in "RVOL To Session" input, the indicator will calculate RVOL for the 2nd and 3rd hour of the trading day. If you select 3 in both the inputs, then the indicator will give RVOL for the 3rd hour of the trading day.
5. RVOL Trigger - 0.2 to 10 (Default Value = 2)
Filter to find days having RVOL above that value. The indicator turns green (or colour of your choice) when RVOL is more than "RVOL Trigger".
...................................................................................................................................................................................
Hope this indicator will add some value in your trading endeavor.
“Only The Game, Can Teach You The Game” – Jesse Livermore
Yours sincerely,
R4Rocket
**If you have some awesome idea for improvement of the indicator - request you to update the code and share the same.

Trade Context Relative Volume With BarsThis indicator will show you the relative volume today vs. the last X number of days.
This way, you don't have to wait until the end of the day to see how the volume compares to previous days.
Volume=Volatility so this helps give us a gauge for projections for the day.
This will only work with minute bars.
Enjoy

Trade Context Relative Volume With BarsTrade Context Relative Volume with bars is an indicator that shows how much volume we have at a particular time of day when compared to the last X number of days.
The beauty of the indicator is you do not have to wait until the end of the day to see the average volume for today's session.
This indicator only works on minute bars and it will give you the relative volume for each bar, and a cumulative ratio for the entire day (up to that point).
Enjoy.

Relative Force Significant Support & Resistance
Force is best described as net buying or net selling pressure. It is measured by weighting volume by the direction and magnitude of period price change. Hence higher volume or big positive price level changes will result in high net buying pressure, vice versa.
The Relative Force Significant Support & Resistance indicator takes it a step further by denoting the price levels when the short term force deviates significantly from the long-term mean. So when significant net buying or selling force is detected, the prevailing price level is set as a SSR level until the next significant force event.
How to use the Relative Force SSR
SSR levels consist a mixture of red and green dots. Green dots denoted net buying pressure and red dots denotes net selling pressure.
Price action tends to cluster around SSR levels as these are price levels where the bulls and bears are trying to find an equilibrium. For example, in an uptrend, significant net buying is usually a sign of impending weakness as the bull volume have been expended and there are no net incremental buying volume to support the uptrend.
Vice versa, significant net selling volume in an uptrend which does not result in a price correction means there are sufficient bulls to soak up the selling volume.
To simplify matters:-
#1 Price action above SSR levels implies stock is in uptrend
#2 Price action below SSR levels implies stock is in corrective mode
#3 Clustering of SSR levels implies range bound price action
This indicator is time frame independent, so feel free to adjust the chart resolution to see higher level support/resistance levels or to gauge entries in lower time frames.

Volume, Relative Volume HighlightThe indicator plots regular volume bars.
The highlight is given by the current cumulative volume for the day, compared to a custom average (standard 20 periods). The stronger the color, the higher the relative volume is. Stocks moving of higher relative volume have higher chances of making predictable moves.

% Volume (%V)Read about it in the book of Buff Pelz Dormeier "Investing with Volume Analysis: Identify, Follow, and Profit from Trends" .
Normalized volume ( %V ) is a concept that uses an average of volume to plot volume. The volume total for the current bar is divided by the average volume (over the last n bars) to form a ratio. This ratio is multiplied by 100 and plotted in the same way that traditional volume is plotted as vertical bars on the horizontal plane, which creates a normalized volume scale of 0 to 100 . This allows for easy interpretation of volume’s relative movements, with 50 being typical or average volume, numbers below 50 being light volume, and numbers above 50 being heavier volume.
Good luck!
