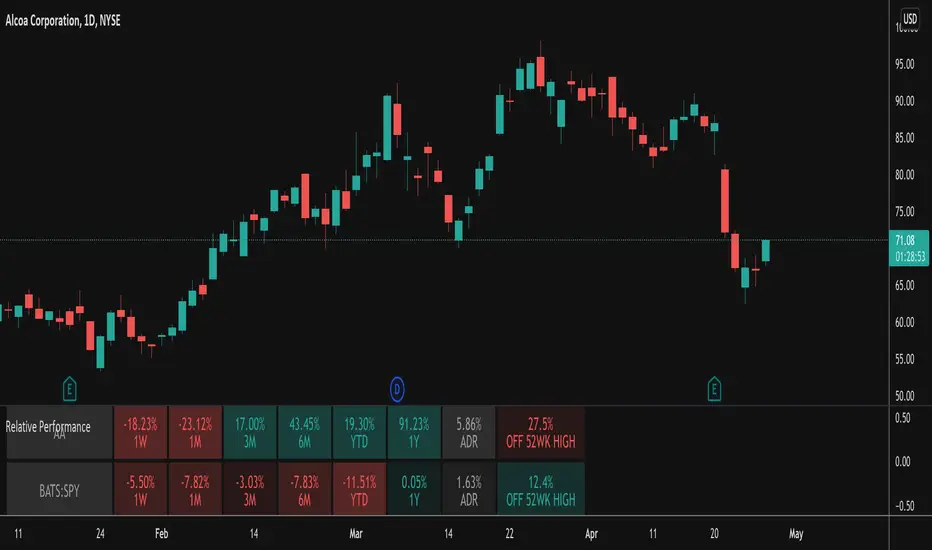
Relative PerformanceThis indicator takes the Performance Table from @BeeHolder and converts it to a Relative Performance table so you can compare the current chart vs. an Index (or whatever other ticker you want) to see the relative performance of one vs. the other. I also added a cell for ADR, which is also the same value as "Monthly Volatility" in the stock screener. This can be useful when screening stocks based on performance and volatility.
렐러티브 스트렝쓰 컴패리즌
QuantAnna: Relative Strength Plus (RS+)NSE:TATAMOTORS
Relative strength indicator which shows ratio between two stocks/assets .. usually between stock & its indices
features of indicator is as following.
1. Values oscillates around zero, it is bullish when above zero & bearish when below zero.
1. Weighted smoothing which removes unwanted whipsaws but keeps trend curve intact.
3. In-Built list of Nifty sector indices to show stocks comparison with its sector
please do send your feedback and suggestions.

Simple RSI tableThis is a simple RSI table for traders that don't want the graph, only the current value.
Location, thresholds, and colors are all adjustable.
Relative StrengthPowerful tool to calculate and display the strength of a security compared to another security.
Some Main purposes are:
- finding new leadership in a market correction
- comparing a market leader with a top competitor
- tracking rotation in the market
.. and so much more!
This tool is highly configurable, you can especially change:
- The reference symbol (SPY, QQQ, BTCUSD, ...)
- The time span to indicate a new High or Low in a certain time-frame
- Factorize your RS-Chart to make it fit to the original chart. (Moves the chart up or down)
- Option to repaint your candles / bars when a new RS High occurs in the given timeframe.
Enjoy and have a great day!
Powerful_Trading
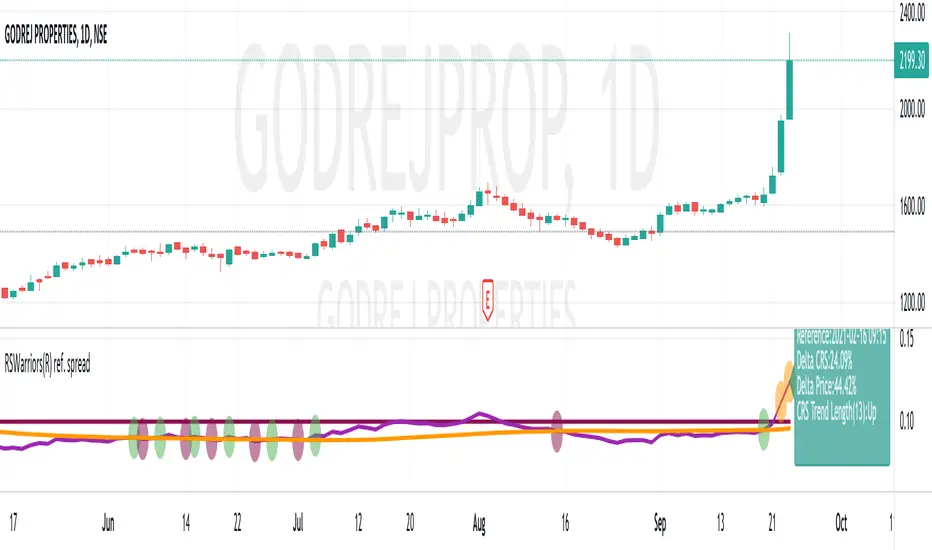
Fixed Reference Ratio Charts (RSWarriors(R))A Ratio Chart, for analysis with any benchmark. This is the open source version of the earlier, Fixed Ref. Ratio indicator. This is the version that will be maintained in the future.
Plots a ratio of the symbol to benchmark. Plots, all time high ratios (orange bubbles), Increasing ratios (blue bubbles).
Detailed write up will be added in subsequent updates.
Ultimate RSIsThis RSI script includes everything you could want on an RSI. There are multiple timeframes which will give context to market movement, as well as a highlight feature to make it easier to visualize overbought and oversold stocks.
Tip: Uncheck the 4 plots with no color in them to remove the extra headers on the indicator.

Relative Strength ComparisonThis indicator compares the difference in percentage change between two symbols
over a user-specified number of bars.
Default settings will show the difference between the current symbol and the
S&P 500 ETF (SPY) over 10 bars. It can be used to determine if the stock is
showing relative strength or weakness compared to the overall market.

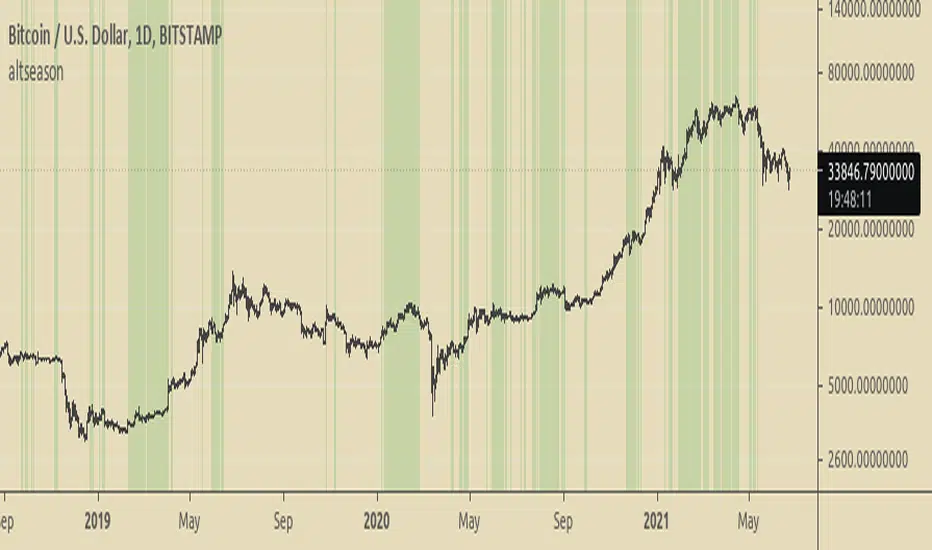
Altseason FinderTo know when to buy altcoins instead of bitcoin.
It is based on BTCUSD and BTC Dominance RSIs.
Multiple RSI LengthsThis script will allow users to view Multiple RSI timeframes in one indicator (up to 4). This can be useful for viewing RSI Convergences/Divergences and extremely long timeframes like 250 days can provide context to market strength over long positions.

MS CRB/SPYThis indicator tracks the GSCI Commodity Index over the course of the S&P 500. This is used for the fundamental evaluation of ratios of asset classes to each other. The thesis is based on Ray Dalio's quadrant theory: in periods without inflation and with good growth, stock prices rise and commodity prices fall. Conversely, in periods of good growth in an inflationary environment, commodities rise and the rise in equities slows. In particular, there is a change of favorites towards companies that produce cash (i.e. away from growth fantasies). This indicator shows the change in valuations between asset classes and thus allows conclusions to be drawn. This still goes far beyond what has been written, I recommend reading Ray Dalio's works on this.

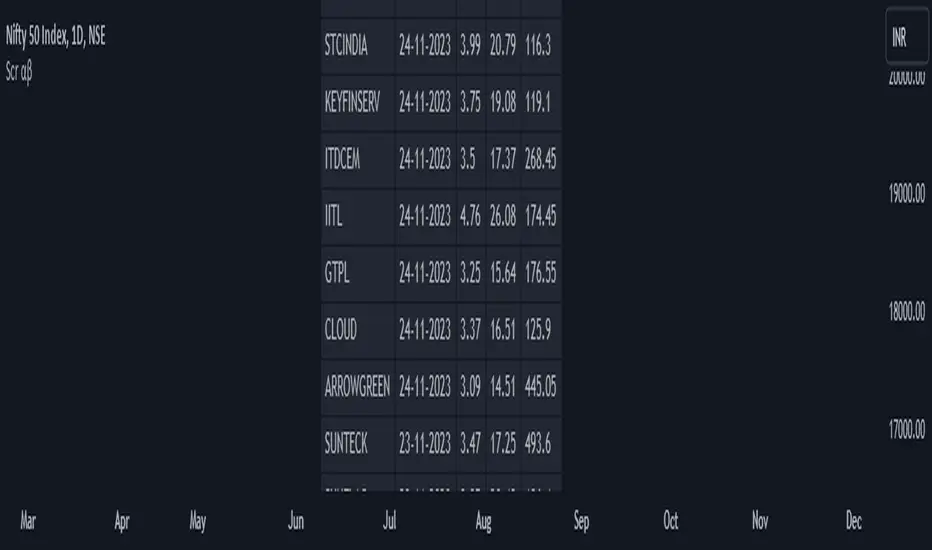
Screener: Alpha & BetaThis is a Live Screener for my previous Alpha & Beta indicator, which filters stocks lively based on the given values.
Use 5min timeframe for Live Intraday.
The default stocks in the screener is selected based on high beta value from F&O listed stocks. It may include other stocks also.
User can input stocks of your choice either through the menu or through the Pine editor.
The maximum number of stocks inputs is only 40. The indicator includes only 20 stocks by default.
More number of stocks can be added but it makes the screener slower to load.
Open the indicator in a sperate tab or window to avoided the loading lag.
It is recommended to choose only 10 to 20 stocks based on the weightage from each sectors.
Beta values are dynamic. It changes from day to day based on the trend and sector.
Update the sock list weekly or twice a week or monthly.
Use investing.com screener(preferably) or TradingView screener for shortlisting beta stocks.
Remember that majority of indicators fails in a sideways market, also every indicator is not 100% accurate.
Relative Strength Comparison_FBMSCAPShows the strength of current symbol relative to strength of another symbol, defaulted to Bursa Malaysia broad market index: FBMSCAP. Best viewed in weekly chart.

Relative Strength RatioAbout this indicator:
This indicator goes under many different names such as Relative Strength Ratio, Comparative Strength, Relative Strength Comparison (RSC) etc.
It compares the strength of the current asset to another asset of your choice and displays the relative strength of the current asset. (Not RSI)
There are several comparative indicators published already here on TV but I have added some unique features that I think is really useful.
When to use it:
This is useful when you want to compare for example a stock with its sector to find out if the stock is a leadership stock in that sector or main index.
You could also use it to compare the sector to its index etc.
If you want to compare for example a stock to both its index and its sector at the same time I suggest you add 2 instances of this indicator.
In many trading systems you are supposed find the strongest tickers by identifying "layers of strength" like 1. The strongest asset class that money is flowing into (like stocks, commodities, bonds, etc.) 2. Find the strongest sectors. 3. Find the stocks outperforming those sectors. 4. Find some kind of entry signal there.
How it works:
The indicator calculates an "RS line" (Relative Strength) by dividing the current ticker with a ticker of your choice. This creates a ratio or pair similar to how currencies are related to each others like USDGBP (dollar against pound). The RS line is black by default so you might want to change its color if you use a dark theme.
If the RS line is moving up it means your current asset is stronger than the asset you are comparing it with and vice versa.
Use the simple moving average to quickly see long term strength trends.
Features
RS line
Shows the relative strength of the current asset.
SMA
This Simple Moving Average has directional coloring; green when it is angled up and red when it is angled down. You can customise the period in the settings. If you don't want the color change just make both up/down color the same.
Relative market label
This displays the market you are currently comparing with as a label next to the last data point.
Because I tried stocks in 2 different countries I want to know which index I am comparing with and this label saves me from going into the settings to check. I find it to be a life saver!
Please let me know if you find any problems or if you have any ideas for improvement
SectorsThis script attempts to show the relative strength of the 11 sectors in the SPX, which can be accomplished in three ways:
1. Sectors - displays all sector indices as they appear normally
2. Sector Relativity - displays each sector divided by the sum of the other 10 sectors
3. Sector Alpha - displays the alpha of each sector as compared to the sum of the other 10 sectors
I have seen some other iterations of this script that compare each sector to the SPX as a whole, a couple problems with that:
1. SPX sector weightings are unequal and change quarterly, meaning you will get an inaccurate depiction of relative sector strength across time.
2. Even if using an equal-weight SPX, you would be comparing a sector to itself as all 11 sectors are included in the SPX, not just the complementary 10 you are looking to compare one sector to.
For more information on the sectors in the SPX or the calculation of Alpha, visit the links at the top of the script.
*Includes an option for repainting -- default value is true, meaning the script will repaint the current bar.
False = Not Repainting = Value for the current bar is not repainted, but all past values are offset by 1 bar.
True = Repainting = Value for the current bar is repainted, but all past values are correct and not offset by 1 bar.
In both cases, all of the historical values are correct, it is just a matter of whether you prefer the current bar to be realistically painted and the historical bars offset by 1, or the current bar to be repainted and the historical data to match their respective price bars.
As explained by TradingView,`f_security()` is for coders who want to offer their users a repainting/no-repainting version of the HTF data.

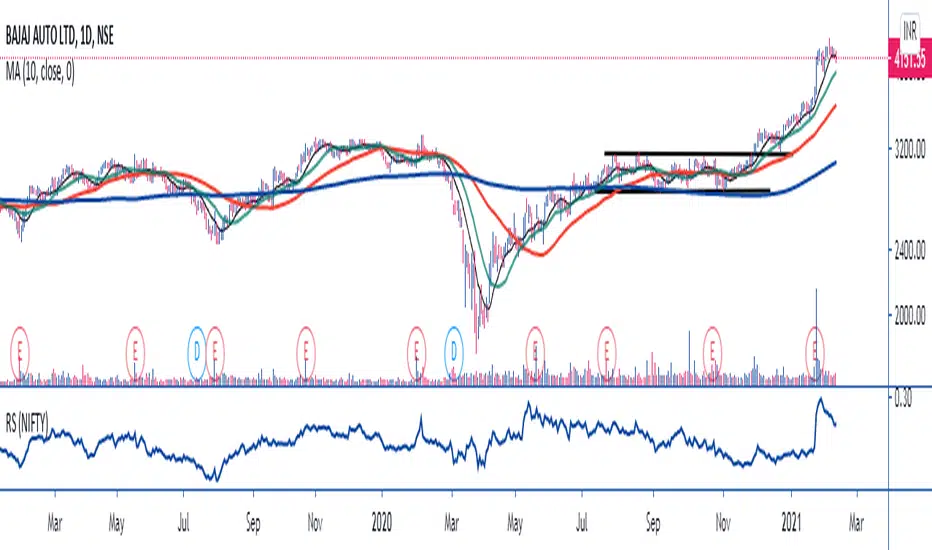
MAVERICKAMIT01-RELATIVE STRENGTHTHE SCRIPT SIMPLY DIVIDES THE STOCK PRICE BY NIFTY TO MEASURE UNDER PERFORMANCE AND OUT PERFORMANCE WITH NIFTY. YOU CAN CHANGE SETTINGS FROM NIFTY TO ANY OTHER SECTOR LIKE CNX FMCG TO MEASURE SECTOR PERFORMANCE AND UNDER PERFORMANCE !!!
RS.ROC | Relative Strength - Rate of Changes - 4CR CUPFor completeness of Relative Strength studies, the Relative Strength based on rate of changes (ROC) with weighting is coded and presented as well.
The RS.ROC is similar to the formulation of RS by IBD before rank among all the stocks in the market.
The lookback period is relaxed for customizing. Once you set the total lookback period, representing the 4Q, in the indicator, the other shorter lookback periods will be auto-calculated, namely, 1Q, 2Q, 3Q.
A simple moving average of the RS.ROC is also added for your easier analysis on the trend development of the strength.
To use it later at your charting later,
1. Favorite it;
2. Select from your favorite list.

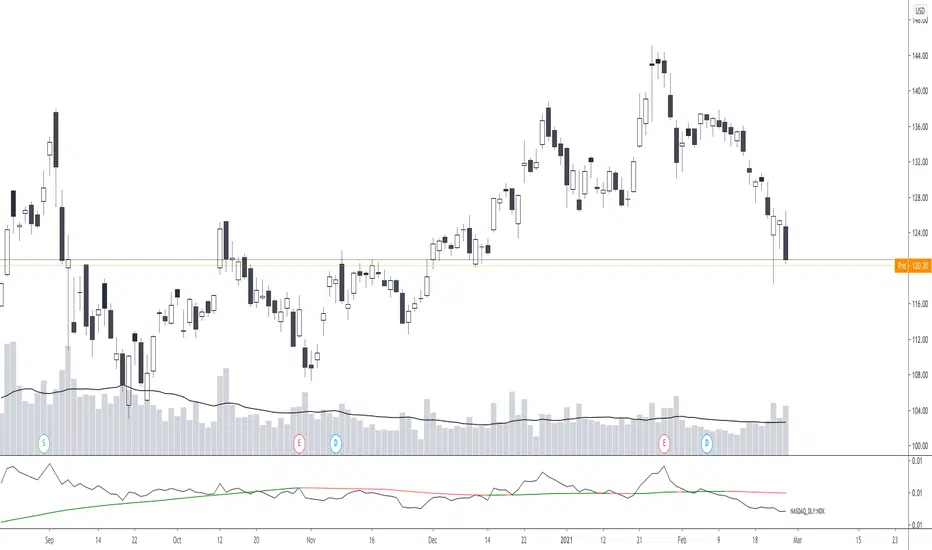
Candlestick RSThis is a candlestick charted Relative Strength indicator. It compares the chosen stock's progress compared to that of the SPY ETF ... ( SPY is used so it should hopefully update intraday). I use this indicator to see which stocks are outperforming the market.
Input Variable Descriptions:
Ratio: this variable is a float (0 to 1) that is basically how close the Candlestick RS is to the actual price action of the chart. (1.0 being right on top of it, 0.0 being as far away as possible from it)
Ballpark SPY price: this variable has to be constant, and due to the way pinescript works, you have to manually put in a ballpark of what SPY is at.
Neither of these variables influences the actual data of the indicator, but rather how it is shown on screen. It's difficult to describe, so I recommend you messing around with the variables and see what changes.
Hope this helps, I find this useful, so I figured I'd publish this... This is my first pine script so forgive me for any errors, just want to help :)
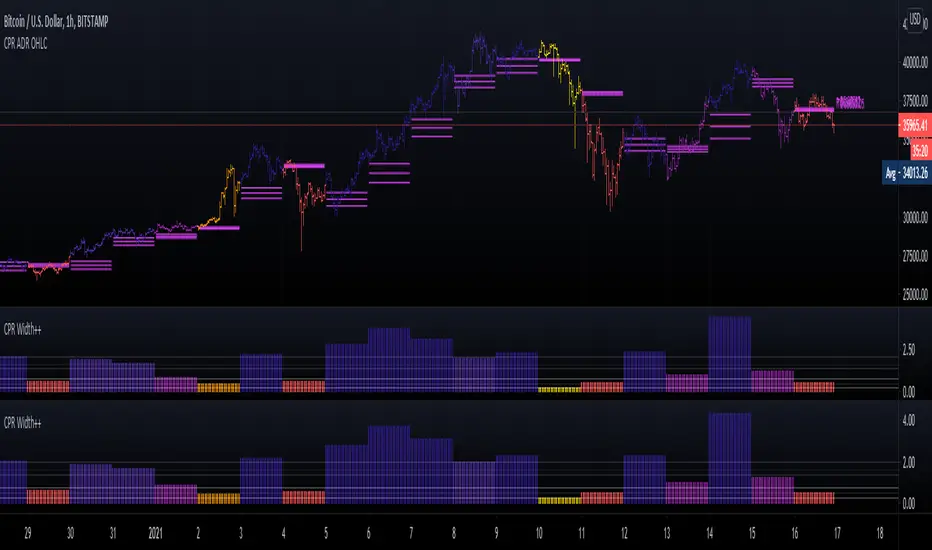
CPR Width + MTF, Offset and BarcolorsDue to the request of some users and inspired by "5 Day ADR ICT Intraday Tracker" I updated "CPR Width" and added extra functionality for your convenience.
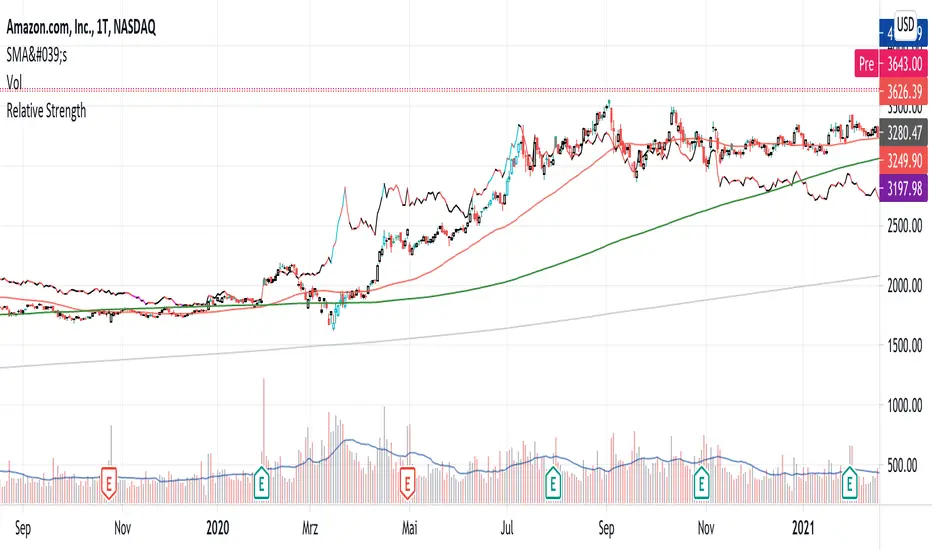
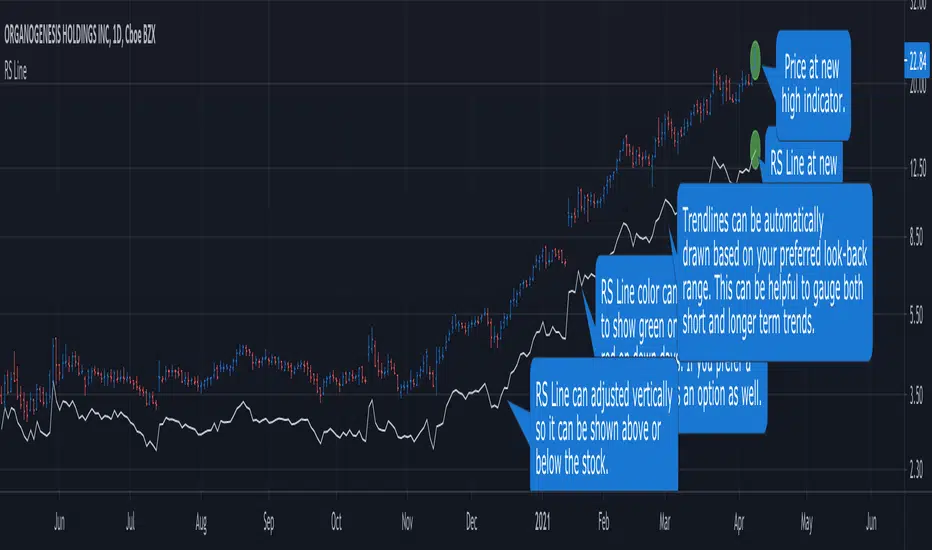
RS Line - Relative Strength Line [LevelUp]Overview:
This implementation of the RS Line mimics how Investor's Business Daily and CANSLIM investors measure growth stock performance versus the S&P 500.
If you are looking at a weekly chart, the RS Line is the performance of the stock over the past week versus the S&P 500 over that same time frame. The same logic applies to the daily and monthly charts, only the time frames are different.
If a stock moves up for the day/week/month and the S&P 500 does not, the RS Line will move up. If a stock ends the day/week/month flat, yet the S&P 500 moves up, the RS Line will go down.
Usage:
- Look for an upward sloping line.
- The steeper the line, the better.
- Can be used for viewing long-term trend.
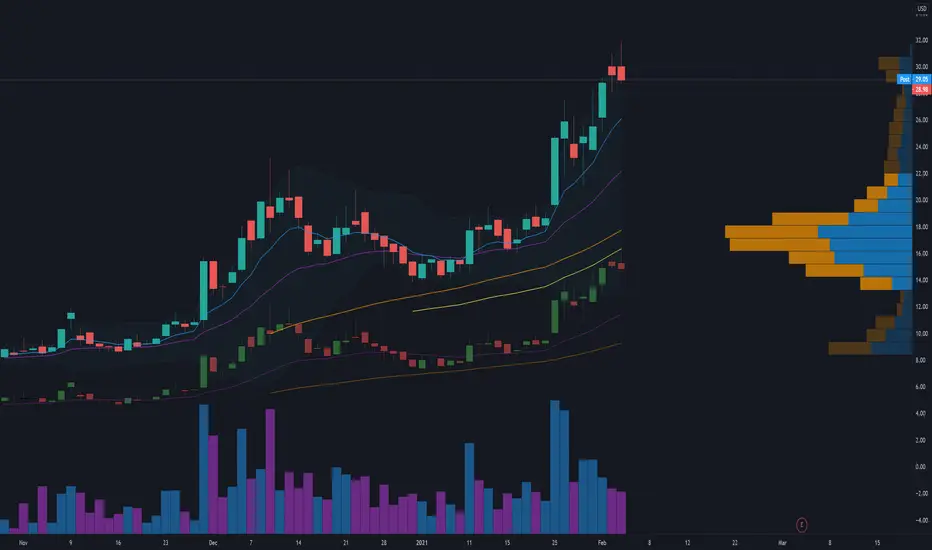
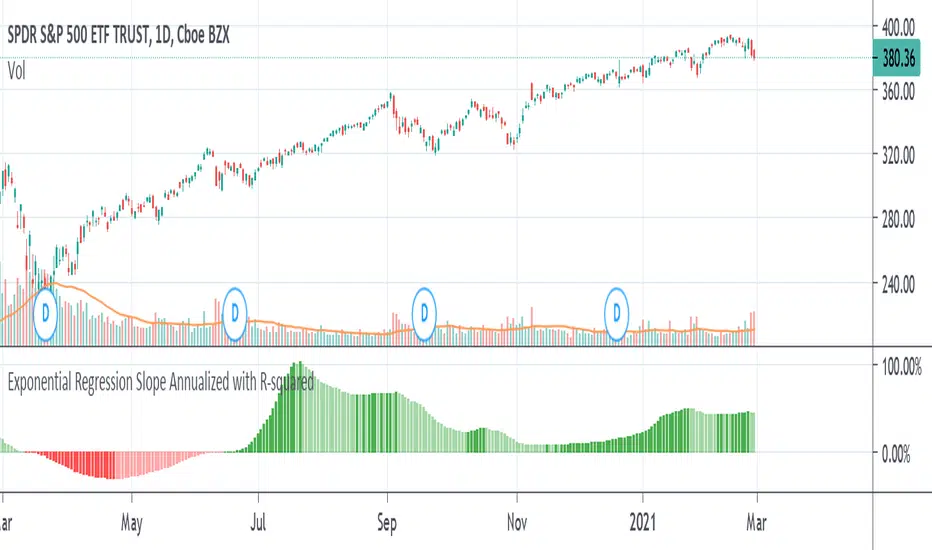
Exponential Regression Slope Annualized with R-squared HistogramMy other indicator shows the linear regression slope of the source. This one finds the exponential regression slope and optionally multiplies it by R-squared and optionally annualizes it. Multiplying by R-squared makes sure that the price movement was significant in order to avoid volatile movements that can throw off the slope value. Annualizing the exponential slope will let you see how much percentage you will make in a year if the price continues at its current pace.
The annualized number is the number of trading days in a year. This and the length might need adjusting for the extra bars that might be in futures or other markets. The number does not have to be a year. For example, it can be a month if you set the number to 20 or so trading days to find how much you would make in a month if price continues at its current pace, etc. This can also be used as an alternative to relative strength or rate of change.
Percentage Relative StrengthA relative strength indicator that compares your main symbol (one on your chart) strength to another symbol by percentage.
The result is plotted as a histogram showing which symbol is rising or falling more in percentage.
In case your chart symbol is TSLA (Tesla) and the indicator 'Symbol to compare' is SPX:
GREEN area (above zero) means TSLA is rising more than the SPX.
RED area (below zero) means TSLA is falling more than the SPX.
To these who wants to understand calculation, it's pretty straightforward.
For each asset we calculate everyday percentage change based on previous close and current close.
We take main asset (chart symbol) percentage and subtract it from percent of change of the symbol we want to compare to.
Result are smoothed by SMA (Simple Moving Average)
You can select different indexes or cfds such as S&P500 (SPX), NASDAQ 100 (NSX), RUSSELL 2000 (RUT) and NASDAQ (IXIC).
Default is S&P 500 (SPX).
Enjoy and Like if you like.

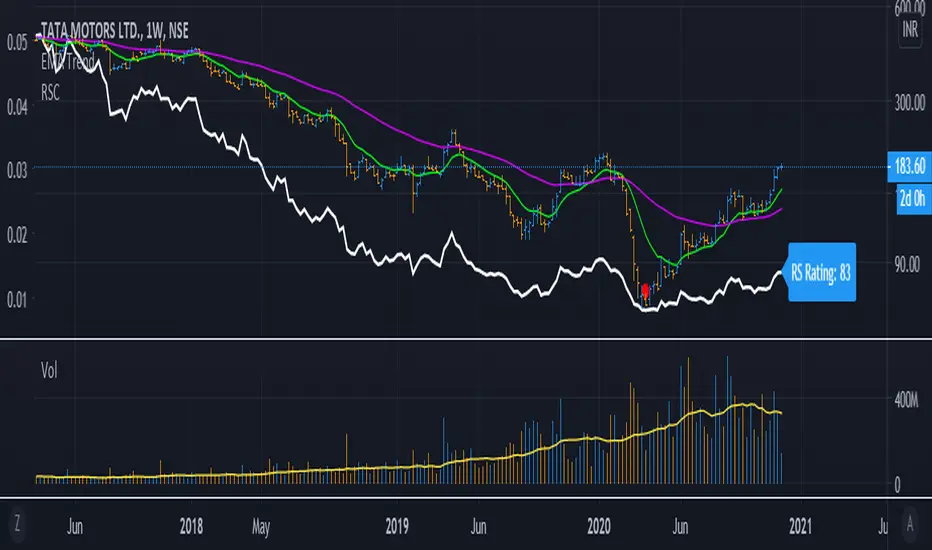
RelativeStrengthComparative_IBD_YRKI am publising Relative Strength Comparative.
It is be used to compare a Stock's Performance against another stock/index (Default NIFTY50)
I also devised a Plot RS Rating which is inspired from IBD's RS Rating and matches to some extent. You can turn off/on the RS Rating as per need.
Example: ITC vs NIFTY 50 it will be ITC / NIFTY
The Indicator can be used in Multiple ways:
1) Check Relative Strength
2) Check RS Rating (This is not Accurate as of now since IBD compares the ratings of all the stocks in an Exchange)
3) Can be used as a Spread Chart for the Division (We need to not divide every time we change Stocks)
4) Design a Template exactly as MarketSmith by using the TradingView feature of "Move to --> Existing Pane Above"
The Formula i used for RS Rating is below with more weightage on the 3 month performance and lesser on 12 month Performance. I am open to Modification of this Formula if a better suggestion
// relative strength IBD style
ThreeMthRS = 0.4*(close/close)
SixMthRS = 0.2*(close/(close*2))
NineMthRS = 0.2*(close/(close*3))
TwelveMthRS = 0.2*(close/(close*4))
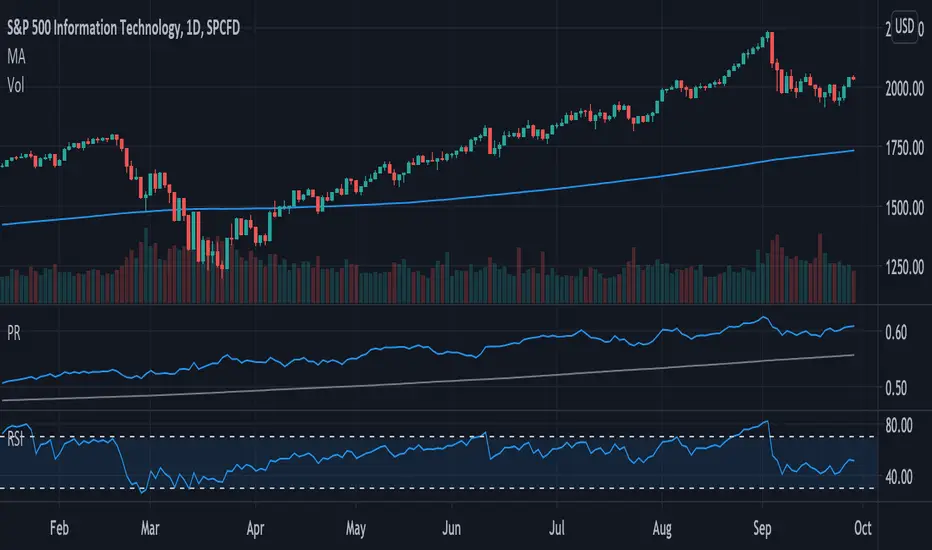
Price Relative / Relative StrengthThe Price Relative indicator compares the performance of one security to another. This indicator can be used to compare the performance of a stock against a benchmark index, such as the S&P 500, or its sector/industry group. This makes it possible to determine if a stock is leading or lagging its peers.
The Price Relative is used to gauge relative strength, which is important when it comes to stock selection. Many portfolio managers compare their performance to a benchmark, such as the S&P 500. Their goal is to outperform that benchmark. In order to achieve this goal, managers often look for stocks that are showing relative strength. Enter the Price Relative. The Price Relative rises when a stock shows relative strength and is outperforming its benchmark. Conversely, the Price Relative falls when a stock shows relative weakness and is underperforming its benchmark.
Source: school.stockcharts.com
This script allows the user to
Add a new indicator pane for Price Relative (PR)
Edit the benchmark symbol (Comparative Symbol)
Edit or hide the moving average
Quickly determine if the symbol is outperforming or underperforming its benchmark
Quickly determine if the symbols is trending higher or lower based on a simple moving average