DCA Detective | v1.0BINANCE:FETBUSD
The DCA Detective | v1.0 strategy revolutionizes the realm of DCA (Dollar Cost Averaging) trading, integrating advanced trade initiation predicated on savvy Technical Analysis (TA) signals. This strategy's distinctive feature rests in its capacity to leverage TA signals or preset percentage levels to trigger safety orders, providing adaptability based on your preference. Bid farewell to rudimentary safety order placements.
The strategy incorporates a comprehensive array of parameters:
RSI Oversold Level - a predetermined level signaling a potential oversold condition where a price rebound may be imminent.
Divergence Lookback Period - this parameter specifies the duration over which the system scrutinizes for any disparity between price and RSI.
Minimum Bars Between Trades - this guarantees a specific interval between trades, thwarting excessive trading and promoting diversification over time.
Rate of Change (ROC) - a momentum-oriented technical indicator that gauges the percentage alteration in price between the current price and the price a certain number of periods back.
Stochastic Length and Oversold - parameters that delineate the Stochastic Oscillator, another momentum indicator that compares a particular closing price of a security to a spectrum of its prices over a specified period.
Higher Timeframe RSI Length and Oversold Level - for heightened precision, these parameters operate on lower timeframes, offering a wider outlook and aiding in the filtering of market noise.
The DCA Detective | v1.0 strategy deploys bullish divergence identified by the RSI and a crossover of the RSI over the oversold level as primary entry signals. Safety order conditions can be set to either Percentage or Smart, based on your preference. The "Smart" condition utilizes the same rules as the initial entry order to place safety orders.
The strategy also entails additional configuration settings such as the maximum safety orders, safety order price deviation, safety order volume scale, safety order step scale, and take profit percentage.
Main goal is to catch possible market bottom/dip.
In summary, the DCA Detective | v1.0 strategy proposes a sophisticated and nuanced approach to DCA trading. It taps into the potential of TA signals to initiate trades, while using safety orders as a risk management tool, with the intent to minimize possible losses and decrease overall time in trade. This strategy stands as a testament to refined trading tactics, crafted for those who endorse strategic investment and measured risk-taking.
Through webhook integration, the DCA Detective | v1.0 strategy can send signals to 3commas to initiate trades, adjust safety orders, and take profit at the designated percentages. This provides traders with a hands-off approach to trading, allowing them to focus on other areas of their portfolio or strategy while the DCA Detective | v1.0 strategy runs in the background.
So far, I haven't come across a good DCA strategy based on TA orders, so I created my own. I was troubled by my prolonged exposure to red bags, but with proper configuration, this strategy should get you out of the trade as soon as possible. I have managed to enter most of the good coins at an unbeatable average trade time and also eliminate the maximum trade time to less than 10 days !
레이트 오브 체인지 (ROC)

Trend Reversal DetectionIntroducing the "Trend Reversal Detection" indicator, a sophisticated and user-friendly script that utilizes the PeacefulIndicators library to identify potential trend reversals in the market. This indicator is designed to help you stay ahead of market changes and enhance your trading analysis.
The Trend Reversal Detection indicator offers the following features:
Customizable input parameters, allowing you to adjust the Rate of Change (ROC) length, Moving Average (MA) length, and MA type (SMA, EMA, or WMA) according to your trading preferences and style.
A visually intuitive display, using orange and blue markers to indicate potential trend reversals, making it easy to interpret the indicator's signals.
The core functionality of the Trend Reversal Detection indicator is powered by the trendReversalDetection function from the PeacefulIndicators library, ensuring accurate and reliable reversal detection.
To start using the Trend Reversal Detection indicator in your trading analysis, simply add the script to your chart and customize the input parameters as needed. We hope this script, built upon the PeacefulIndicators library, proves to be a valuable addition to your trading strategy.

Indicatore volatilità v5 con segnali------------- INGLESE -------------
This indicator uses an exponential moving average (HMA) of the length specified by the user to calculate market volatility. Volatility is calculated by multiplying the Average True Range (ATR) by the simple moving average (SMA) of the volume.
The code uses colors to display market conditions. If the closing price is above the HMA, the columns turn green. If the closing price is below the HMA, the columns turn red. If volatility is below the SMA of volatility multiplied by the user-specified sideways volatility threshold, the columns turn orange.
In addition, the code uses the Rate of Change (ROC) to generate buy and sell signals. If the ROC is positive and the columns are green, a buy signal is generated and the columns turn black. If the ROC is negative and the columns are red, a sell signal is generated and the columns turn purple.
In summary, this indicator uses colors to display market conditions and help the user enter and exit the market based on volatility.
If you like this indicator give me a boost and leave a comment!! Thank you!
------------- ITALIANO -------------
Questo indicatore utilizza una media mobile esponenziale (HMA) della lunghezza specificata dall’utente per calcolare la volatilità del mercato. La volatilità viene calcolata moltiplicando l’Average True Range (ATR) per la media mobile semplice (SMA) del volume.
Il codice utilizza i colori per visualizzare le condizioni di mercato. Se il prezzo di chiusura è superiore all’HMA, le colonne diventano verdi. Se il prezzo di chiusura è inferiore all’HMA, le colonne diventano rosse. Se la volatilità è inferiore alla SMA della volatilità moltiplicata per la soglia di volatilità laterale specificata dall’utente, le colonne diventano arancioni.
Inoltre, il codice utilizza il Rate of Change (ROC) per generare segnali di acquisto e vendita. Se il ROC è positivo e le colonne sono verdi, viene generato un segnale di acquisto e le colonne diventano nere. Se il ROC è negativo e le colonne sono rosse, viene generato un segnale di vendita e le colonne diventano viola.
In sintesi, questo indicatore utilizza i colori per visualizzare le condizioni di mercato e aiutare l’utente a entrare e uscire dal mercato in base alla volatilità.
Se ti piace questo indicatore mettimi un boost e lascia un commento!! Grazie!

RSI-ROC Momentum AlertThis is the RSI-ROC Momentum Alert trading indicator, designed to help traders identify potential buy and sell signals based on the momentum of price movements.
The indicator is based on two technical indicators: the Rate of Change (ROC) and the Relative Strength Index (RSI). The ROC measures the speed of price changes over a given period, while the RSI measures the strength of price movements. By combining these two indicators, this trading indicator aims to provide a comprehensive view of the market momentum.
An RSI below its oversold level, which shows as a green background, in addition to a ROC crossing above its moving average (turns green) signals a buying opportunity.
An RSI above its overbought level, which shows as a red background, in addition to a ROC crossing below its moving average (turns red) signals a selling opportunity.
Traders can use this indicator to identify potential momentum shifts and adjust their trading strategies accordingly.
The ROC component of the indicator uses a user-defined length parameter to calculate the ROC and a simple moving average (SMA) of the ROC. The color of the ROC line changes to green when it is above the ROC SMA and to red when it is below the ROC SMA. The ROC SMA color changes whether it's above or below a value of 0.
The RSI component of the indicator uses a user-defined length parameter to calculate the RSI, and user-defined RSI Low and RSI High values to identify potential buy and sell signals. When the RSI falls below the RSI Low value, a green background color is applied to the chart to indicate a potential buy signal. Conversely, when the RSI rises above the RSI High value, a red background color is applied to the chart to indicate a potential sell signal.
This indicator is intended to be used on any time frame and any asset, and can be customized at will.

Bar Color Long / Short Indicator With Advised SLOverview
This script is a trading indicator named "Bar Color Long / Short Indicator With Advised SL" designed for the TradingView platform. The indicator's primary purpose is to provide entry signals for long and short positions, based on various technical analysis methods. Additionally, the indicator suggests stop-loss levels for both long and short positions.
User Inputs
The indicator has several user inputs, such as:
Length
Smoothing
Multiplier
Show bar colors (ON/OFF)
When the bar colors are turned off, the alert signals for long and short positions will be displayed instead.
Custom Risk Calculation
The script calculates a custom risk level based on a modified version of the RSI (Relative Strength Index) formula. The custom risk level is divided into three categories: low, medium, and high.
Sentiment Score Calculation
The indicator calculates a sentiment score based on a combination of methods resembling EMA (Exponential Moving Average), MACD (Moving Average Convergence Divergence), and ROC (Rate of Change). The sentiment score is used to determine if the sentiment is positive or negative.
Bollinger Bands Percent and Combined Signal
The Bollinger Bands Percent is calculated, and the custom risk, sentiment score, and Bollinger Bands Percent are combined to generate a new signal. This signal is used in conjunction with EMA10 to determine the bar colors and provide entry signals.
Bar Colors
Based on the combined signal and EMA10, the script determines the bar colors as follows:
Orange: Positive sentiment
Blue: Negative sentiment
Gray: Neutral
Entry Signals and Alerts
When the bar colors are turned off, the indicator displays large green arrow signals for long (buy) positions and red arrow signals for short (sell) positions based on the sentiment and EMA10 conditions. The script also includes alert conditions for long and short signals, which can be used to set up notifications when these signals are triggered in the TradingView platform.
Advised Stop-Loss Levels
The indicator plots stop-loss lines for both long and short positions at the last candle, accompanied by labels showing the advised stop-loss levels in numeric values.

Rate Of Change [Hyperbolic]Rate Of Change just got fixed!
Do note that you have to activate the "exotic calculations" inside the ROC-H settings.
A hyperbolic curve now transforms price. No more infinities on your indicators!
You may use the "exotic" function, that is embedded in my script in your own scripts.
This formula basically transforms the input (which may be zero or negative) into a strictly positive one.
While the mathematicians out there would opt for alternative formulae (like the exponential for negative numbers), I used the hyperbolic curve for continuity purposes. Feel free to build upon my calculations, and make them even better!
Tread lightly, for this is hallowed ground.
-Father Grigori
P.S. I cannot lock the source code. Science and knowledge belongs to humanity. Knowledge must not be up for sale.

Know Sure Thing + RibbonFrom now on this will be the main indicator I will be using.
The mathematical foundation of KST is elegant and trustworthy. I took the time to share this beautiful (in my opinion) indicator, because you will probably be seeing it in my future ideas.
I am not a trader, this indicator was made to analyze mainly long-term charts, and trend-continuation/change analysis.
The purpose of this indicator is not to give entry/exit points. However, the 9-period EMA (tightest EMA) can serve as an alternative to the classic "9-period MA signal line".
Tread lightly, for this is hallowed ground.
-Father Grigori

Open Interest Wiser [WISY]This script calculates the open interest (OI) of a given futures contract and identifies when the OI is increasing or decreasing.
It then plots bubbles on the chart to indicate when the OI is increasing or decreasing, with larger bubbles indicating a larger increase or decrease.
The script also calculates the rate of change (ROC) and the relative strength index (RSI) of the OI and its delta.
The user can adjust the input parameters to change the sensitivity of the indicator to changes in OI.
Dear traders, while we strive to provide you with the best trading tools and resources, we want to remind you to exercise caution and diligence in your investing decisions.
It is important to always do your own research and analysis before making any trades. Remember, the responsibility for your investments ultimately lies with you.
Happy trading!

Momentum Composite Indicator@CRYPTOSLIFE
This script creates a Momentum Composite Indicator (MCI) that combines four different momentum indicators: RSI, MACD, Stochastic Oscillator, and Rate of Change (ROC). Each of these indicators is calculated, normalized, and then combined with equal weights (25% each) to create the composite indicator. The script also includes a color change based on the change in the composite indicator's value.
Here's a brief explanation of the indicator:
Parameters: The script takes one input parameter, 'length,' which is used as the length for RSI, Stochastic Oscillator, and ROC calculations.
RSI: The Relative Strength Index (RSI) is calculated using the 'length' input parameter. The RSI is then normalized to range between 0 and 1.
MACD: The Moving Average Convergence Divergence (MACD) is calculated using the default lengths of 12, 26, and 9. The histogram is then computed as the difference between the MACD line and the signal line. The MACD histogram is normalized to range between 0 and 1.
Stochastic Oscillator: The Stochastic Oscillator is calculated using the 'length' input parameter, taking the lowest low and highest high over the specified period. The oscillator is then normalized to range between 0 and 1.
Rate of Change (ROC): The Rate of Change (ROC) is calculated using the 'length' input parameter. The ROC is then normalized to range between 0 and 1.
Composite Indicator: The normalized values of RSI, MACD, Stochastic Oscillator, and ROC are combined with equal weights to create the composite indicator.
Color Change: The line color changes based on the change in the composite indicator's value. If the value increases, the line color is green; if it decreases, the line color is red.
Plotting: The composite indicator is plotted on the chart with a linewidth of 5.
This Momentum Composite Indicator can help traders assess the overall momentum in the price movement of a financial instrument by combining the information from four popular momentum indicators.

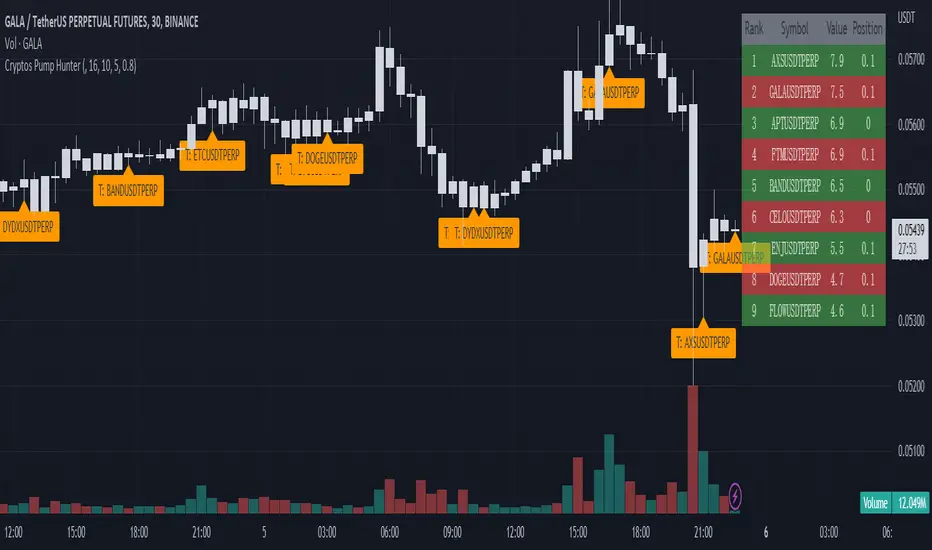
Cryptos Pump Hunter[liwei666]🔥 Cryptos Pump Hunter captured high volatility symbols in real-time, Up to 40 symbols can be monitored at same time.
Help you find the most profitable symbol with excellent visualization.
🔥 Indicator Design logic
🎯 The core pump/dump logic is quite simple
1. calc past bars highest and lowest High price, get movement by this formula
" movement = (highest - lowest) / lowest * 100 "
2. order by 'movement' value descending, you will get a volatility List
3. use Table tool display List, The higher the 'movement', the higher the ranking.
🔥 Settings
🎯 2 input properties impact on the results, 2 input impact on display effects, others look picture below.
pump_bars_cnt : lookback bar to calc pump/dump
resolution for pump : 1min to 1D
show_top1 : when ranking list top1 change, will draw a label
show pump : when symbol over threhold, draw a pump lable
🔥 How TO USE
🎯 only trade high volatility symbols
1. focus on top1 symbol on Table panel at top-right postion, trading symbols at label in chart.
2. Short when 'postion' ~ 0, Long when 'postion' ~ 1 on Table Cell
🎯 Monitor the symbols you like
1. 100+ symbols added in script, cancel remarks in code line if symbol is your want
2. add 1 line code if symbol not exist. if you want monitor 'ETHUSDTPERP ', then add
" ETHUSDTPERP = create_symbol_obj('BINANCE:ETHUSDTPERP'), array.unshift(symbol_a, ETHUSDTPERP ) "
🎯 Alert will be add soon, any questions or suggestion please comment below, I would appreciate it greatly.
Hope this indicator will be useful for you :)
enjoy! 🚀🚀🚀
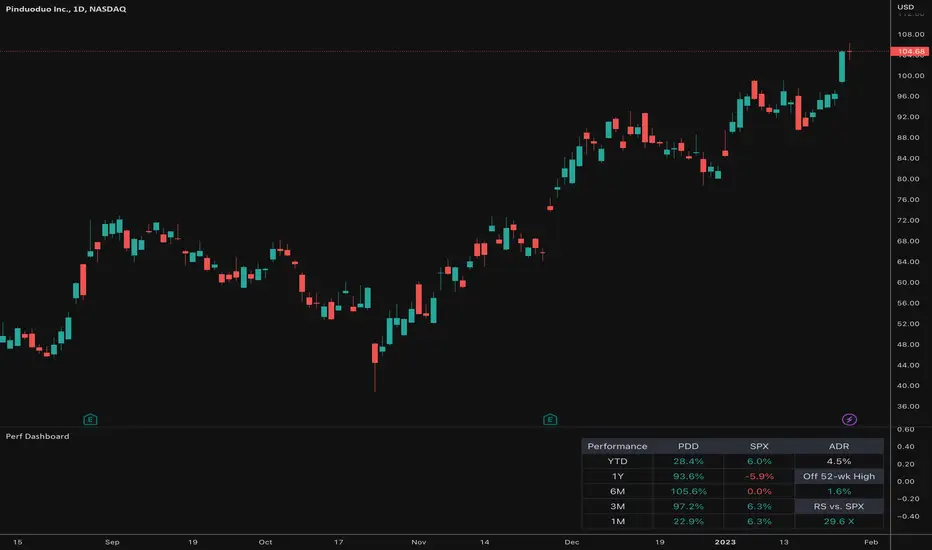
Relative Performance Dashboard v. 2This is a smaller and cleaner version of my previous Relative Performance table. It looks at the rate of change over 1M, 3M, 6M, 1YR & YTD and displays those for the current chart's ticker vs. an index/ticker of your choosing (SPX is default). I also have some fields for the ADR of the displayed chart, how far away the displayed chart is from 52-week highs, and a single number that compares the average relative strength of the displayed chart vs. the index. The way this average calculates is customizable by the user.
I like using this table next to an Earnings/Sales/Volume table that already exists by another user in the same pane and I designed this one so it can look just like that one to give a great view of the both fundamental and technical strength of your ticker in the same pane.
Keeping fundamental data independent from performance data allows you to still be able to see performance on things without fundamental data (i.e. ETFs, Indices, Crypto, etc.) as any script that uses fundamental data will not display when a chart that does not have fundamental data is displayed.
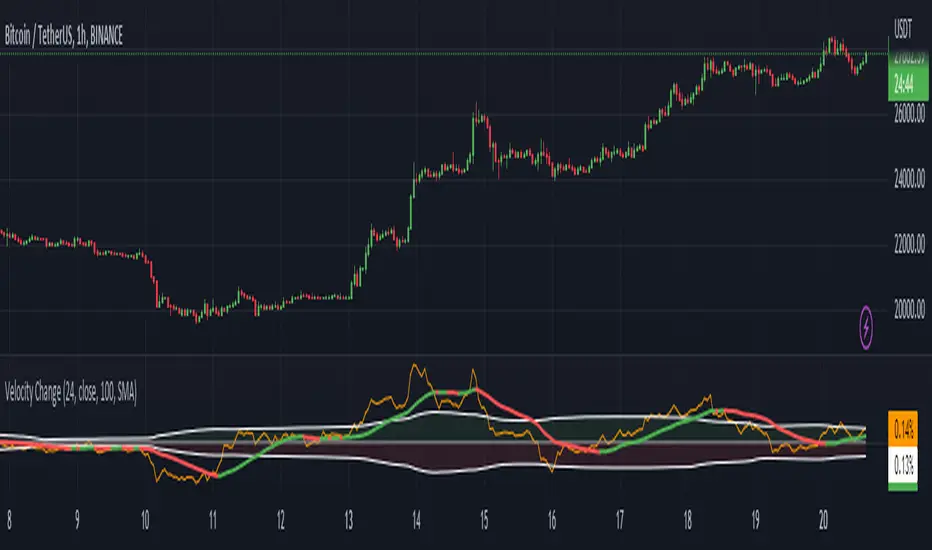
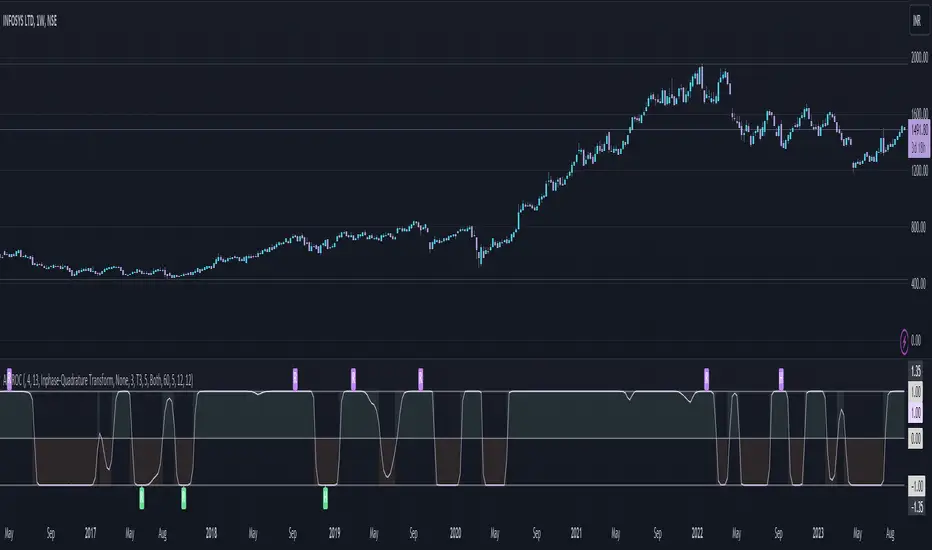
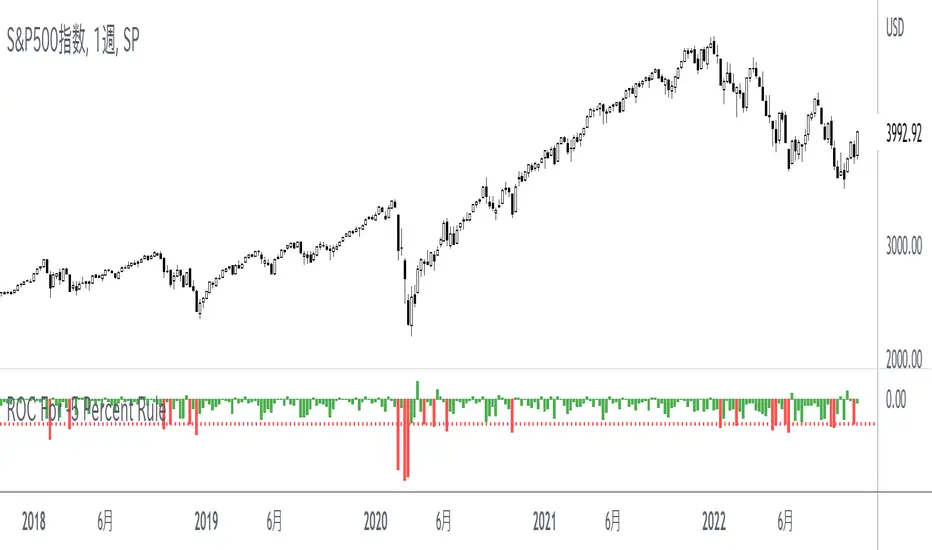
ROC (Rate of Change) Refurbished▮ Introduction
The Rate of Change indicator (ROC) is a momentum oscillator.
It was first introduced in the early 1970s by the American technical analyst Welles Wilder.
It calculates the percentage change in price between periods.
ROC takes the current price and compares it to a price 'n' periods (user defined) ago.
The calculated value is then plotted and fluctuates above and below a Zero Line.
A technical analyst may use ROC for:
- trend identification;
- identifying overbought and oversold conditions.
Even though ROC is an oscillator, it is not bounded to a set range.
The reason for this is that there is no limit to how far a security can advance in price but of course there is a limit to how far it can decline.
If price goes to $0, then it obviously will not decline any further.
Because of this, ROC can sometimes appear to be unbalanced.
(TradingView)
▮ Improvements
The following features were added:
1. Eight moving averages for the indicator;
2. Dynamic Zones;
3. Rules for coloring bars/candles.
▮ Motivation
Averages have been added to improve trend identification.
For finer tuning, you can choose the type of averages.
You can hide them if you don't need them.
The Dynamic Zones has been added to make it easier to identify overbought/oversold regions.
Unlike other oscillators like the RSI for example, the ROC does not have a predetermined range of oscillations.
Therefore, a fixed line that defines an overbought/oversold range becomes unfeasible.
It is in this matter that the Dynamic Zone helps.
It dynamically adjusts as the indicator oscillates.
▮ About Dynamic Zones
'Most indicators use a fixed zone for buy and sell signals.
Here's a concept based on zones that are responsive to the past levels of the indicator.'
The concept of Dynamic Zones was described by Leo Zamansky (Ph.D.) and David Stendahl, in the magazine of Stocks & Commodities V15:7 (306-310).
Basically, a statistical calculation is made to define the extreme levels, delimiting a possible overbought/oversold region.
Given user-defined probabilities, the percentile is calculated using the method of Nearest Rank.
It is calculated by taking the difference between the data point and the number of data points below it, then dividing by the total number of data points in the set.
The result is expressed as a percentage.
This provides a measure of how a particular value compares to other values in a data set, identifying outliers or values that are significantly higher or lower than the rest of the data.
▮ Thanks and Credits
- TradingView: for ROC and Moving Averages
- allanster: for Dynamic Zones

MATHR3E RAMP-MA█ OVERVIEW
MATHR3E RAMP-MA (R-MA) is a trend following indicator.
█ CONCEPTS
Disclaimer:
MATHR3E RAMP-MA indicator is intended for advanced traders and may fit your profile, whether you are a day trader or a long-term investor.
It was originally developed by a renowned market analyst and documented in numerous books. Among them is the author Jason Perl.
It is recommended to have read the trading techniques mentioned in the books covering this indicator beforehand.
How to use:
MATHR3E RAMP-MA is useful for determining if a market is trending and when so, to procure entry points to initiate a trade in line with the expected directional move.
It can be applied to markets as a stop-loss, as well as a low-risk entry qualifier in conjunction with other indicators of the same author.
Moving Average (R-MA I):
Only displayed when market is trending
• Bull trend: Green (moving avg Lows/Period)
• Bear trend: Red (moving avg Highs/Period)
Moving Average (R-MA II):
Always displayed
• Bullish outlook on the market: the 3-day moving average must be positioned above the 34-day moving average
• Bearish outlook on the market: the 3-day moving average must be positioned below the 34-day moving average
█ FEATURES & BENEFITS
Versatile:
This indicator is based on relative price action, so you can apply it to any market or time frame without having to change the default settings.
Rate of Change:
The ROC is calculated for the fast and slow periods of the R-MA (II).
R-MA (II) is colored blue when its rate of change is advancing and maroon when it is declining.
Breakout Qualifier:
A close above/below the moving average R-MA (I) that is confirmed by the following price bar's opening price
Materialized on chart with Flags:
• Green when bear trend ends
• Red when bull trend ends
Alerts
Get notified on:
• UpTrend breakout
• DnTrend breakout
• Any breakout Signal

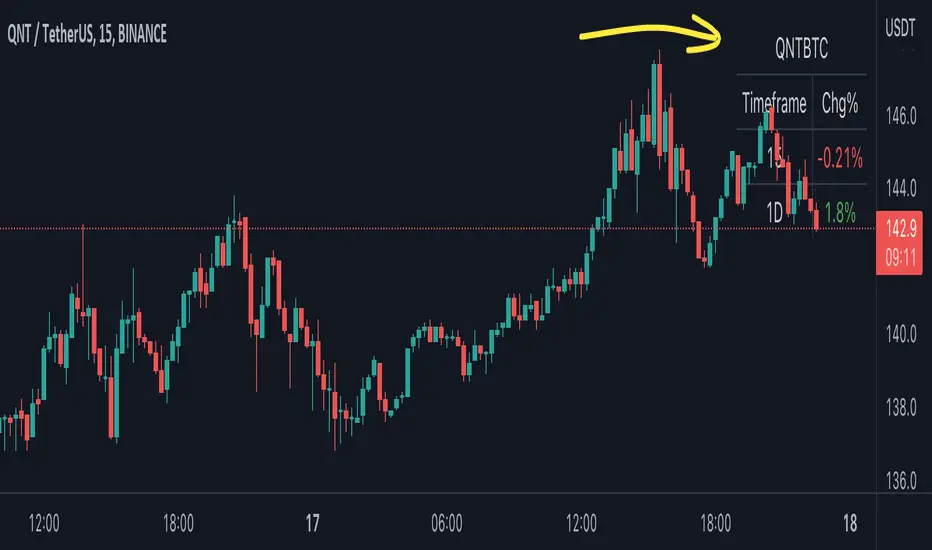
BTC Pair Change %This script makes it easier to quickly check how the BTC pair of the current symbol is performing on any pair.
It adds a " change percentage widge t" (of the BTC pair ) to the top right of the chart.
(Refer to the image for an example.)
The change percentage calculation is performed as described here:
www.tradingview.com
To match the "Chg%" that appears on TradingView watchlists, a 24H (1440min) timeframe is used, as described here:
money.stackexchange.com
In short, this script:
Searches for the BTC pair of the current symbol
Calculates the change % using the above described logic (links)
Adds a " change percentage widget " (of the BTC pair) to the top right of the chart
Allows for using 24H timeframe or the current timeframe (enable " Use current timeframe " under the script options)
Rate of Change Candle Standardized (ROCCS)ROCCS is a standardized rate of change oscillator with "error bars". Rate of change helps traders gauge momentum in a market by comparing the current price with the price "n" periods ago. What makes this special is you get to see the momentum of the momentum via the candle view. The candle transformation utilizes a moving average to smooth the signal however this is only used for the close price. The high and low prices are not smoothed. The moving average has an adjustable period, and so does the standardization.
I hope you can find great use in this upgraded roc indicator.

Adaptive Fisherized ROCIntroduction
Hello community, here I applied the Inverse Fisher Transform, Ehlers dominant cycle determination and smoothing methods on a simple Rate of Change (ROC) indicator
You have a lot of options to adjust the indicator.
Usage
The rate of change is most often used to measure the change in a security's price over time.
That's why it is a momentum indicator.
When it is positive, prices are accelerating upward; when negative, downward.
It is useable on every timeframe and could be a potential filter for you your trading system.
IMO it could help you to confirm entries or find exits (e.g. you have a long open, roc goes negative, you exit).
If you use a trend-following strategy, you could maybe look out for red zones in an in uptrend or green zones in a downtrend to confirm your entry on a pullback.
Signals
ROC above 0 => confirms bullish trend
ROC below 0 => confirms bearish trend
ROC hovers near 0 => price is consolidating
Enjoy! 🚀
[ChasinAlts] The Great Reset Hello fellow tradeurs, "The Great Reset" just tracks the % change of a coin. For whichever reset hour is chosen,
once the reset time is reached the % changes of all the coins reset to 0. This is great to find which coins have
been moving the most and to be able to see how all of them are moving compared to the rest. Once the reset interval
is up and the % change resets to 0, you can see the "*" at the end of the plots and if you hover over it the coin's
name is shown in a tooltip. Lastly, if a threshold of 5 is selected and alerts are also used then it will alert you at that % change
level as well as threshold*2 and threshold*3 so you can be notified if a coin is going on a tear and pumping through those % change
levels (the threshold, threshold*2, and threshold*3 levels are also printed as Hlines on the chart)
There is also the Printed Bar Filter to only show the coins that have been moving the most according to the values set in the filter
(if you choose to use/select to use the filter). This is the same filter on many of my other scripts so as not to
clutter up the chart with coins that have not been moving much. Hope it comes of some use to anyone.
Peace and love people...peace and love. -ChasinAlts

Performance Tablethis scrip is modified of Performance Table () of TradingView user @BeeHolder = Thank u very much.
-
@BeeHolder formula is based on daily basis,
but my calculation is based on respective day, week and month.
-
The formula of the calculation is (Current Close - Previous Close) * 100 / Previous Close, where Past value is:
1D = close 1 day before
5D = close 5 day before
1W - close 1 week before
4W = close 4 week before
1M - close 1 month before
3M - close 3 month before
6M - close 6 month before
12M - close 12 month before
52W - close 52 week before
Also table position cane be set.
thank you all
-

Crypto-DX Crypto Directional Index [chhslai]Crypto-DX can be used to help measure the overall strength and direction of the crypto market trend.
Furthermore, it can be used as a screener to find out cryptocurrencies which are accumulating momentum and tends to potentially pump or dump.
How this indicator works :
If the Crypto-DX cross above the zero-level, it could be an indication that there is a trend reversal into upward. You should close your short position or place a long order right away.
If the Crypto-DX cross below the zero-level, it could be an indication that there is a trend reversal into downward. You should close your long position or place a short order right away.
If the Crypto-DX is consolidated around the zero-level, it could be an indication that the trend may be ended and followed by a sideway market. You are suggested not to place any order and wait for the market moves.
Divergence based trading strategy is fully applicable, just like the MACD.
Screener features :
Plot "Crypto Index" and "5 Custom Crypto"
Plot "Crypto Index" and "Top 30 Crypto"

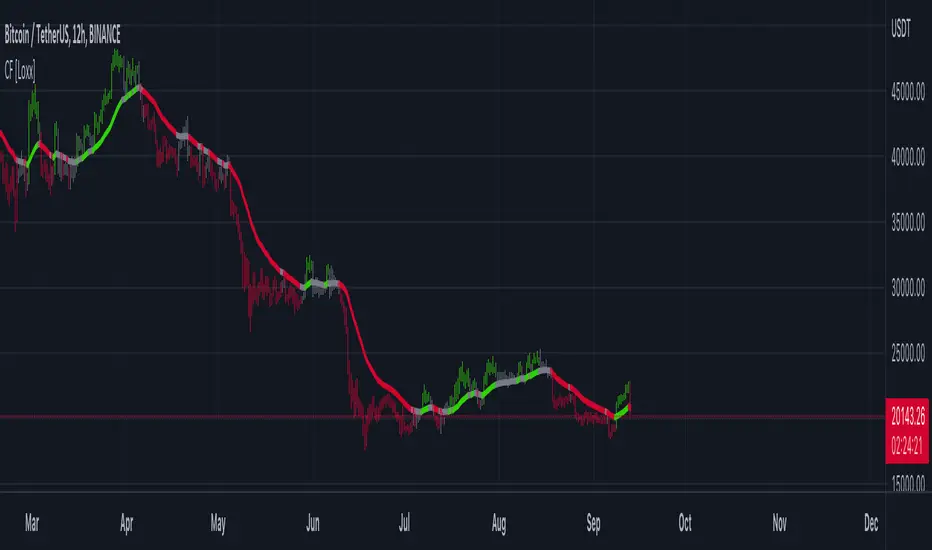
Clutter Fitler [Loxx]Clutter Fitler is a simple indicator to demonstrate a clutter filter. The purpose of this technique is to filter useless noise.
What is a Clutter Filter?
For our purposes here, this is a filter that compares the slope of the trading filter output to a threshold to determine whether to shift trends. If the slope is up but the slope doesn't exceed the threshold, then the color is gray and this indicates a chop zone. If the slope is down but the slope doesn't exceed the threshold, then the color is gray and this indicates a chop zone. Alternatively if either up or down slope exceeds the threshold then the trend turns green for up and red for down. Fro demonstration purposes, an EMA is used as the moving average. This filtering technique will be used for future indicators.
Included
Bar coloring
HMA Slope Variation [Loxx]HMA Slope Variation is an indicator that uses HMA moving average to calculate a slope that is then weighted to derive a signal.
The center line
The center line changes color depending on the value of the:
Slope
Signal line
Threshold
If the value is above a signal line (it is not visible on the chart) and the threshold is greater than the required, then the main trend becomes up. And reversed for the trend down.
Colors and style of the histogram
The colors and style of the histogram will be drawn if the value is at the right side, if the above described trend "agrees" with the value (above is green or below zero is red) and if the High is higher than the previous High or Low is lower than the previous low, then the according type of histogram is drawn.
What is the Hull Moving Average?
The Hull Moving Average ( HMA ) attempts to minimize the lag of a traditional moving average while retaining the smoothness of the moving average line. Developed by Alan Hull in 2005, this indicator makes use of weighted moving averages to prioritize more recent values and greatly reduce lag.
Included
Alets
Signals
Bar coloring
Loxx's Expanded Source Types
