Pivot Point Profile [LuxAlgo]The Pivot Point Profile indicator groups and displays data accumulated from previous pivot points, providing a comprehensive method for prioritizing and displaying areas of interest directly given by swing highs and lows.
Users have access to common settings present in other profile-type indicators.
🔶 USAGE
The Pivot Point Profile is particularly helpful in identifying highly active reversal zones that have been visited multiple times by price. Because of this, we could generally expect these areas to serve as future points of interest, often acting as support or resistance when re-visited.
The profile displays data associated with both Pivot Highs and Pivot Lows. Each row consists of pivot high and pivot low counts side-by-side, forming the total width of the row.
By analyzing the row as a whole, we can gain a better understanding of WHERE to look for interactions.
By analyzing the pivot counts independently, we can gain a better understanding of WHAT to expect when returning to these areas.
For example:
If a row in the profile contains entirely Pivot Lows, this could be seen as an indication to look for buyers to hold that level for a continuation upwards. A break of this level could be interpreted as a lack of interest from previous buyers at this level, indicating a further move down.
🔹 Concentrated Areas
Each row in the profile displays the current count of high pivots and low pivots within the selected lookback. The largest count for each pivot direction is identified as a "Concentrated Area (CA)", these CAs are highlighted over the chart with a line displaying the average of all pivots within that CA. The CA Average is the average of all pivot points (in the majority direction) within the given row.
These can hold more importance as potential support/resistance areas.
Note: The CA Threshold can be manually adjusted to highlight all rows based on a user-selected value.
🔶 DETAILS
🔹 Calculation
The idea behind the Pivot Point Profile is a new analysis method for pivot points, taking the idea of a volume profile and adapting it to display pivot points instead of volume. By using this data, in theory, we should be able to better prioritize zones to anticipate reversals, as well as identify key levels to watch for buyer & seller interactions to use as confirmations in direction.
The (vertical) width of each row is the product of the script's "Row Size", this is the number of rows that the profile will consist of. With a max of 250, the profile can be decently granular. That being said, A more granular profile will have fewer overlapping pivot points. By decreasing the row size (Using fewer rows in the profile) you will increase the tolerance for grouping pivot points. Potentially leading to a more comprehensive Profile. Inversely, By reducing the tolerance for grouping, you will better visualize only similar highs and lows but may have noisier data to sift through.
The Profile is calculated based on a "Lookback" parameter, using only the lookback amount of previous high and low pivots to calculate the profile. Configuring this parameter alongside "Pivot Length", will allow for great control over the frame of reference of the profile.
Note: This indicator is capable of utilizing the full chart history of pivot points, this can be done by enabling the "Use Full Chart History" setting, this will cause the script will calculate from everything it has access to on your current chart.
🔹 Display
The Pivot Point Profile display can be customized to fit a various range of chart styles and visual needs. The specific settings to adjust these can be located in the "Profile Display" Section of the User Inputs.
Profile Width: Sets the Left to Right Width of the Profile. This is the maximum width that the profile will occupy and will scale to fit within this width.
Profile Offset: Sets the distance of the Profile's Axis from the current chart candle. This moves the entire profile left and right to enable to user to set the distance between the profile and the current candle.
Direction: Changes the display direction of the profile, allowing for "Left", "Right", or "Center" display styles.
🔶 SETTINGS
🔹 Pivot Point Parameters
Pivot Type: Choose between "Fractal Pivots" or "SMC Structure" to use as the basis for pivots.
Length: Sets the length for the pivot calculations.
🔹 Profile Calculations Parameters
Lookback: Sets the number of pivots to calculate within, in increments of high and low pairs. (Setting this to 1 = 1 Pivot High & 1 Pivot Low)
Use Full Chart History: Disregards the set lookback and instead uses all available chart data to calculate from.
Row Size: Sets the total number of rows to calculate the profile with.
🔹 Profile Display
Profile Width: Sets the max left & right width (in bars) that the profile will occupy.
Profile Offset: Sets the distance of the profile axis from the last chart bar.
Direction: Sets the display direction
🔹 Concentrated Areas
Highlight CAs: Extends the rows left from concentrated areas.
CA Threshold: Manually set the threshold for determining concentrated areas, when disabled, only the largest rows will be displayed.
CA Averages: Toggles the concentrated area averages for each pivot direction.
Note: CA Averages can be displayed independently without CA Highlights being displayed, and vice versa.
Profile

Volume Positive & Negative Levels [ChartPrime]Volume Positive & Negative Levels
Overview:
The Volume Positive & Negative Levels indicator by ChartPrime is designed to provide traders with a clear visualization of volume activity across different price levels. By plotting volume levels as histograms, this tool helps identify significant areas of buying (positive volume) and selling (negative volume) pressure, enhancing the ability to spot potential support and resistance zones.
Key Features:
⯁ Lookback Period:
- The `lookbackPeriod` parameter, set to 500 bars, determines the range over which the volume analysis is conducted, ensuring a comprehensive view of the market’s volume activity. The maximum lookback period is 500 bars or the bars currently visible on the chart, whichever is smaller.
⯁ Dynamic Volume Calculation:
- Volume is calculated dynamically based on the price action, with positive volume indicating buying pressure (close > open) and negative volume indicating selling pressure (close < open).
⯁ Color Coding for Clarity:
- Positive Volume: Represented with a distinct color (`#ad9a2c`), making it easy to identify areas of buying interest.
- Negative Volume: Highlighted with another color (`#ad2cad`), simplifying the detection of selling pressure.
Volume Threshold and Bins:
- The indicator allows users to set a volume threshold (`volume_level`) to highlight significant volume levels, with the default set at 70.
- The number of bins (`numBins`) defines the granularity of the volume profile, with a higher number providing more detail.
⯁ Volume Profile Visualization:
- The volume profile is plotted as a histogram, with the height of each bar proportional to the volume at that price level. This visualization helps in quickly assessing the strength of volume at various price points.
⯁ Interactive Labels and Threshold Indicators:
- Labels: The indicator uses labels to mark significant volume levels, providing quick reference points for traders.
- Threshold Lines: Lines are drawn at specified volume thresholds, with colors and widths dynamically adjusted based on the volume levels.
⯁ User Inputs:
- Volume Threshold (`volume_level`): Sets the minimum volume required to highlight significant levels.
- Number of Bins (`numBins`): Determines the resolution of the volume profile.
- Line Width (`line_withd`): Specifies the width of the lines used in the visualization.
The Volume Positive & Negative Levels indicator is a powerful tool for traders looking to gain deeper insights into market dynamics. By providing a clear visual representation of volume activity across different price levels, it helps traders identify key support and resistance zones, spot trends, and make more informed trading decisions. Whether you are a day trader or a swing trader, this indicator enhances your ability to analyze volume data effectively, improving your overall trading strategy.

Open Liquidity Heatmap [BigBeluga]Open Liquidity Heatmap is an indicator designed to display accumulated resting liquidity on the chart.
Unlike any other liquidity heatmap, this aims to accumulate liquidity at specific levels that build up over time, showing larger areas of liquidity.
🔶 FEATURES
The indicator includes the following settings:
Lookback : Used to determine the range calculation of the heatmap.
Leverage : Leverage of the liquidation (Counted as % in price, Example: 4.5 will return a distance from price of 4.5%, indicating any possible resting liquidity in this range).
Levels : Amount of levels to display (Each level is counted as liquidity resting on the chart; fewer levels will return a bigger area of liquidity sitting on the chart).
Mode : Apply a color gradient from the minimum liquidation to the maximum liquidity level. Set the maximum color gradient value (Counted as volume).
Offset : Automatically determine the offset range of the Volume Profiles. Manual offset of the Volume Profiles.
🔶 CALCULATION
for i = 0 to step - 1
float plotter = na
switch i
0 =>
plotter := hs
=>
plotter := hs - diff * ( i )
cls.hm.gnL(plotter)
cls.vp.put(plotter, 0)
We calculate levels like a normal volume profile with steps, from the highest point within the lookback to the lowest one. Each level will contain the corresponding amount of volume that the candle has closed in that range.
As we can see in the image above, we add liquidity each time the distance in % from price is between two levels.
Unlike many liquidity indicators that provide a single candle liquidity heatmap, this aims to add up liquidity (volume) in already present levels.
This can be extremely useful to see which levels are likely to be more liquid and tend to get a bigger reaction to the price.
Imagine it like a range of levels that each time price revisits that area, a new position area is added; we add volume in that area each time price visits that zone. Liquidity builds up in those zones, causing a bigger reaction to the price once the price visits it.
This indicator is not the same as a single candle heatmap like many others. What is a single candle heatmap?
A single candle heatmap is when a level is created on every new candle, coloring the level based on the total volume of it.
This indicator, on the contrary, aims to provide a more specific use by adding up liquidity each time price visits it.
🔶 BASIC DEMOSTRATION
This is a basic demonstration of how we can spot high liquidity points overall using confluence:
We see the POC of the liquidation in a low volume area of the normal volume profile adding up as confluence.
Resistance from the POC Volume Profile suggesting price will go lower.
Major long open liquidity down.
As we can see, price takes out all the long liquidity and right after pumping, indicating that all the major liquidity got taken out.
Some key note to take is that a POC in the liquidation heatmap in a low volume area of the normal Volume Profile add confluence of a possible big reaction in that zone.
In the forex market, we suggest to use a low distance from price (Leverage) while in a crypto market you can use the one that fit the best the current timeframe.
🔶 CONCLUSION
This indicator aims to show open resting liquidity that had built up over time, showing the most amount of liquidation in specific areas in an aggregated way unlike many liquidation heatmap indicators that show single-level liquidation.
🔶 RELATED SCRIPT

Volume Footprint Voids [BigBeluga]Volume Footprint Voids is a unique tool that uses lower timeframe calculation to plot different styles of single candle POC.
This indicator is very powerful for scalping and finding very precise entry and exits, spotting potential trapped traders, and more.
Unlike many other volume profiles, this aims to plot single candle profiles as well as their own footprints.
🔶 FEATURES
The script includes the following settings:
Windows: Plotting style and calculations
Coloring modes
Display modes
lower-timeframe calculations
🔶 CALCULATION
In the image above we can see how the script calculates each level position that will serve as a calculation process to see how much volume/closes there are within the levels.
In the image above, we can have a more clear example of how we count each candle close.
We use the prior screenshot as an example, after setting each level we will use the lower-timeframe input to measure the amount of closes within the ranges.
Depending on the lot size, the box will be larger or smaller, usually the POC will always have the highest box size.
NOTE: Size is the starting point, always from the low of the candle.
To find more voids, select a closer LTF to the current one you're using.
To find fewer voids, select a timeframe away from your current one.
Due to Pine Script limitations, we are only able to plot a certain amount of footprints, and we can't plot the whole history chart.
POC will be the largest block displayed, indicating the time point of control
Gray areas are closes above the average
Black are Void or imbalance that price will fill in the future, like FVG
The image above shows an incorrect size input that will lead to bad calculations, while on the other side, a correct size input that will lead to a clear vision and better calculation.
🔶 WINDOWS
The "▲▼" Mode will display delta buyers and delta sellers coloring with voids as black.
It also offers a gradient mode for a beautier visualization
The "Total Volume" mode will display the net volume within the lot size (closes within the levels).
This is useful to spot possible highest net volume within the same highest lot size.
The "POC + Gaps" will show both POC and Gaps as the highest block while all the rest will be considered as the smaller block.
This is useful to see where the highest lot were and if there are higher or lower imbalances within the candle
The last option "Gaps" will simply display the gaps as the highest block, while the POC as the lowest block.
This is useful to have a better view of the gaps areas
🔶 EXAMPLE
This is one of the most basic examples of how this script can be used. POC at the bottom creating a strong support area as price holds and creates higher voids gap that price fills while rising.
🔶 SETTINGS
Users have full control over the script, from colors to choosing the lower-timeframe inputs to disabling the lot size.

Intraday Volume Profile [BigBeluga]The Intraday Volume Profile aims to show delta volume on lower timeframes to spot trapped shorts at the bottom or trapped longs at the top, with buyers pushing the price up at the bottom and sellers at the top acting as resistance.
🔶 FEATURES
The indicator includes the following features:
LTF Delta precision (timeframe)
Sensibility color - adjust gradient color sensitivity
Source - source of the candle to use as the main delta calculation
Color mode - display delta coloring in different ways
🔶 DELTA EXAMPLE
In the image above, we can see how delta is created.
If delta is positive, we know that buyers have control over sellers, while if delta is negative, we know sellers have control over buyers.
Using this data, we can spot interesting trades and identify trapped individuals within the candle.
🔶 HOW TO USE
In the image above, we can see how shorts are trapped at the bottom of the wick (red + at the bottom), leading to a pump also called a "short squeeze."
Same example as before, but with trapped longs (blue + at the top).
This can also work as basic support and resistance, for example, trapped shorts at the bottom with positive delta at the bottom acting as strong support for price.
Users can have the option to also display delta data within the corresponding levels, showing Buyers vs Sellers for more precise trading ideas.
NOTE:
User can only display the most recent data for the last 8 buyers and sellers.
It is recommended to use a hollow candle while using this script.

Volume Profile PlusThis indicator provides a high-resolution and high-precision implementation of Volume Profile with flexible range settings. Its key features include:
1. Support for a high resolution of up to 2,500 rows.
2. Capability to examine lower timeframe bars (default 5,000 intra-bars) for enhanced precision.
3. Three range modes — "Visible Range", "Anchored Range", and "All Range".
4. Highlighting of Point of Control and Value Area.
5. Extensive customization options allowing users to configure dimensions, on-chart placements, and color schemes.
🔵 Settings
The settings screen, along with the explanations for each setting, is provided below:
🔵 High Resolution using Polyline
Inspired by @fikira, this indicator utilizes the newly introduced `polyline` type in PineScript to plot the volume profile. It employs a single polyline instance to represent the entire histogram. With each polyline instance supporting up to 10,000 points and each histogram row requiring 4 points, this indicator can accommodate 2500 rows, resulting in a significantly higher resolution compared to conventional volume profile indicators that use `line`s or `box`es to draw the histogram.
🔵 High Precision Data-binning using Lower Timeframe Data
Conventional volume profile indicators often face one or both of the following limitations:
1. They only consider volume within the chart's current timeframe.
2. They assign each bar's total volume to a single price bucket based on the bar's average price, rather than distributing volume across multiple price buckets.
As a result, when the number of bars in the chart is low, those indicators may provide imprecise results, making it difficult to accurately identify significant volume nodes and the point of control.
To address these limitations and enhance accuracy, this indicator examines data from lower timeframes and distributes the volume to fine-grained price buckets. It intelligently selects an appropriate lower timeframe to ensure precise output while complying with a maximum specified number of bars to maintain good performance.
🔵 Three Range Modes
This indicator offers users the flexibility to choose from three range modes:
1. Visible Range (Default Mode): In this mode, the volume profile calculation begins at the time of the left-most bar displayed in the current viewport. As the user scrolls through the viewport, the volume profile updates automatically.
2. Anchored Range: This mode allows the user to set the start time either by using the datetime input boxes or by dragging the anchor line on the chart.
3. All Range: In this mode, the volume profile calculation is based on all the historical bars available in the chart.

Heat profileA trader once told me that top wicks equals sell interest and bottom wicks equals buy interest. If that's true then this indicator tries to organize and visualize this idea.
It uses transparent boxes to give the impression of a heat map. Due to limitations of my own skill and possibly pinescript it is not possible to render it in a useful manner using different colors that depicts buy and sell interests respectively. This means it works more like a volume profile in that it mixes the buy and sell interest together in the heat map. This can still be helpful because it help traders focus their attention on areas other than the current price candle.
In my limited time of using it, it seems like on the large timeframes the highlighted areas is where the price wants to go, and on small time frames the darkest areas is where the price wants to go. But i will leave it up to any user to spot and use their own patterns with the indicator.
Last but not least, the indicator only uses the last 50 candles, which can be too little on a small timeframe. Unfortunately the way i have done it this limitation is hardcoded in the script due to how pinescript works, by editing the code you can increase it. (Put max_boxes_count = x after overlay = true. Maximum number is 500)
Hope you enjoy. Have a nice day.

OI Visible Range Ladder [Kioseff Trading]Hello!
This Script “OI Visible Range Ladder” calculates open interest profiles for the visible range alongside an OI ladder for the visible period!
Features
OI Profile Anchored to Visible Range
OI Ladder Anchored to Visible Range
Standard POC and Value Area Lines, in Addition to Separated POCs and Value Area Lines for each category of OI x Price
Configurable Value Area Targets
Curved Profiles
Up to 9999 Profile Rows per Visible Range
Stylistic Options for Profiles
Up to 9999 volume profile levels (Price levels) can be calculated for each profile, thanks to the new polyline feature, allowing for less aggregation / more precision of open interest at price.
The image above shows primary functionality!
Green profiles = Up OI / Up Price
Yellow profiles = Down OI / Up Price
Purple profiles = Up OI / Down Price
Red profiles = Down OI / Down Price
The image above shows POCs for each OI x Price category!
Profiles can be anchored on the left side for a more traditional look.
The indicator is robust enough to calculate on “small price periods”, or for a price period spanning your entire chart fully zoomed out!
That’s about it :D
This indicator is Part of a series titled “Bull vs. Bear” - a suite of profile-like indicators.
Thanks for checking this out!
If you have any suggestions please feel free to share!

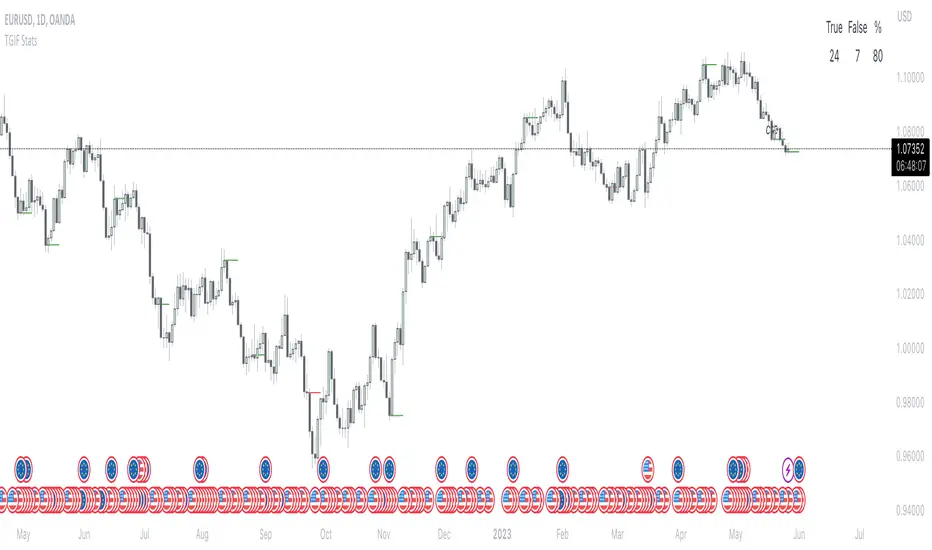
TGIF StatsTGIF - "Thank God it's Friday"
After a heavily bearish week (tuesday, wednesday and thursday) price sometimes looks for some retracement on fridays. Vice versa for bullish weeks.
This script shows how often that specific scenario happens and displays that data in a table.
The user has the option to input a starting year for the statistic and is able to filter between bearish or bullish weeks.
*disclaimer : if paired with a higher timeframe pd array taught by ICT the stats should be better, that's not included in the code though*
⚠️ Open Source ⚠️
Coders and TV users are authorized to copy this code base, but a paid distribution is prohibited. A mention to the original author is expected, and appreciated.
⚠️ Terms and Conditions ⚠️
This financial tool is for educational purposes only and not financial advice. Users assume responsibility for decisions made based on the tool's information. Past performance doesn't guarantee future results. By using this tool, users agree to these terms.
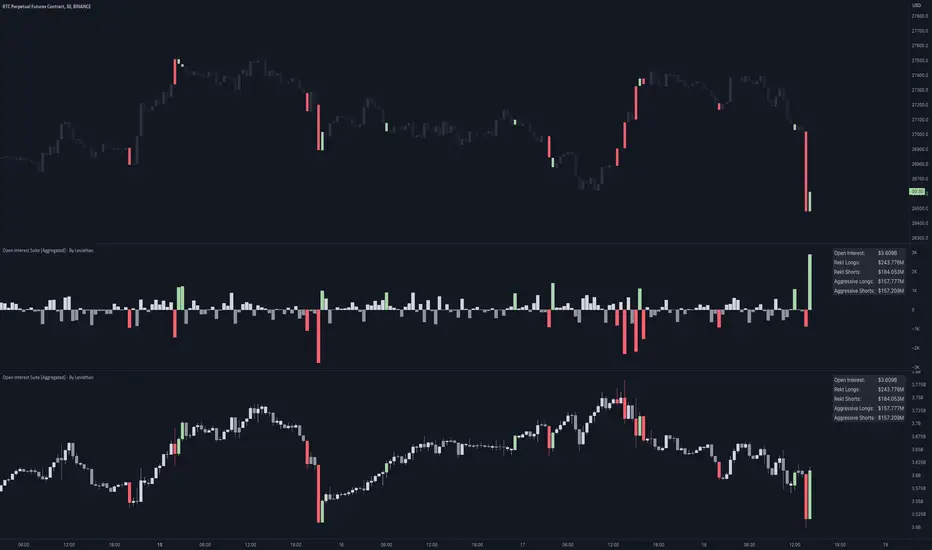
Open Interest Suite [Aggregated] - By LeviathanThis script is an all-in-one indicator that uses aggregated Open Interest data to plot OI candles, Open Interest Delta, OI x rVOL, and OI RSI. It also includes tools such as an OI Distribution profile, large OI increase/decrease coloring, a Stats Screener, and much more.
You can select and have the script plot the following:
- Open Interest in the form of OHLC candles
- Open Interest Delta in the form of a histogram
- Open Interest x Relative Volume in the form of a histogram
- Open Interest RSI in the form of a line
Additional features include:
- OI Distribution Profile (It shows the distribution of open interest in the visible range on y axis. This makes it easier to identify when Open Interest is relatively high or low and at which values most of the action took place)
- Stats screener (The screener includes the real-time net Open Interest value, Rekt Longs/Rekt Shorts based on large OI decreases and Aggressive Longs/Shorts based on large OI increases)
- Coloring (You can color OI Delta nodes, background and chart candles based on large OI increases/decreases)
- more
Instructions for the settings will be provided in the tooltips shortly.
Full credit goes to @KioseffTrading for the profile generation code.
Open Interest Profile [Fixed Range] - By LeviathanThis script generates an aggregated Open Interest profile for any user-selected range and provides several other features and tools, such as OI Delta Profile, Positive Delta Levels, OI Heatmap, Range Levels, OIWAP, POC and much more.
The indicator will help you find levels of interest based on where other market participants are opening and closing their positions. This provides a deeper insight into market activity and serves as a foundation for various different trading strategies (trapped traders, supply and demand, support and resistance, liquidity gaps, imbalances,liquidation levels, etc). Additionally, this indicator can be used in conjunction with other tools such as Volume Profile.
Open Interest (OI) is a key metric in derivatives markets that refers to the total number of unsettled or open contracts. A contract is a mutual agreement between two parties to buy or sell an underlying asset at a predetermined price. Each contract consists of a long side and a short side, with one party consenting to buy (long) and the other agreeing to sell (short). The party holding the long position will profit from an increase in the asset's price, while the one holding the short position will profit from the price decline. Every long position opened requires a corresponding short position by another market participant, and vice versa. Although there might be an imbalance in the number of accounts or traders holding long and short contracts, the net value of positions held on each side remains balanced at a 1:1 ratio. For instance, an Open Interest of 100 BTC implies that there are currently 100 BTC worth of longs and 100 BTC worth of shorts open in the market. There might be more traders on one side holding smaller positions, and fewer on the other side with larger positions, but the net value of positions on both sides is equivalent - 100 BTC in longs and 100 BTC in shorts (1:1). Consider a scenario where a trader decides to open a long position for 1 BTC at a price of $30k. For this long order to be executed, a counterparty must take the opposite side of the contract by placing a short order for 1 BTC at the same price of $30k. When both long and short orders are matched and executed, the Open Interest increases by 1 BTC, indicating the introduction of this new contract to the market.
The meaning of fluctuations in Open Interest:
- OI Increase - signifies new positions entering the market (both longs and shorts).
- OI Decrease - indicates positions exiting the market (both longs and shorts).
- OI Flat - represents no change in open positions due to low activity or a large number of contract transfers (contracts changing hands instead of being closed).
Typically, we monitor Open Interest in the form of its running value, either on a chart or through OI Delta histograms that depict the net change in OI for each price bar. This indicator enhances Open Interest analysis by illustrating the distribution of changes in OI on the price axis rather than the time axis (akin to Volume Profiles). While Volume Profile displays the volume that occurred at a given price level, the Open Interest Profile offers insight into where traders were opening and closing their positions.
How to use the indicator?
1. Add the script to your chart
2. A prompt will appear, asking you to select the “Start Time” (start of the range) and the “End Time” (end of the range) by clicking anywhere on your chart.
3. Within a few seconds, a profile will be generated. If you wish to alter the selected range, you can drag the "Start Time" and "End Time" markers accordingly.
4. Enjoy the script and feel free to explore all the settings.
To learn more about each input in indicator settings, please read the provided tooltips. These can be accessed by hovering over or clicking on the ( i ) symbol next to the input.

Tick Profile HeatmapThis is a market internal TICK heatmap with the intent of displaying areas of price associated to stronger reactions with NYSE TICK (by default).
This code is based off of a variation of a Volume Profile coded originally by colejustice who originally used code from LuxAlgo . The full-width volume bars that colejustice setup were replaced with full-width bars representative of TICK breaking +/- $500, the current cumulative value representing the "heat" is comprised of hlc3 by default but that can be changed. In a future update I may add additional logic here to capture highs and lows in the heatmap specifically, and perhaps additional colors.
As with other traditional profiling studies, this indicators purpose is to visualize correspondence to specific price levels, allowing rapid assessment where the most TICK activity is occurring, and where it hasn't been. This information may provide areas of support and resistance and regions where price may move quickly repeatedly.
All of the same input guidance that colejustice provided is the same for those pre-existing inputs:
Inputs are set up such that you can customize the lookback period, number of rows, and width of rows for most major timeframes individually. Timeframes between those available will use the next lower timeframe settings (e.g., 2m chart will use the 1m settings.)
Zero usage of volume is present in this indicator, only TICK data so please don't confuse it with volume studies.

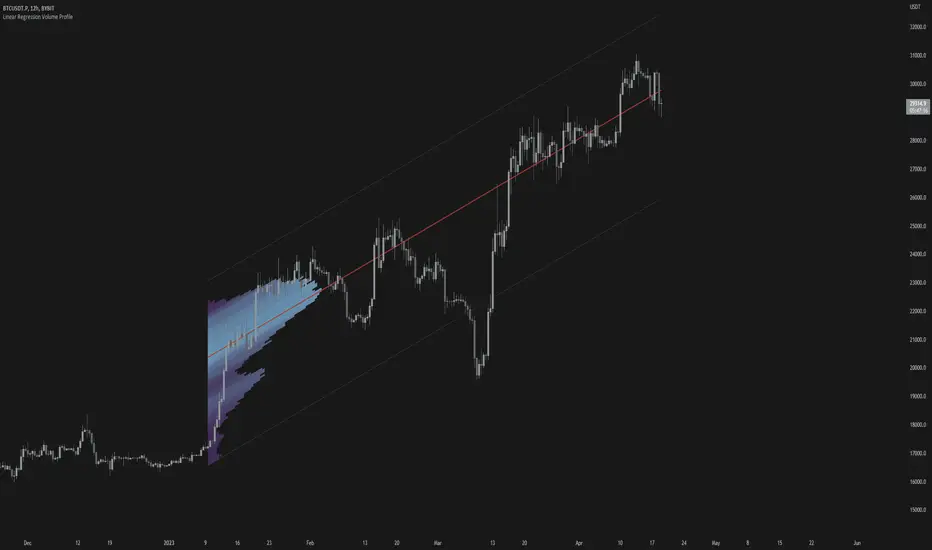
Linear Regression Volume ProfileLinear Regression Volume Profile plots the volume profile fixated on the linear regression of the lookback period rather than statically across y = 0. This helps identify potential support and resistance inside of the price channel.
Settings
Linear Regression
Linear Regression Source: the price source in which to sample when calculating the linear regression
Length: the number of bars to sample when calculating the linear regression
Deviation: the number of standard deviations away from the linear regression line to draw the upper and lower bounds
Linear Regression
Rows: the number of rows to divide the linear regression channel into when calculating the volume profile
Show Point of Control: toggle whether or not to plot the level with highest amount of volume
Usage
Similar to the traditional Linear Regression and Volume Profile this indicator is mainly to determine levels of support and resistance. One may interpret a level with high volume (i.e. point of control) to be a potential reversal point.
Details
This indicator first calculates the linear regression of the specified lookback period and, subsequently, the upper and lower bound of the linear regression channel. It then divides this channel by the specified number of rows and sums the volume that occurs in each row. The volume profile is scaled to the min and max volume.
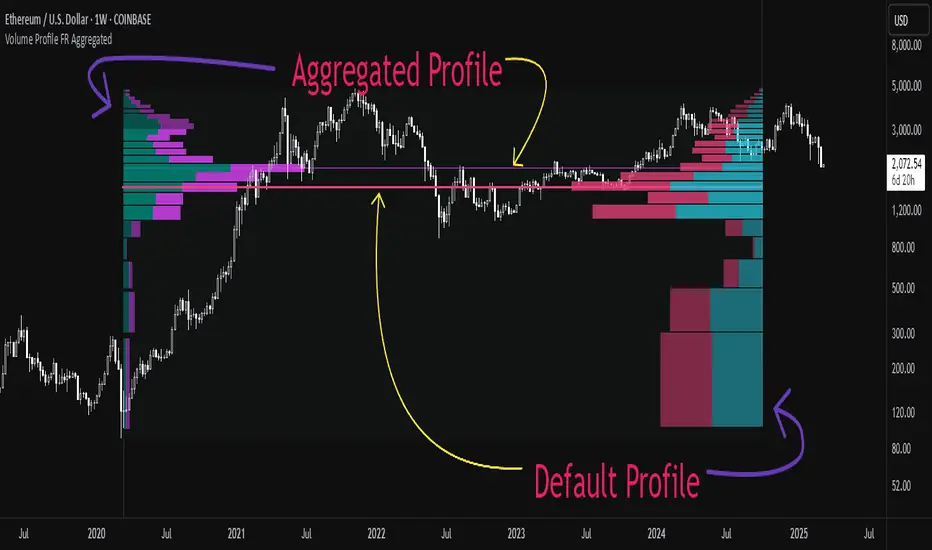
Aggregated Volume Profile Spot & Futures ⚉ OVERVIEW ⚉
Aggregate Volume Profile - Shows the Volume Profile from 9 exchanges. Works on almost all CRYPTO Tickers!
You can enter your own desired exchanges, on/off any others, as well as select the sources of SPOT, FUTURES and others.
The script also includes several input parameters that allow the user to control which exchanges and currencies are included in the aggregated data.
The user can also choose how volume is displayed (in assets, U.S. dollars or euros) and how it is calculated (sum, average, median, or dispersion).
WARNING Indicator is for CRYPTO ONLY.
______________________
⚉ SETTINGS ⚉
‾‾‾‾‾‾‾‾‾‾‾‾‾‾‾‾‾‾‾‾‾‾
Data Type — Choose Single or Aggregated data.
• Single — Show only current Volume.
• Aggregated — Show Aggregated Volume.
Volume By — You can also select how the volume is displayed.
• COIN — Volume in Actives.
• USD — Volume in United Stated Dollar.
• EUR — Volume in European Union.
• RUB — Volume in Russian Ruble.
Calculate By — Choose how Aggregated Volume it is calculated.
• SUM — This displays the total volume from all sources.
• AVG — This displays the average price of the volume from all sources.
• MEDIAN — This displays the median volume from all sources.
• VARIANCE — This displays the variance of the volume from all sources.
• Delta Type — Select the Volume Profile type.
• Bullish — Shows the volume of buyers.
• Bearish — Shows the volume of sellers.
• Both — Shows the total volume of buyers and sellers.
Additional features
The remaining functions are responsible for the visual part of the Volume Profile and are intuitive and I recommend that you familiarize yourself with them simply by using them.
________________
⚉ NOTES ⚉
‾‾‾‾‾‾‾‾‾‾‾‾‾‾‾‾
If you have any ideas what to add to my work to add more sources or make calculations cooler, suggest in DM .
Also I recommend exploring and trying out my similar work.
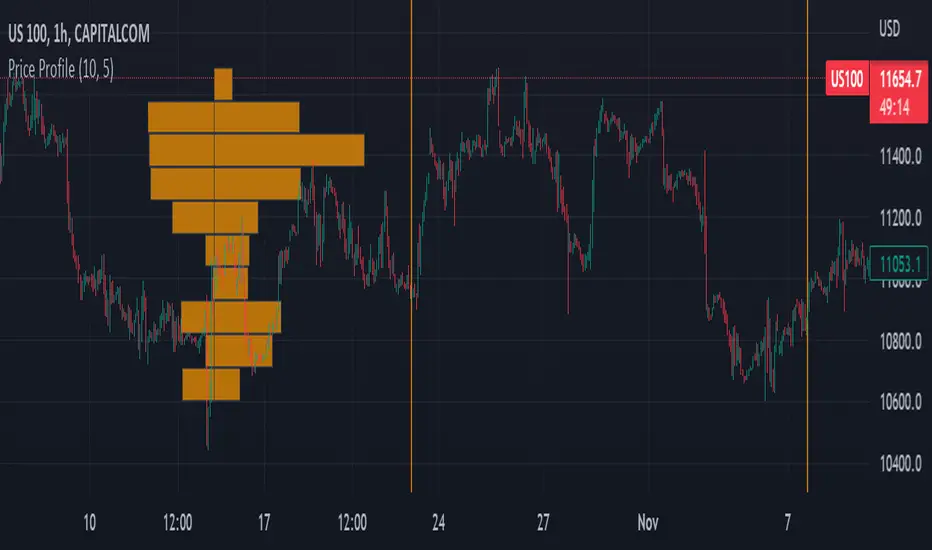
Price ProfileThe indicator shows number of candles present in the horizontal box areas for the given time window. You can set up:
1) Start time
2) Stop time
3) Number of horizontal bars
Visible Range Mean Deviation Histogram [LuxAlgo]This script displays a histogram from the mean and standard deviation of the visible price values on the chart. Bin counting is done relative to high/low prices instead of counting the price values within each bin, returning a smoother histogram as a result.
Settings
Bins Per Side: Number of bins computed above and below the price mean
Deviation Multiplier: Standard deviation multiplier
Style
Relative: Determines whether the bins length is relative to the maximum bin count, with a length controlled with the width settings to the left.
Bin Colors: Bin/POC Lines colors
Show POCs: Shows point of controls
Usage
Histograms are generally used to estimate the underlying distribution of a series of observations, their construction is generally done taking into account the overall price range.
The proposed histogram construct N intervals above*below the mean of the visible price, with each interval having a size of: σ × Mult / N , where σ is the standard deviation and N the number of Bins per side and is determined by the user. The standard deviation multipliers are highlighted at the left side of each bin.
A high bin count reflects a higher series of observations laying within that specific interval, this can be useful to highlight ranging price areas.
POCs highlight the most significant bins and can be used as potential support/resistances.

.srb suiteThe essential suite Indicator.
that are well integrated to ensure visibility of essential items for trading.
it is very cumbersome to put symbol in the Tradingview chart and combine essential individual indicators one by one.
Moreover even with such a combination, the chart is messy and visibility is not good.
This is because each indicator is not designed with the others in mind.
This suite was developed as a composite-solution to that situation, and will make you happy.
designed to work in the same pane with open-source indicator by default.
Recommended visual order ; Back = .srb suite, Front = .srb suite vol & info
individually turn on/off only what you need on the screen.
BTC-agg. Volume
4 BTC-spot & 4 BTC-PERP volume aggregated.
It might helps you don't miss out on important volume flows.
Weighted to spot trading volume when using PERP+spot volume .
If enabled, BTC-agg.Vol automatically applied when selecting BTC-pair.
--> This is used in calculations involving volumes, such as VWAP.
Moving Average
1 x JMA trend ribbon ; Accurately follow short-term trend changes.
3 x EMA ribbon ; zone , not the line.
MA extension line ; It provide high visibility to recognize the direction of the MA.
SPECIAL TOOLS
VWAP with Standard Deviation Bands
VWAP ruler
BB regular (Dev. 2.0, 2.5)
BB Extented (Dev. 2.5, 3.0, 3.5)
Fixed Range Volume Profile ; steamlined one, performace tuned & update.
SPECIAL TOOLS - Auto Fibonacci Retracement - New GUI
'built-in auto FBR ' has been re-born
It shows - retracement Max top/ min bottom ; for higher visibility
It shows - current retracement position ; for higher visibility
The display of the Fib position that exceeds the regular range is auto-determined according to the price.
tradingview | chart setting > Appearance > Top margin 0%, Bottom margin 0% for optimized screen usage
tradingview | chart setting > Appearance > Right margin 57
.srb suite vol & info --> Visual Order > Bring to Front
.srb suite vol & info --> Pin to scale > No scale (Full-screen)
Visual order ; Back = .srb suite, Front = .srb suite vol & info
1. Fib.Retracement core is from tradingview built-in FBR ---> upgrade new-type GUI, and performance tuned.
2. Fixed-range volume-profile core is from the open-source one ---> some update & perf.tuned.
---------------------------------------------------------------------------------------------------------------------------------------
if you have any questions freely contact to me by message on tradingview.
but please understand that responses may be quite late.
Special thanks to all of contributors of community.
The script may be freely distributed under the MIT license.

Naked Intrabar POCThis indicator with an unfortunate and very non PC sounding name approximates (!) the intrabar point of control (POC) either from time or volume at price.
Due to pine limitations, bin size and the sample lower time frame selection will have at least some effect on the accuracy of the approximation. The trade off is between accuracy and historical availability, however bar replay can be used to view prior historical states beyond what is visible from the current real time bar.
In order for all intrabar POC circles to be visible, you will need to manually set the visual order of the indicator by bringing it to the front.
Since the POC represents a price point around which the highest market participation occurred, the exposed global variable intrabar_poc may (or may not) be interesting as an alternative to ohlc based source input.

Session TPO Market ProfileIntroduction
Wikipedia: A Market Profile is an intra-day charting technique (price vertical, time/activity horizontal) devised by J. Peter Steidlmayer, a trader at the Chicago Board of Trade (CBOT), ca 1959-1985. Steidlmayer was seeking a way to determine and to evaluate market value as it developed in the day time frame. The concept was to display price on a vertical axis against time on the horizontal, and the ensuing graphic generally is a bell shape--fatter at the middle prices, with activity trailing off and volume diminished at the extreme higher and lower prices. In this structure he recognized the 'normal', Gaussian distribution he had been introduced to in college statistics.
Important : The market profile tool is designed to be used on the 30min timeframe, however, you can modify its parameters and use it on lower timeframes (15/10/5min)
This indicators displays the following information
Session open
TPO
Value area calculation zone
POC
Highlight of Single prints
Session High/Low
The current price (TPO Profile is often used isolated without any candlesticks on it)
Parameters
Session beginning configuration (not coded with a session input yet)
Number of candles to use for calculation (default 13 for a single session)
Extend yesterday's levels (VAH/VAL/POC)
Show/Hide Market profile calculation area (background color)
Bars number (number of rows that will be used to draw the profile)
Show/Hide TPO's
TPO Colors customization (For in/out of VA, VAL/VAH/POC/High/Low levels and single prints)
Show/Hide High/Low levels
Show/Hide VAL/VAH/POC Levels as lines
Enable/Disable Single prints highlighting
Value area size (as percent)
Show/Hide current price (corresponding to a line scaled on the "close" price)
Additional Notes
Each session is drawn when the day is over
To use as much space as possible, TPO's are not directly drawn on the area of their calculation (which can be confusing if you use candlesticks directly over it)
This script will probably be updated in the future (especially concerning its implementation which is a bit spaghetti coded for now) .
If you have interesting suggestions about new features that are usual within market profile tools and missing from this script , don't hesitate to suggest it.

Market Profile Fixed ViewSome instruments does not provide any volume information, therefore, as a fixed volume profile user, I needed a fixed market profile indicator to use the same principles, regardless of whether the volumes are available or not.
This script draws a market profile histogram corresponding to price variations within a specific duration, you only need to specify Start and End date/time values to see the histogram on your chart.
Details
Two lines corresponding to highest/lowest prices are displayed around the histogram
The redline corresponds to the POC (point of control)
Options
Start calculation
End calculation
Bars number (histogram resolution, currently locked to a max value of 50 bars)
Display side/Width (allows to modify size of bars, to the left or to the right)
Bars/Borders/POC Color customization
Notes
This script will probably be updated (to add VAH/VAL zones, and maybe other options). However, some common market profile attributes have not been implemented yet since I don't really use them)

Market Profile Visible RangeSup TV, 2 important points .
1) surprisingly, it's the first MP Visible Range script on TV;
2) This one doesn't use any bagging/binning*, instead each row represents the time spent on the actual minimal price steps (aka ticks).
The script will be further extended with usual market profile related functionally in future updates. At this point we have:
- Profile itself (each row represents how many bars touch the given price);
- Mode of the profile (called POC)**;
* Still it will be introduced in future when I will find / design the proper aggregating technique. It is vital for processing very wide price ranges (for example, 500 days on ES futures).
** The script correctly calculates POC by finding all the modes in the data & choosing the closest one to data's midrange.
For this kind of technical instrument finally it was more convenient to use Pine Script 5 (btw it's my first Pine 5).
Basically this script is a side-effect of another R&D I'm doing, the stuff is useful tho so let's go.
By choosing length we both specify the amount of data to be processed & the profile's location screen-wise. It's pretty cool and & useful, on my screen it's always almost touching the left side and still always visible.
The code is heavily commented in order to be understood fast, nothing fantastic, just a lil patience required this time.
Rationale
Market & volume profiles are well known concepts, lotta info available, the most important point of all that is that MP is just another way of visualizing data that lets you notice things you don't usually notice on sequential charts. From my side I can only add that it's better to use your own brain for thinking and reconsidering using volume profile in all the cases, especially on decentralized markets (unless you're aggregating ALL the volume data from everywhere, including options, OTC etc).
Here is it, for you

CDOI ProfileCumulative Delta of Open Interest Profile
This script lets you visualize where there were Open Interest build-ups and discharges on a price basis.
It only supports pairs where TradingView added the appropriate Open Interest data (at the time of posting that is only Binance and Kraken perpetual contracts)
The script uses my own functions to poll lower timeframe data and compile it into a higher timeframe profile. And as such, it needs some tweaking to adjust it to your timeframe until Tradingview lets me do it codewise (hopefully one day)
The instructions for using the Indicators are as follows:
Condition: How often a new profile should be generated
Sampling Rate and 1/Nth of the TF: These have to be calculated together to have a product that should correspond to the current timeframe in minutes. A few examples below
----------- Sampling - 1Nth of the TF
5 min ------- 5 --------------- 1
10 min ------ 10 ------------- 1
15 min ------ 5 --------------- 3
20 min ------ 10 ------------- 2
30 min ------ 10 -------------- 3
45 min ------- 9 -------------- 5
1 hour ------- 10 ------------- 6
4 hours ----- 10 -------------- 24
1 day -------- 10 ------------- 144
Transparency: This one is pretty self-explanatory but only applies to the Profile bars
% change for a bar: This one indicates how precise each bar will be, but if you go too low the script becomes too heavy and stop running
Bar limit: Limits the amounts of bars the script is run for (ae for the last 1000 bars). Lower = faster loading, too high will stop running
UI color: Color and transparency of the center line and the box surrounding the whole profile

Swing Assassin's Consolidated ScriptI put this script together to essentially consolidate a number of scripts that I use on a daily basis into one script. This is an ongoing improvement effort, so there may be some garbage in here right now so keep that in mind if you intend to use this to help in your trading.
There are 5 moving averages (Hull). I use the Fast, Mid and Slow to find entries after I us the Medium Slow and Super Slow to identify a trend. Otherwise, I have those three turned off.
This script also uses Bollinger Bands which I literally cannot trade without.
The script also has anchored VWAP , automated support/resistance lines, and a homebrewed Volume Profile that is a copy from Ildar Akhmetgaleev's indicator "Poor Man's Volume Profile" used under Mozilla Public License Version 2.0.
