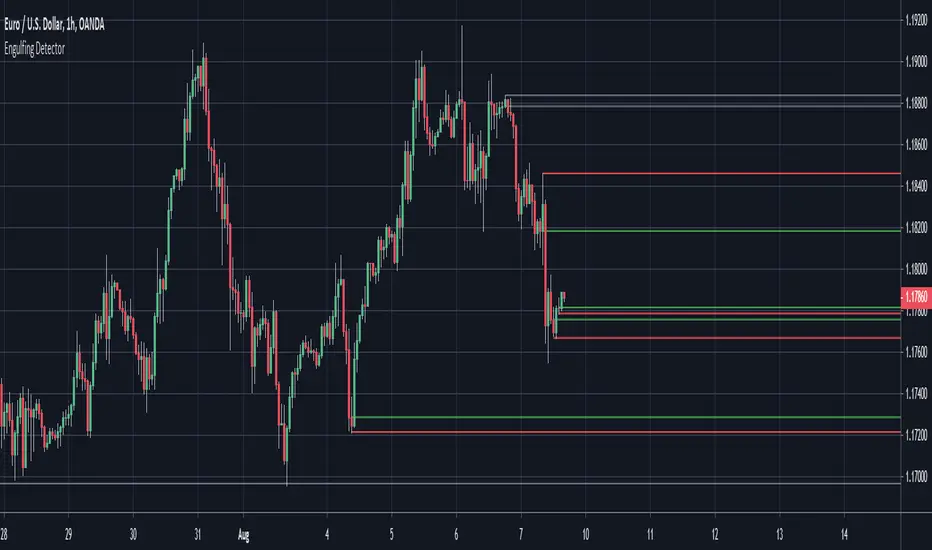
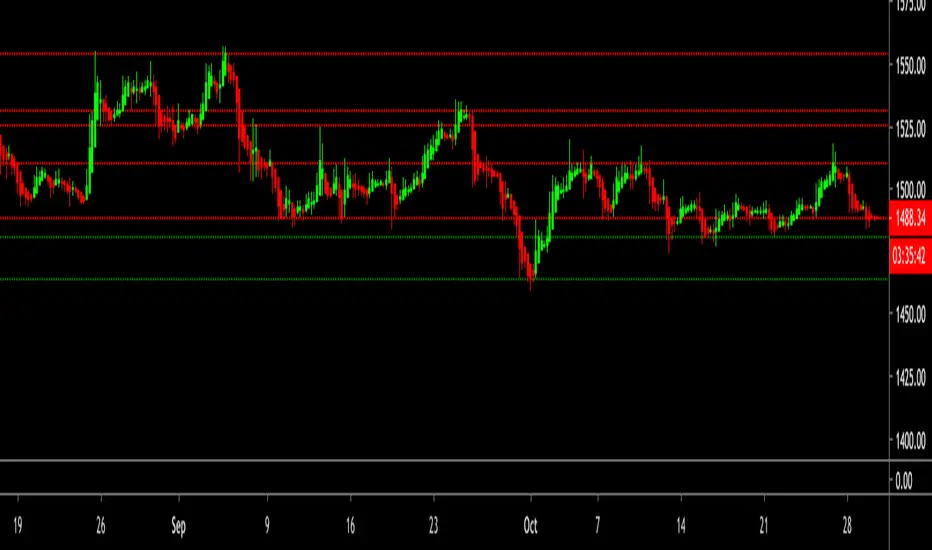
Engulfing Detector (Supply and Demand)Bullish and bearish engulfing candles marked with horizontal lines around engulfed candle.
This indicator can be used to assist in locating potential supply and demand zones.
The fresh zones will be of green and red line colors and the tested zone lines are grey in color.
프라이스 볼륨 트렌드 (PVT)
TurnOver Rate 换手率What does the turnover rate mean?
1. The higher the stock’s turnover rate, the more active the stock’s trading and the higher people’s willingness to buy the stock, which is a popular stock; conversely, the lower the stock’s turnover rate, it means the stock few people pay attention to it, which is an unpopular stock.
2. A high turnover rate generally means that the stock has good liquidity, and it is easier to enter and exit the market. There will be no phenomenon of wanting to buy or want to sell, and it has strong liquidity. However, it is worth noting that stocks with a high turnover rate are often the target of short-term funds chasing. They are highly speculative, their stock prices fluctuate, and risks are relatively high.
3. The high turnover rate at the beginning of the IPO is a natural thing. The myth of undefeated IPOs was once staged. However, with the changes in the market, it has become a reality for new shares to go high and low after the listing. Obviously, there is no conclusion that a high turnover rate will definitely rise, but a high turnover rate is also an important factor supporting the rise in stock prices.
4. The high turnover rate of stocks with high volume at the bottom indicates that the signs of new capital intervention are more obvious. The future upside is relatively large. The more the bottom changes hands, the less the upward selling pressure. In addition, strong stocks represent the hot spots of the market, so it is necessary to focus on them.
5. Combining the turnover rate with the stock price trend can make certain predictions and judgments about the future stock price. The sudden increase in the turnover rate of a certain stock and the increase in trading volume may mean that investors are buying in large quantities, and the stock price may rise accordingly. If a stock has continued to rise for a period of time, and the turnover rate rises rapidly, it may mean that some profitees want to cash out, and the stock price may fall.
6. The relatively high trading volume suddenly increases, and the willingness of the main force to distribute is obvious. However, it is not easy to release the volume at the high position. Generally, the trading volume will be released when some good news is released, and the main force can complete successfully. Distribution, there are many such examples.
The first thing to do when digging for leading stocks is to dig out popular stocks. One of the effective indicators for judging whether they belong to a popular stock is the turnover rate. The turnover rate is high and shares tend to be active. Therefore, when choosing stocks, investors can put the stocks whose turnover rate is continuously multiplied every day into their own choice or notebook, and then select the best varieties based on some fundamentals and other technical aspects.

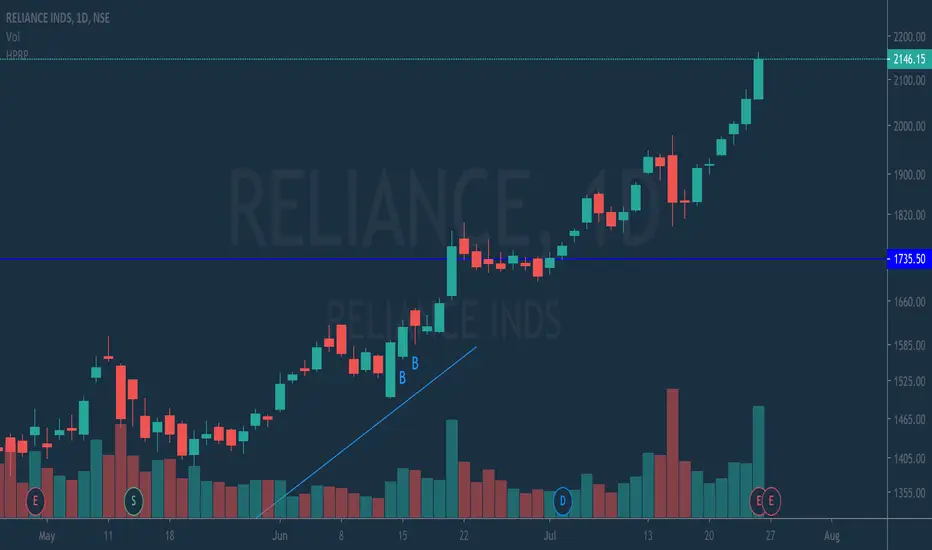
HPRPThis is High Probability Reversal Pattern indicator. If there is B at candle then long the stock. If there is S at short the stock.
Average High Traded Volume (Nodes) - Levels/Zones (Expo)Average High Traded Volume (Nodes) - (Expo) automatically identifies and displays High Traded Volume Nodes.
Levels/Zones are displayed where there has been a significant level of trading activity and when there has been both high supply and demand. These levels can leave clues for future price behavior and act as support/resistance zones.
The indicator can be used standalone or as a part of your current trading strategy.
Real-time
No repainting
Works on any market if volume data is provided
HOW TO USE
1. Use the indicator to identify High Traded Volume Nodes.
2. Use the indicator to identify support/resistance zones.
3. Use the indicator to confirm the existence, or a continuation, of a trend or a trend reversal.
INDICATOR IN ACTION
4-hour chart
I hope you find this indicator useful , and please comment or contact me if you like the script or have any questions/suggestions for future improvements. Thanks!
I will continually work on this indicator, so please share your experience and feedback as it will enable me to make even better improvements. Thanks to everyone that has already contacted me regarding my scripts. Your feedback is valuable for future developments!
ACCESS THE INDICATOR
• Contact me on TradingView or use the links below
-----------------
Disclaimer
Copyright by Zeiierman.
The information contained in my scripts/indicators/ideas does not constitute financial advice or a solicitation to buy or sell any securities of any type. I will not accept liability for any loss or damage, including without limitation any loss of profit, which may arise directly or indirectly from the use of or reliance on such information.
All investments involve risk, and the past performance of a security, industry, sector, market, financial product, trading strategy, or individual’s trading does not guarantee future results or returns. Investors are fully responsible for any investment decisions they make. Such decisions should be based solely on an evaluation of their financial circumstances, investment objectives, risk tolerance, and liquidity needs.
My scripts/indicators/ideas are only for educational purposes!

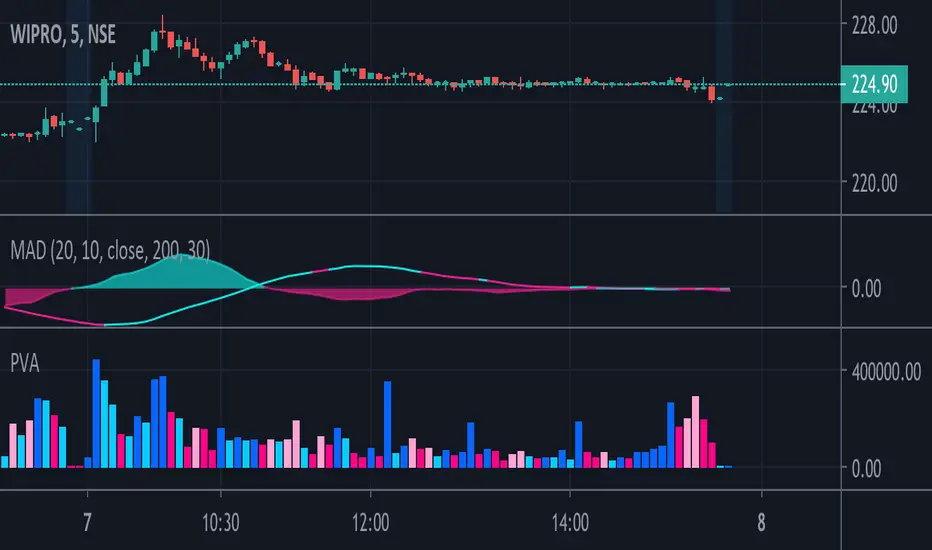
Price & Volume Action_KMThis Indicator is a volume indicator but with price action ...
Dark Blue = Price and Volume both increasing
Light Blue = Price is increasing and Volume is decreasing
Dark Pink = Price and Volume both decreasing
Light Pink = Price is decreasing and Volume is increasing
Bearish FS Continuation S1BB - baby bar / inside bar
DF - downflow, meaning 20MA below 50MA
EXE - execution bar, indicator to short
Mainly to identify execution bar for shorting using inside bar identification and force top

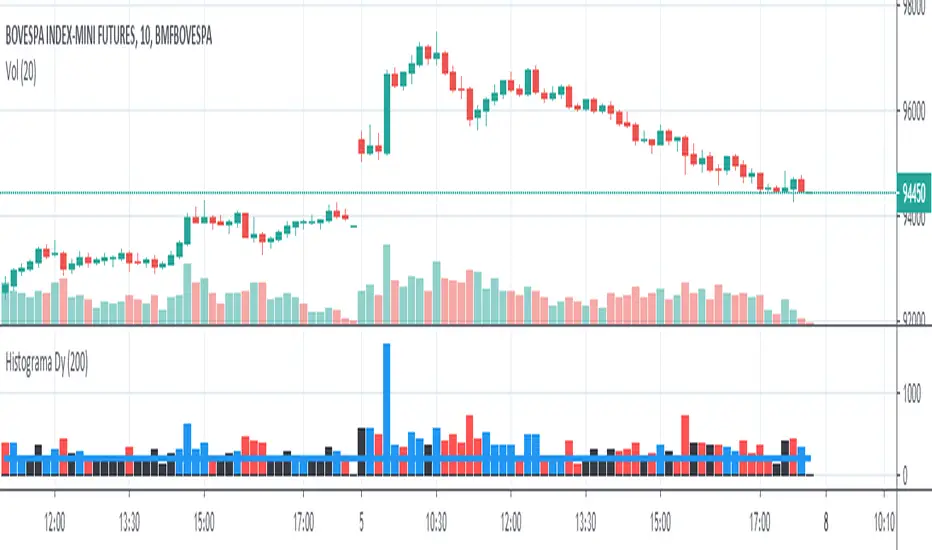
Histogram - Price Action - Dy CalculatorThis script aims to help users of Price Action robot, for Smarttbot (brazilian site that automates Brazilian market (B3)).
You can use on any symbol.
The script will follow price action principles. It will calculate the absolute value of last candle and compare with actual candle. Colors are:
- Red - If the actual candle absolute value is higher than previous one, and the price is lower than last candle. It would be a short entry.
- Blue - If the actual candle absolute value is higher than previous one, and the price is higher than last candle. It would be a long entry.
- Black - The actual candle absolute value is lower than previous one, so there is no entry.
If there is a candle that is higher than previous one, and both high and low values are outside boundaries of previous one, it will calculate which boundary is bigger and will apply the collor accordingly.
UVOL DVOL Strength and Stagnant HistogramI liked the style of one of Noldo's scripts pertaining to Put/Call ratio so I adapted my existing UVol / DVol ratio script using his code from
I am also reducing the number of securities referenced to only Nasdaq which speeds up displaying
The yellow bars are meant to represent stagnant volume, with green / red representing strong up or down volume.
Note the indicator will display the same no matter which individual stock you are watching since it uses UVol and DVol from the whole Nasdaq exchange NOT the stock or security you are currently viewing.

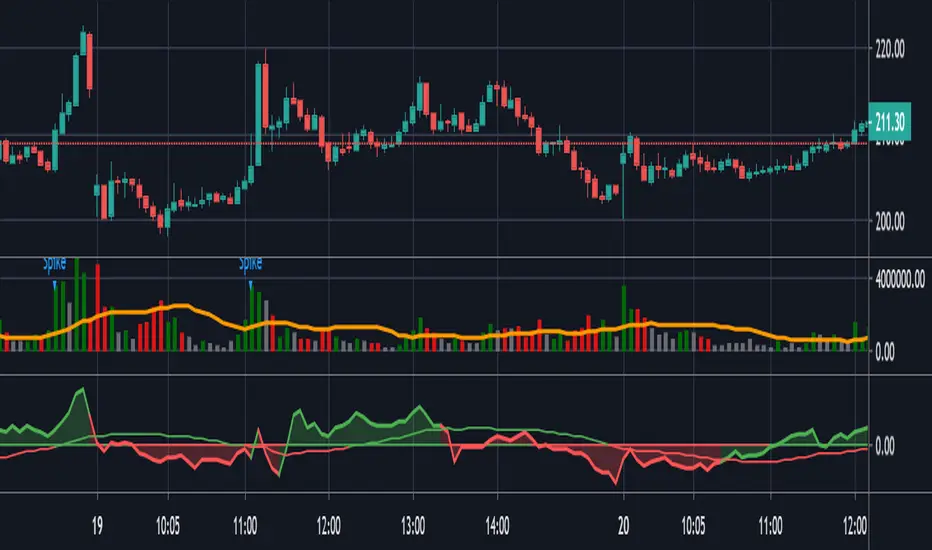
HawkEye Volume With Volume Spike AlertHaweye volume is the leading volume indicator and can be used for Volume spread analysis and Volume Price Analysis.
Added Volume spike alert to identify Institutional activity.
When there is fourfold volume spike from 4 preceding price bar and the following price bar exceeds the high of the spike bar you can go long and reverse is true for shorts
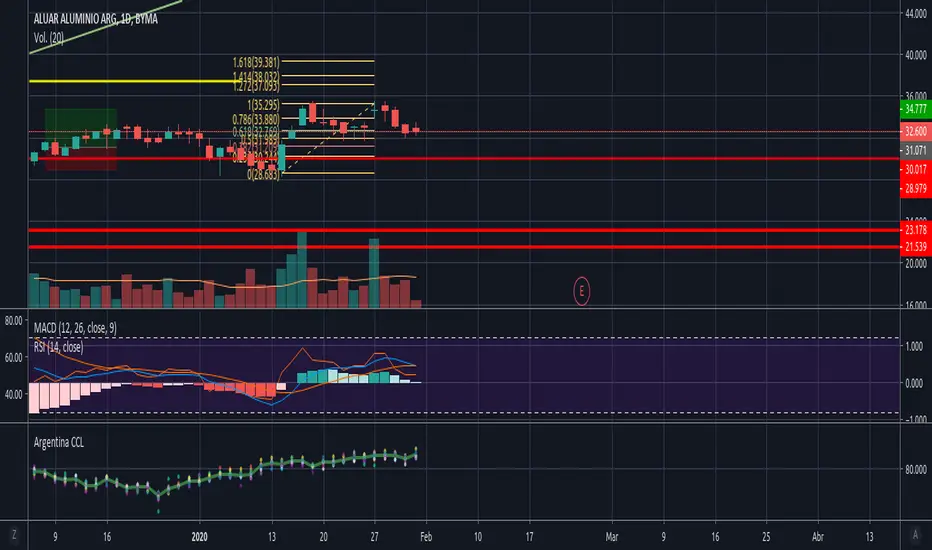
Argentina CCLPrecio del dolar contado con liquidación de activos argentinos ponderados por volumen operado
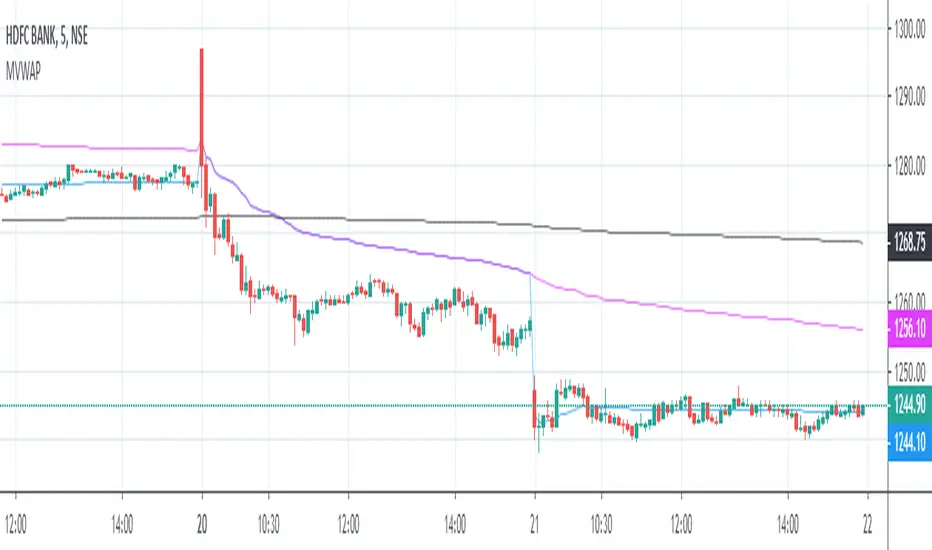
Multiple VWAPAn intraday indicator which plots the 3 different VWAP.
1. D-VWAP shows VWAP from the first candle of the day
2. W-VWAP shows VWAP from the first candle of the week
3. M-VWAP shows VWAP from the first candle of the month
PVT Osc - Price Volume Trend Oscillator [UTS]The oscillator version of the Price Volume Trend indicator (PVT) can be considered as a leading indicator of future price movements. The PVT Indicator is similar to the On Balance Volume indicator as it is also used to measure the strength of a trend.
The difference between the OBV and the PVT is that where the OBV adds all volumes when price achieves higher daily closes and subtracts them when price registers a lower daily close, the PVT adds or subtracts only a portion of the volume from the cumulative total in relation to a percentage change in price.
The general market consensus is that this difference enables the PVT to more accurately represent money flow volumes in and out of a stock or commodity.
The PVT has been designed so that it is capable of forecasting directional changes in price. For instance, if the price of a stock is rising and the PVT begins to fall, then this is indicative that a price reversal could occur very soon.
The general consensus is that the PVT is more accurate at detecting new trading opportunities than the OBV because of the differences in their construction. The OBV is designed so that it adds the same amount of volume whether the price closes upwards by just a small fraction or by multiples of its day opening value. On the other hand, the PVT adds volume proportional to the amount the price closed higher.
General Usage
Plain old PVT can be used to confirm trends, as well as spot possible trading signals due to divergences.
A benefit of the oscillator version is that it can produce LONG or SHORT signals on zero line cross.
Or controversy, disallow LONG trades in bearish territory and disallow SHORT trades in bullish territory.
Moving Averages
4 different Moving Averages are available:
EMA (Exponential Moving Average)
SMA (Simple Moving Average)
VWMA (Volume Weighted Moving Average)
WMA (Weighted Moving Average)

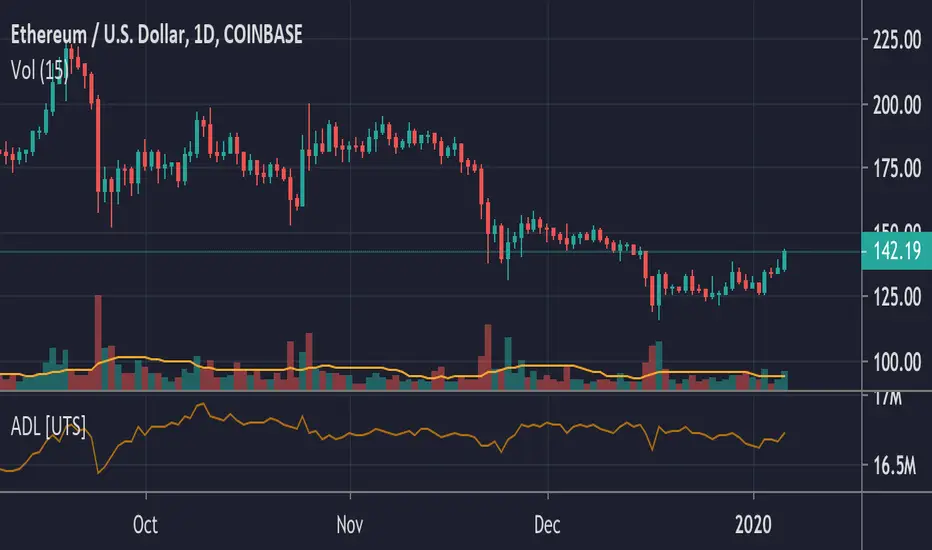
ADL - Accumulation Distribution Line [UTS]an underlying asset.
It is determined by the changes in price and volume. The volume acts as a weighting coefficient at the change of price — the higher the coefficient (the volume) is the greater the contribution of the price change (for this period of time) will be in the value of the indicator. The indicator is also known as Accumulation / Distribution Index.
Common known variants of this type of indicator are the On Balance Volume, Chaikin Oscillator or Chaikin Money Flow.
Based on www.metatrader5.com
Swing Trade Pros - Auto Trend LinesThe STP Auto Trend Lines accurately identify the real-time trend lines automatically helping you find breakouts before they happen. The indicator uses weighted moving averages to show the overall direction of the underlining asset. The higher time frames will always produce the most reliable trend lines. Once the second swing high or low has been identified the indicator automatically draws the trend lines. The Trend Lines form key market structures and once the pattern is broken a big move usually follows. If the trend is rising it indicates it may be better to enter long positions. If the trend is falling it indicates it may be better to enter short positions.
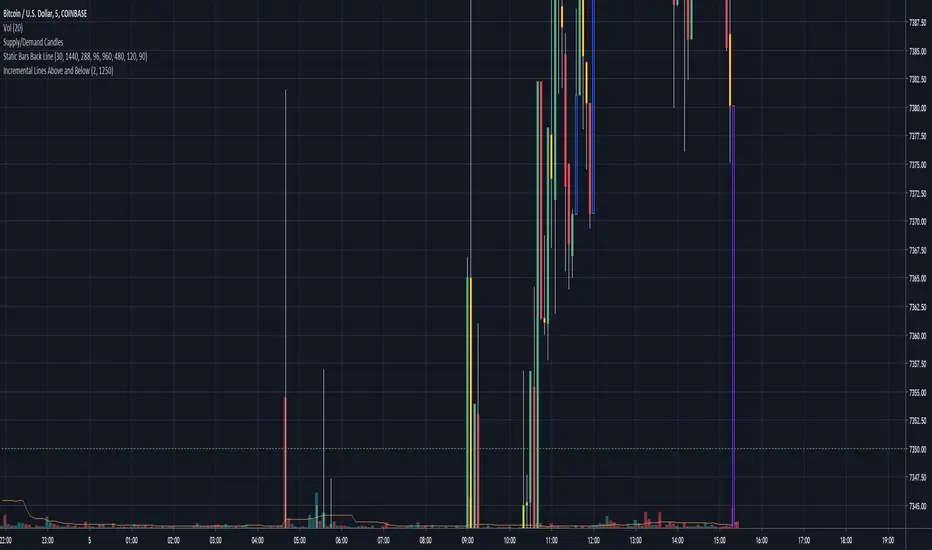
Incremental Lines Above and BelowPut lines above and below current price by a specified value. The step value refers to the mintick value of the symbol. (e.g. BTCUSD has a mintick value of 0.01 so if you wanted an increment of $12.50 you would use 1250 for the number of steps between value)
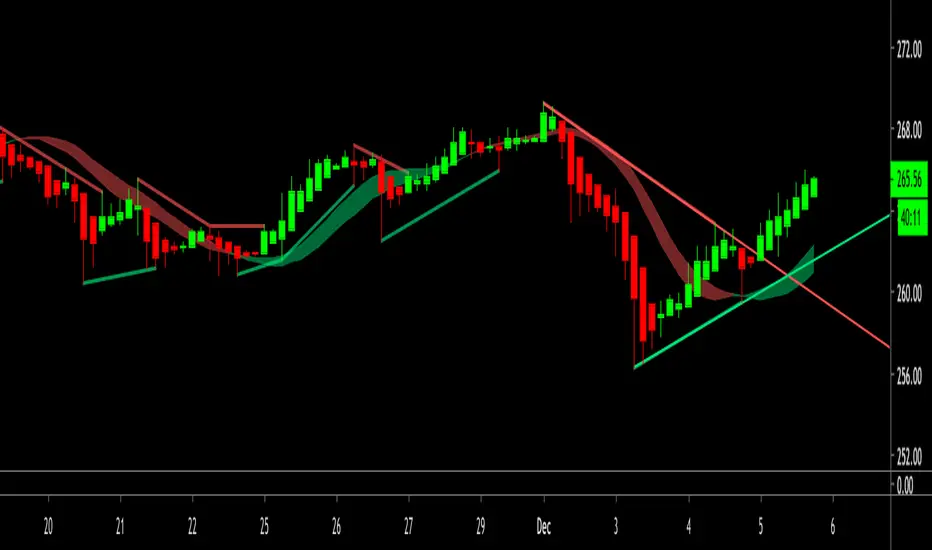
Engulfing Detector (Supply and Demand)Bullish and bearish engulfing candles marked with horizontal lines around engulfed candle. Currently looks a max of 2000 bars back.
This indicator can be used to assist in locating potential supply and demand zones.
The fresh zones will be of green and red line colors and the tested zone lines are grey in color.

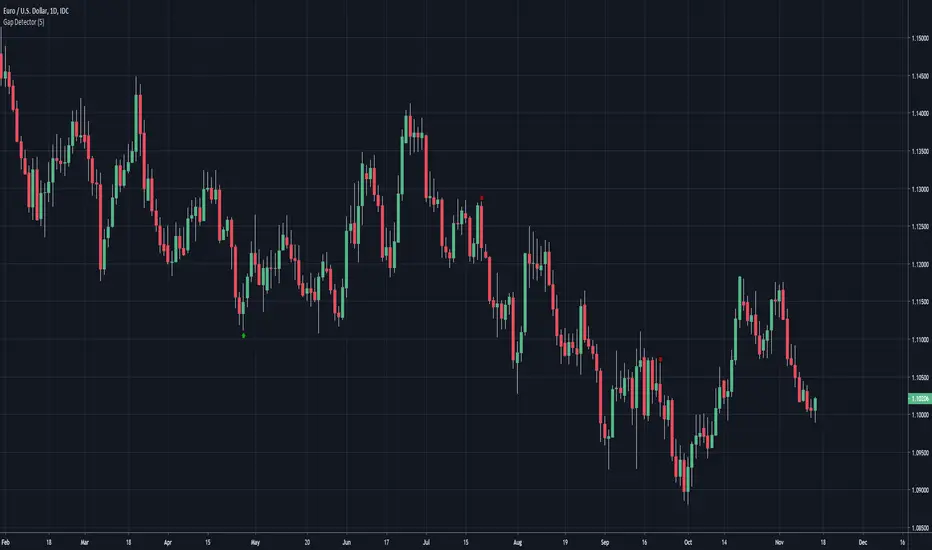
Gap DetectorArrow at candle where bullish or bearish gap occurred by a configurable minimum pip distance


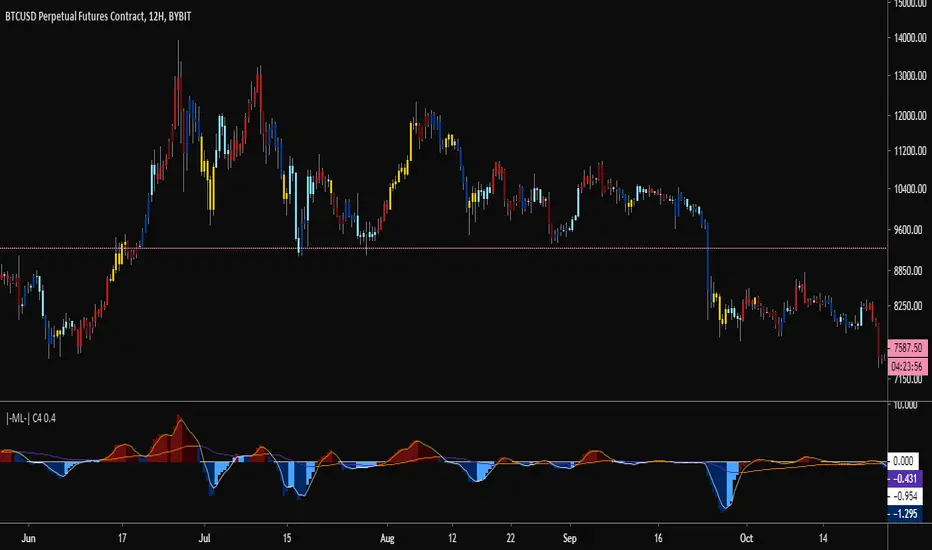
|-ML-| C4 - Amplified Volume Directional Bias OscillatorThis indicator presents an oscillator that suggests volume directional bias.
Colour switch (blue to ice-blue and red to maroon) confirms oscillator turnaround.
Confirmed divergences flag a trend change that can be used as a trade entry aid.
I suggest changing your candlesticks as follows:
Border: black
Wicks: grey
Swing Trade Pros - Support/Resistance LevelsThe STP Support/Resistance Levels accurately detect the key levels by identifying large swings/pivots in historical price action automatically. It identifies price levels where historically the price reacted by either bouncing or reversing the direction. Prior price behavior at these levels can leave clues for future price behavior. These tops and bottoms in price action show where lots of buyers or sellers came into the market and might act as future levels of support or resistance. By default, the code detects the last 3 significant swing highs and the last 3 swing lows. When price action breaks above the resistance line the color changes to green because it's now support. Likewise, when the price action breaks below the support line the color changes to red because it's now resistance.
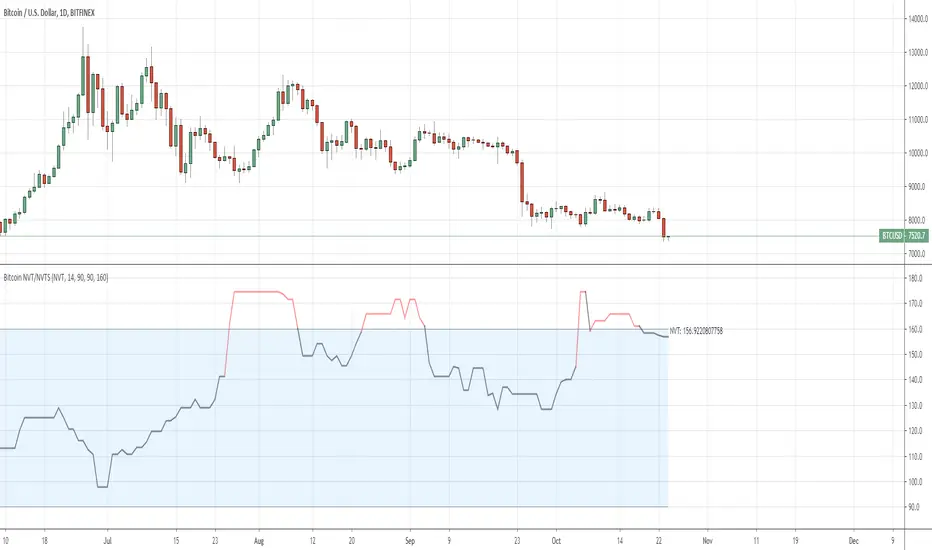
QuantNomad - Bitcoin NVT/NVTSIn this script I included 2 quite interesting indicators for Bitcoin:
* NVT (Network Value to Transactions Ratio)
* NVTS (NVT Signal)
Both indicators are based on Bitcoin Network Value (Market Cap) and 24h transaction volume.
For both these values I'm using Quandl datasets from Blockchainc.com:
market_cap: QUANDL:BCHAIN/MKTCP
transac_vol: QUANDL:BCHAIN/ETRVU
Calculation for both indicators are pretty simple:
NVT = median(market_cap / transac_vol, 14 bars)
NVTS = market_cap / sma(transac_vol, 90 bars)
NVT and NVTS are cryptocurrency's answers to P/E ratio. They can help you to understand if bitcoin is under/overvalued.
When NVT or NVTS is relatively high it can be a pretty good point to short bitcoin, if it's low it good time to buy bitcoin.
NVT Ratio - was created by Willy Woo
NVT Signal - was created by Dimitry Kalichkin
Because of different sources of transaction volume data, these indicators can differ in values from originals, but magnitude should be the same.
This is a pretty simple example where you can select only static overbought/oversold levels and when indicator will be above/below it you will see in changing in color.
I have many more things in my head how these indicators can be developed further and what strategies can be derived from them, but as is they can be a pretty good base for you. Will share my advanced findings later.
Volume with directionOscillator plots cumulative volume with direction defined by price (positive price change = positive volume and vice versa) divided by volume sma.
It is good for divergence indication and can be used for trend change prediction.
It is faster then stoch with the same length.
