PT MSTx StochasticVersion 1.0 of our MSTx Stochastic indicator helps determine when a trend is strong vs. exhausted. The indicator is a modified version of the original stochastic. We added a second line for further confluence, which acts as support & resistance. The added smoothing toggle of the indicator can help you get a different perspective of the move. We also added a series of Fibonacci levels that act as pivotal areas. We have two highlighted areas that offer volatility. Our Red zone (upper fibs) should prompt you to look for short entries & our Grey zone (mid fibs), which acts as a neutral/range area.
Main line – Faster settings that move through support/resistance quicker.
Signal line- Slower settings that tend to act as support/resistance for our main line.
Strategy:
Shorting- Look for the Main line to cross down into the Signal line & then retest the Signal line. Stronger signal if algo is active (Maroon).
Longing – Look for the Main line to cross up into the Signal line & then retest the Signal line. Stronger signal if algo is active (Green).
This Oscillator was built around our buy sell indicator & it is used on all time frames for swinging & scalping. It is included as part of the library. Just message us for access!
Oversold

SSHSH_ScalpWhen the trend is already determined You have to use some filter to define trade entries.
With the UpTrend it's better to start buying when this market-pulse indicator is at it's bottom, and vice versa for the DownTrend.
It's better to do that with the overbought / oversold areas:
- simply buy when the area is below the lower band;
- and sell when the area is above the upper band.
Use it with the faster tuning when You trade the higher timeframes, and with the slower tuning on a lower timeframes.
{PM me in TradingView to arrange subscription access}

SSHSH_DevVolatility is a market pulse, like breathing. And it's deviations is being considered as a signal attenuation.
When You want to know how far is the current price of it's mean value, You can use this indicator to determine 3-sigma rule.
The mean line (like moving average) shows if the market is in it's UpTrend state or the DownTrend state.
When it hits it's upper level - so we can say that the Uptrend has ended. The vice versa for the DownTrend.
Use it with the faster tuning when You trade the higher timeframes, and with the slower tuning on a lower timeframes.
{PM me in TradingView to arrange subscription access}

SSHSHThis indicator is designed to determine overbought / oversold areas, taking into account the general direction of the trend.
It's being considered as an UpTrend while the area is above it's middle value, and also it's being a signal attenuation when the area is above the upper band.
Vice versa it's being considered as a DownTrend while the area is below it's middle value, and also it's being a signal attenuation when the area is below the lower band.
Each market (stocks, futures, currencies etc.) has it's own individual parameters, properties and characteristics: so it's better to use tuning depending on the timeframe You choose (the bigger the timeframe is - the lower/faster tuning has to be chosen, and vice versa).
{PM me in TradingView to arrange subscription access}

MTF Stoch RSI ScreenerDisplays when multiple timeframes of Stochastic RSI are overbought/oversold. Multiple consecutive timeframes being overbought/oversold can signify a short term top or bottom.
Thanks to Micse in Pinescripters telegram who helped remove a few errors from this.

Momentum Drift Oscillator™TradeChartist Momentum Drift Oscillator is a elegantly designed Oscillator that uses both trend following and mean reversion models, that helps visualize the price momentum, based on user defined lookback period and standard deviation.
===================================================================================================================
Momentum Drift Oscillator ( MDO ) Features:
MDO shows how far away the price is, from the mean, based on Lookback Length (21, 34, 55, 89, 144, 233) and Standard Deviation input (Min - 0.236, Max - 2.0) , and helps understand potential price reversal points based on mean reversion principles.
Drift Visualizer helps visualise the velocity with which Price moves and helps the trader spot various momentum drift zones like Fuel zones, Overbought/Oversold areas and Bull/Bear Exhaustion limits. Drift Visualizer above 150 is usually Overbought and value above 200 is Super Overbought. Similarly, value below -150 is usually Oversold and value below -200 is Super Oversold.
Option to enable and disable coloured bars based on Momentum Drift. (Colour intensity on Price bars helps visualise the price momentum - 2 Colour Schemes available from the settings - Chilli and Flame).
Long and Short Trade Alerts can be created using Once Per Bar Close .
The indicator does not repaint. Alerts may display potential repaint warning, but this is because the code uses bar index for Drift Visualizer labels. For confidence in the indicator, it can be tested using bar replay to make sure the real-time and bar replay trade entries and plots stay on the same bar/timestamp.
MDO can be connected to ™TradeChartist Plug and Trade to generate Trade Entries, Targets, Sop Loss plots etc and to create all types of alerts.
===================================================================================================================
Why is Momentum Drift Oscillator ( MDO ) different from traditional Momentum based indicators?
This Momentum Drift model truly combines mean reversion and trend following principles, but with a unique original idea.
It needs 2 user defined inputs - Lookback length and Standard Deviation. If for example, say the trend is Bullish and MDO is above 0, the Oscillator doesn't go below 0, even if there is extreme bull exhaustion, if the trend based on lookback and standard deviation is not favorable to reverse trades.
Only Fibonacci lookback periods (21, 34, 55, 89, 144, 233) are used as they have been found more effective than other periods. The default Lookback period is 55 and Standard Deviation is 1, but this can be changed from the settings. Lower values of Lookback period go well with higher Standard Deviation and higher values of Lookback period go well with lower Standard Deviation (0.5, 0.618, 0.786, 0.886, 1 etc.), based on trading style and personal risk strategy.
The indicator includes a Drift Visualizer that helps spot important trade zones based on Price Velocity, calculated dynamically for every bar based on user defined parameters. The first move above or below 0 always opens at Bull Fuel or Bear Fuel zone and the exhaustion zones are reached only at the time of price returning to the mean. But it doesn't change direction if the trend is still up, so the trader can make an informed decision as to when to reverse trades, based on another confirmator.
Similarly, when the Visualizer reaches Fuel or Support/Resistance zones, it normally needs a bit of a push to reach the Overbought - Super Overbought/Oversold - Super Oversold levels where the price normally starts reversing back to the mean and this whole process can be visualized through Visualizer labels on MDO. This process eliminates a lot of noise that normally comes with traditional Momentum indicators.
===================================================================================================================
Example Charts:
1. XAU-USD 1hr chart - Lookback - 55, Std Dev - 2
2. ADA-USDT 4hr chart - Lookback - 89, Std Dev - 1
3. WTI - USOIL Daily chart - Lookback - 34, Std Dev - 1.618
4. SPX Daily chart - Lookback - 144, Std Dev - 0.236
5. GBP-USD 15m chart - Lookback - 144, Std Dev - 0.618
6. BTC-USD 1hr connected to Plug and Trade - Lookback - 55, Std Dev - 1
===================================================================================================================
Best Practice: Test with different settings first using Paper Trades before trading with real money
===================================================================================================================
This is not a free to use indicator. Get in touch with me (PM me directly if you would like trial access to test the indicator)
Premium Scripts - Trial access and Information
Trial access offered on all Premium scripts.
PM me directly to request trial access to the scripts or for more information.
===================================================================================================================

CryptoSignalScanner - OverBought/OverSold Zone IndicatorDESCRIPTION:
This indicator has been designed to do some swing trading on 4 hour and daily candles.
It also gives good results on the lower timeframes 5m, 15m and 1h but trading on those levels is time consuming and stressful.
• This indicator is based on RSI, Stochastic RSI and some other indicator(s).
• This indicator is based on our "CryptoSignalScanner - Advanced BUY/SELL Indicator" but with a small difference in calculation to define the OverBought and OverSold zones.
• It displays the OverBought and OverSold zones.
• It is also possibility to set an OverBought/OverSold, OverBought and OverSold alert.
HOW TO USE:
• When the OverBought zone is displayed it means that the trading pair is OverBought. Wait for the reversal to SELL. Use the Fibonacci tool together with the Eliot Waves Theory to SELL.
• When the OverSold zone is displayed it means that the trading pair is OverSold. Wait for the reversal to BUY. Use the Fibonacci tool together with the Eliot Waves Theory to BUY.
FEATURES:
• You can adjust the OverBought and OverSold zones.
• You can display/hide the RSI.
• You can adjust RSI values.
• You can display/hide the Stochastic RSI.
• You can adjust Stochastic RSI values.
• You can display/hide the ...
• You can adjust the ...
• You can set OverBought/OverSold alert.
• You can set OverBought alert.
• You can set OverSold alert.
• Etc...
REMARKS:
• This advice is NOT financial advice.
• We do not provide personal investment advice and we are not a qualified licensed investment advisor.
• All information found here, including any ideas, opinions, views, predictions, forecasts, commentaries, suggestions, or stock picks, expressed or implied herein, are for informational, entertainment or educational purposes only and should not be construed as personal investment advice.
• We will not and cannot be held liable for any actions you take as a result of anything you read here.
• We only provide this information to help you make a better decision.
• While the information provided is believed to be accurate, it may include errors or inaccuracies.
HOW TO GET ACCESS TO THE SCRIPT:
• Use the link below to subscribe to our indicators.
Good Luck,
SEOCO

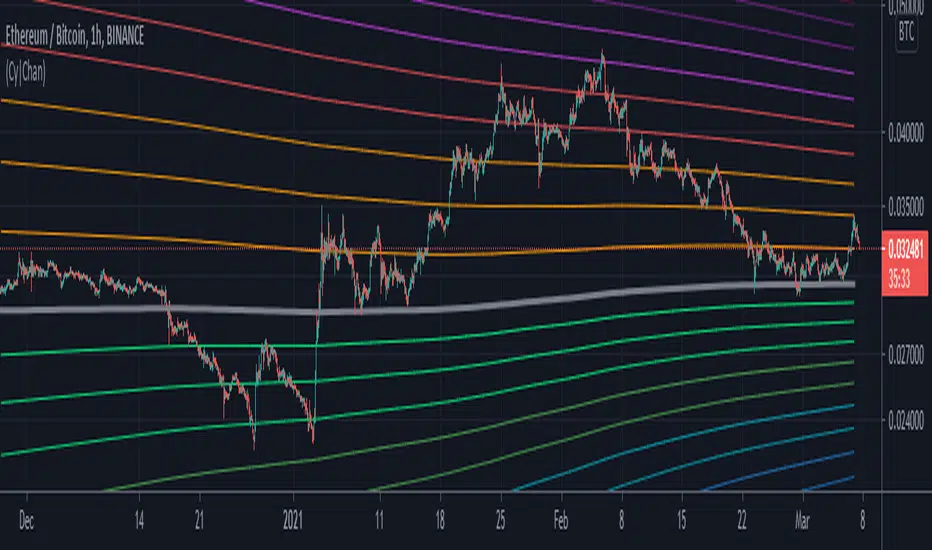
Cyber ChannelStandard deviation levels to determine if the price is over-extended in the positive/negative direction about the user defined MA line.
Historical confluence with the different levels can be used to estimate and predict the probability of a significant price retracement within given time-scale; and to help anticipate if the price is nearing local or all-time highs/lows.
ATR Auto Oscillator [DepthHouse]The ATR Auto Oscillator uses advanced range calculations to determine a dynamic range that the applied market moves within. Like an RSI , the ATR Auto Oscillator measures the speed and change of price movements through a given range. Unlike an RSI , the ATR Auto Oscillator automatically re-configures range values dependent on the user set lookback.
The oscillator ranges between (0.1) and 1.1. Generally, the market is oversold while the bands are below 0.2 and is overbought while above 0.8.
The two bands displayed are used to determine short term trend directions and the oversold/undersold state of the applied market. Crossovers of these bands could give a hint to the direction the market is moving.
The fast band (green) is the direct value of where the market is within its calculated range; 1.1 representing the top of range, and -0.1 representing the bottom. Even when this value is near the bottom of the top of the range, the auto oscillator will readjust to create a new range that the market travels within.
The slow band (red) is a lagging version of the fast band which is used to determine the oversold/overbought signals. When this band travels within the oversold and overbought regions the background color will change to signal a warning. If the fast band crosses the slow band within these zones, an opaque signal will appear. These signals are used to catch possible trend reversals.
Breakout Signals ( BETA ):
Breakout signals are the up and down arrows displayed on the top and bottom of the oscillator. A refined range is generated by the user set 'High Low Length'; it is then displayed by the light gray horizontal lines. If the user set band (fast or slow) returns into the range within a given period (breakout offset) then a signal will generate.
Built in Alerts (must be set up by user):
Bullish & Bearish Crossovers within the oversold and overbought ranges.
Bullish & Bearish Breakout alerts (beta)
Users can also set custom alerts. Example: Fast Band crossing up Value: 0.7
To gain access to this indicator please follow the link below.
Feel free to message me with any questions directly here on TradingView.

Percentage Price Over SMAReturn the percentage of closing prices greater than SMA's with periods within a user-selected range. An exponential moving average applied to these results is also displayed (in orange).
Settings
Min : Minimum period of the SMA in the range
Max : Maximum period of the SMA in the range
Smooth : Period of the EMA
Src : Input series of the indicator
Usage
The indicator is a normalized oscillator. A value of 100 indicates that 100% of the current closing price is over SMA's with periods ranging from min to max , this indicates a bullish market, while a value of 0 would indicate a bearish market.
In this image the indicator use min = 50 and max = 200, here AMD has been strongly bullish at the start, and ended being strongly bearish at the end, during this bullish period the indicator is over its overbought level, while it is under its oversold level during the bearish period.
In case the market is ranging we can expect the indicator to be around 50%, using the smoothed result might be more useful to detect ranging markets with this indicator.
If the smoothed result is within the overbought/oversold levels, then we can say that the market is either ranging or transitioning from a bullish/bearish market to an opposite one.

AI Driven OBOS Analyzer (Zeiierman)█ Overview
AI Driven OBOS Analyzer (Zeiierman) reframes price into an adaptive Overbought/Oversold (OBOS) regime map. Rather than relying on a single oscillator threshold, it uses a responsive price function and an instance-based learner that classifies the current state by comparing it to its most similar historical states. The result is a forward-useful view of where participation is likely imbalanced (buyers dominating vs. sellers dominating), rendered as colored candles, regime boxes, and automatically drawn equilibrium lines.
⚪ Why This One Is Unique
This system stands out because its pricing engine adapts to market behavior rather than relying on a fixed formula. Rather than committing to a single filtering function or reaction speed, it reshapes its internal price view in real time, creating an OBOS framework that moves with the market’s rhythm and offers a more natural sense of when pressure is building on either side.
Its regime detection is equally distinct. Instead of static thresholds, it relies on similarity-based evaluation, comparing the current state to historically comparable periods and letting those past states vote on whether the market currently sits in a bull- or bear-leaning regime. Separate controls for how many comparisons matter and how large the reference cohort should be allow you to adjust for responsiveness or stability. As dominance phases emerge, structural regions build and then lock, creating a clear visual map of where participation meaningfully shifted between buyers and sellers.
█ Main feature
⚪ Overbought/Oversold Layer
The OBOS layer highlights when the market enters a buyer-dominant or seller-dominant phase and preserves those phases as structural reference levels. When the learner identifies a bull-dominant state , candles and a green regime box appear from the start of that dominance; once the regime concludes, the tool places an equilibrium line, a forward-projected level representing the regime’s internal balance point.
Bear-dominant phases follow the same logic with red boxes and bearish equilibrium lines. These equilibrium zones act as the anchor for the entire overbought/oversold structure, functioning as balanced points where market pressure previously shifted. A price above equilibrium often favors a bullish bias, while a price below equilibrium tends to favor a bearish bias. Traders can watch how the price behaves when revisiting these lines, such as retests, holds, reclaims, or failures, to gauge whether previous dominance levels are being respected, rejected, or flipped, turning past regime behavior into meaningful, trade-relevant context.
█ How to Use
⚪ Overbought/Oversold Trading
Overbought and oversold trading is one of the most recognized setups in technical analysis. It signals when the market has moved too far or too fast in one direction, creating an overextended move and a clear imbalance between buyers and sellers. These imbalances tend to “rebalance” through pullbacks or reversals as price fills the displaced area. Because of this, overbought and oversold zones become natural regions where traders look for turning points or counter-moves. These areas are also great spots to secure partial profits if you’re already in a position.
Reversal trading
Reversal trading based on overbought and oversold conditions can work extremely well in ranging markets. But you still need proper market context before going contrarian. Don’t rely on overbought or oversold signals in isolation.
Profit-taking
Profit-taking is about locking in gains as the market moves in your favor. Overbought and oversold zones create natural spots to secure partial profits, and when these zones end, that shift is a great moment to take some profit off the table.
⚪ Buying and Selling Pressure Trading
When overbought or oversold conditions appear, they reflect a strong dominance in buying or selling pressure. Overbought means buyers are in control; oversold means sellers are in control. These conditions can extend for some time, and the price can continue moving in that direction until buying and selling pressure finally equalize again.
Buying-Pressure
When the market enters an overbought zone, traders can look for entries aligned with that pressure to ride the momentum until it fades. A common approach is to identify an overbought imbalance on a higher timeframe, such as the 1-hour chart, and then switch to a lower timeframe, such as the 1-minute chart, to locate oversold pockets. These lower-timeframe oversold areas offer attractive long entries, assuming the higher-timeframe buying pressure continues to drive prices.
Selling-Pressure
Selling-pressure trading works the same way but in reverse. When the market enters an oversold zone, sellers dominate. Traders can use a higher-timeframe oversold imbalance as the directional bias and then look at lower timeframes for small overbought zones to enter short. These micro overbought areas become efficient entry points to ride the broader selling pressure until it resolves.
⚪ Equilibrium Trading
Overbought and oversold zones generate an equilibrium line once the zone completes. This line represents the core shift in buying or selling pressure within that regime. When price revisits an equilibrium line, retests and reversals are common. If the price holds above an equilibrium line, traders can lean toward a bullish bias; if it holds below, a bearish bias becomes more likely. These equilibrium levels act as clean, reliable reference points for directional confirmation and timing.
█ How It Works
⚪ Responsive Price Function
Price is reframed through an adaptive transformation that behaves like a dynamic response surface, adjusting its sensitivity to volatility, curvature, and micro-structure noise. Instead of a fixed smoothing rule, the engine applies an elastic filtering function that adapts in real time, preserving meaningful structure while reducing transient distortions. The outcome is a stable yet agile price backbone that drives all regime evaluation.
Calculation: Employs a parameterized smoothing functional that adjusts its horizon dynamically, reducing distortion around turning points and keeping the model’s internal state closely aligned with actual price movement.
⚪ Instance-Based Regime Classifier
Each bar is embedded into a feature space defined by its behavior relative to the model’s adaptive price state. The system then performs a similarity search across a broad historical cohort, identifying the closest structural analogs and allowing them to vote on the current bar’s regime identity. This instance-driven process avoids rigid thresholds and instead adapts fluidly to the market’s prevailing volatility conditions and structural rhythm.
Calculation: Executes an enhanced weighted nearest-neighbor inference process where similarity scores shape probabilistic voting, concentrating influence on the most contextually relevant examples to yield a stable bull or bear regime classification.
⚪ Regime Boxes & Exit Equilibrium Lines
Active regimes accumulate their structural boundaries as the market evolves, forming a real-time “regime envelope” that expresses the spatial footprint of buyer or seller dominance. When the regime ends, the segment is sealed, and an equilibrium line is projected from its internal centroid. This equilibrium expresses the pressure balance point of the regime and acts as a durable reference level for future reactions, reclaims, or breaks.
Calculation: Utilizes event-based segmentation with stateful envelope aggregation and centroid extraction, converting each completed regime into a persistent equilibrium marker that carries forward as a reactive structural level.
-----------------
Disclaimer
The content provided in my scripts, indicators, ideas, algorithms, and systems is for educational and informational purposes only. It does not constitute financial advice, investment recommendations, or a solicitation to buy or sell any financial instruments. I will not accept liability for any loss or damage, including without limitation any loss of profit, which may arise directly or indirectly from the use of or reliance on such information.
All investments involve risk, and the past performance of a security, industry, sector, market, financial product, trading strategy, backtest, or individual's trading does not guarantee future results or returns. Investors are fully responsible for any investment decisions they make. Such decisions should be based solely on an evaluation of their financial circumstances, investment objectives, risk tolerance, and liquidity needs.

Hybrid Overbought/Oversold Detector + Put/Call SignalsThere are many indicators of overbought/oversold conditions out there. Some of more common ones are:
- Bollinger Bands %B
- Money Flow Index (MFI)
- Relative Strength Index (RSI)
- Stochastic
This script uses a combination of these 4 oscillators to confirm overbought/oversold and filter the signals of market reverse which could be used for trading binary options.
You may select which oscillators you want to apply and of course change the source, the length of the calculations and the overbought/oversold levels.
Also the script will draw a combined graph which is the average of the selected oscillators in the options.
Send me your ideas!

Momentum Oscillator [Dynamic & Flow] (Expo)Momentum Oscillator -Dynamic & Flow (Expo) is a fast-moving, sensitive oscillator that makes use of momentum in various ways. The indicator has two additional layers (Buy & Sell moves) and (Extremes) which makes it reacts quickly to price changes.
The indicator displays overbought and oversold areas as well as extreme areas and how aggressive buyers and sellers are. It does also displays potential reversal points or potential pullbacks.
The following momentum modes are displayed:
1. Where momentum begins
2. Where momentum is strong
3. Where momentum begins to stall
Where momentum begins to stall is displayed as a red and green color on the momentum line .
Where momentum begins (light green and light red color) and where it's strong (dark green and dark red color) is displayed as upper and lower lines. The darker these lines are the stronger is the momentum.
Potential reversal or pullback is displayed as a blue color on the signal line.
♢ The indicator has inbuilt suggested buy & sell- and stop-loss signals. These signals have flexible settings, so a fast, slow, and sensitive mode can be enabled.
DIVERGENCES
All types of momentum oscillators produce divergences and so does Momentum Oscillator Dynamic & Flow (Expo) . Divergences occur when the oscillator deviates from the trending price action. Bullish divergence is then when the trending price makes a lower low but the oscillator makes a higher low. Bearish divergence is then when the trending price makes a higher high but the oscillator makes a lower high.
HOW TO USE
1. Use the indicator to identify overbought/oversold areas, as well as extreme modes.
2. Use the indicator to display momentum in various ways.
3. Use the indicator to confirm the existence, or a continuation, of a trend.
4. Use the indicator to identify potential reversal points or potential pullbacks.
INDICATOR IN ACTION
4-hour chart
I hope you find this indicator useful , and please comment or contact me if you like the script or have any questions/suggestions for future improvements. Thanks!
I will continually work on this indicator, so please share your experience and feedback as it will enable me to make even better improvements. Thanks to everyone that has already contacted me regarding my scripts. Your feedback is valuable for future developments!
ACCESS THE INDICATOR
• Contact me on TradingView or use the links below
-----------------
Disclaimer
Copyright by Zeiierman.
The information contained in my scripts/indicators/ideas does not constitute financial advice or a solicitation to buy or sell any securities of any type. I will not accept liability for any loss or damage, including without limitation any loss of profit, which may arise directly or indirectly from the use of or reliance on such information.
All investments involve risk, and the past performance of a security, industry, sector, market, financial product, trading strategy, or individual’s trading does not guarantee future results or returns. Investors are fully responsible for any investment decisions they make. Such decisions should be based solely on an evaluation of their financial circumstances, investment objectives, risk tolerance, and liquidity needs.
My scripts/indicators/ideas are only for educational purposes!

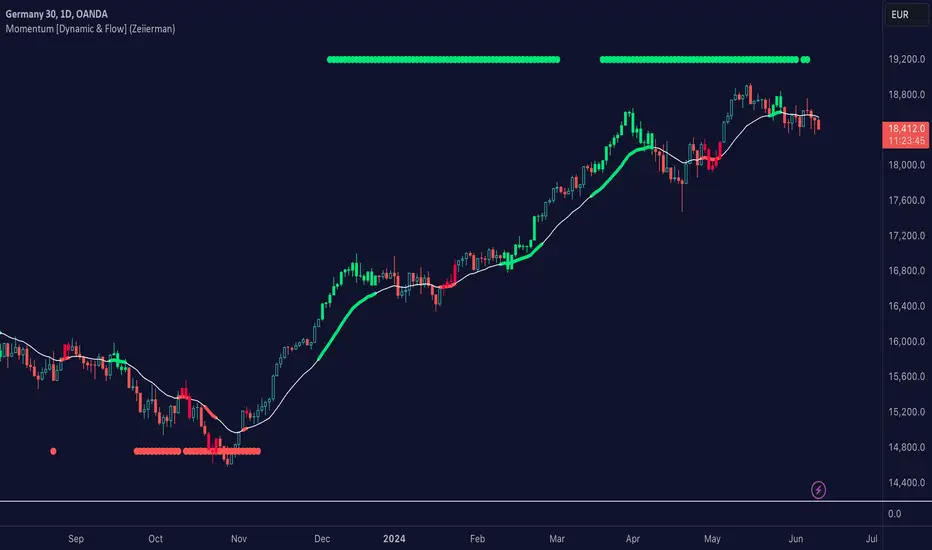
Momentum [Dynamic & Flow] (Expo)Momentum Dynamic & Flow (Expo) is a useful indicator that displays the momentum - as dynamic & flow, as well as where the momentum begins to stall.
♢ Momentum -Dynamic can be used to identify overbought and oversold areas.
♢ Momentum -Flow can be used to identify if the current trend has strong momentum.
♢ When momentum begins to stall it can be identifiable turning points, areas of congestion. However, it's not a sign that the trend is over, see it as "heads up" This is displayed with green and red colors on the moving average.
Momentum can be displayed at the top/bottom of the chart or above/below the bars. The user can also display momentum as BGcolor.
The indicator can be used standalone or as a part of your current trading strategy
HOW TO USE
1. Use the indicator to identify where the momentum stall.
2. Use the indicator to identify overbought/oversold areas with momentum -Dynamic.
3. Use the indicator to confirm the existence, or a continuation, of a trend with momentum -Flow.
INDICATOR IN ACTION
1-hour chart
4-hour chart
I hope you find this indicator useful , and please comment or contact me if you like the script or have any questions/suggestions for future improvements. Thanks!
I will continually work on this indicator, so please share your experience and feedback as it will enable me to make even better improvements. Thanks to everyone that has already contacted me regarding my scripts. Your feedback is valuable for future developments!
-----------------
Disclaimer
Copyright by Zeiierman.
The information contained in my scripts/indicators/ideas does not constitute financial advice or a solicitation to buy or sell any securities of any type. I will not accept liability for any loss or damage, including without limitation any loss of profit, which may arise directly or indirectly from the use of or reliance on such information.
All investments involve risk, and the past performance of a security, industry, sector, market, financial product, trading strategy, or individual’s trading does not guarantee future results or returns. Investors are fully responsible for any investment decisions they make. Such decisions should be based solely on an evaluation of their financial circumstances, investment objectives, risk tolerance, and liquidity needs.
My scripts/indicators/ideas are only for educational purposes!
Price Distance to its MA by DGTPrices high above the moving average (MA) or low below it are likely to be remedied in the future by a reverse price movement as stated in an Article by Denis Alajbeg, Zoran Bubas and Dina Vasic published in International Journal of Economics, Commerce and Management
Here comes a study to indicate the idea of this article, Price Distance to its Moving Averages (P/MA Ratio)
The analysis expressed in the paper indicates that there is a connection between the distance of the prices to moving averages and subsequent returns : portfolios of stocks with lower prices to moving averages generally outperformed portfolios of stocks with higher prices to moving averages. This “overextended” effect is more pronounced when using shorter moving averages of 20 and 50 days, and is especially strong in short-term holding periods like one and two weeks. The highest annual returns are recorded when buying in the range of 0-5% below shorter moving averages of 20/50 days, and 0-10% below longer moving averages of 100/200 days. However, buying very far below almost all moving averages on almost all holding periods produces the lowest returns.
The concept of this study recognizes three different modes of action.
In a clearly established upward trend traders should be buying when prices are near or below the MA line and selling when prices move too far above the MA.
Conversely, in downward trend stocks should be shorted when reaching or going above the moving average and covered when they drop too far below the MA line.
In a sideways movement traders are advised to buy if the price is too low below the moving average and sell when it goes too far above it
Short-term traders can expect to outperform in a one or two week time window if buying stocks with lower prices compared to their 20 and 50 SMA/EMA, one to two-week holding periods is quite high, ranging from 72,09% to 90,61% for the SMA(20, 50) and 85,03% to 87,5% for the EMA(20, 50). The best results for the SMA 20 and 50, on average, are concentrated in the region of 0-5% below the MA for the majority of holding periods. Buying very far below almost all MA in almost all holding periods turns out to be the worst possible option
Candle patterns, momentum could be used in conjunction with this indicator for better results. Try Colored DMI and Ichimoku colored SuperTrend by DGT

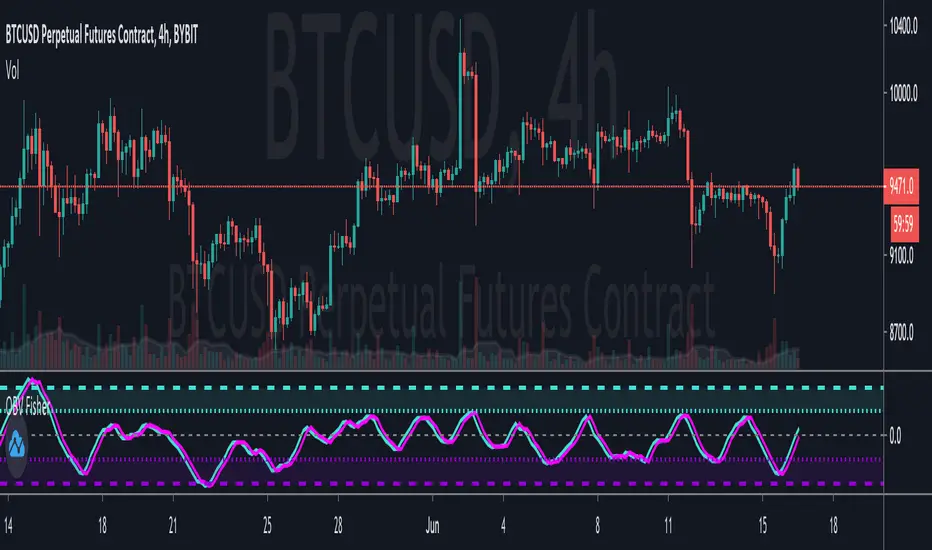
Fisher Transform on OBVApplies Ehlers Fisher Transform on to OBV, with EMA as trigger line.
Useful for identifying overbought and oversold conditions.
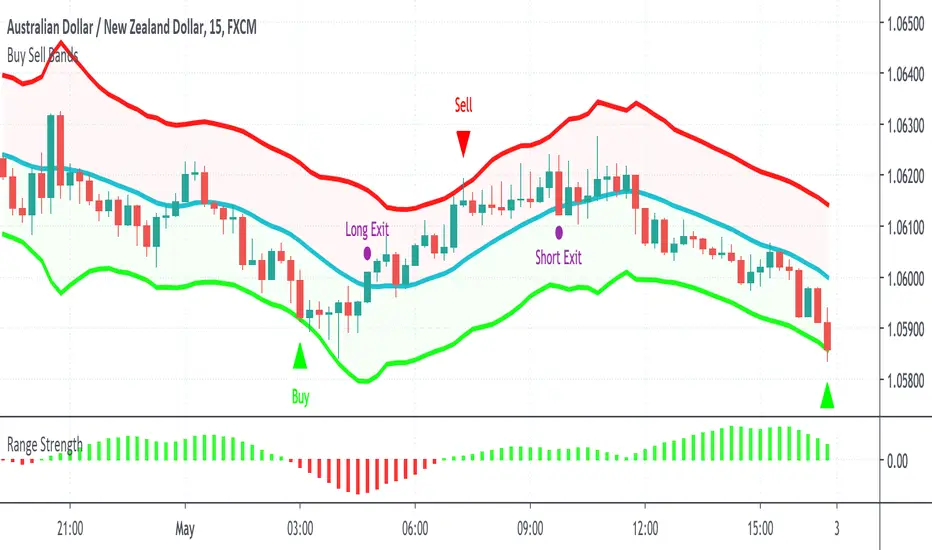
Buy Sell BandsBuy Sell Bands is a super simple indicator based on the mean reversion (range trading) strategy that shows you exactly where to buy, sell and close trades on every chart, market and timeframe.
It's best used together with our Range Strength indicator to identify when the market is in a range mode, this is the best time to take the entry signals from the Buy Sell Bands.
How Is It Different From Other Indicators?
- Designed specifically for the mean reversion (range trading) strategy
- Upper and lower bands are based on current and past volatility
- Aren't as sensitive to "squeezes" after periods of contracted volatility
- Works well in conjunction with the Range Strength Indicator to confirm entry signals
- Helps identify good "pair trading" opportunities
- Can be applied to all markets and timeframes
How To Use The Indicator?
1) Visit our website URL shown below this description and signup
2) We will then grant your TradingView username permission to use our indicators
3) Go to your Indicators window, then the Invite-Only section and add our indicators to your chart
4) Our indicators will then show on every chart you now look at
5) You can set up alerts to be notified in real time of trading signals from our indicators
6) Read our user manual for all the best tips on how to use our indicators as part of a range trading strategy
7) Feel free to reach out to us for personal one-on-one help with getting setup
What Markets and Conditions Does It Work Best On?
All markets cycle between trending and ranging modes, and the key to successfully using these indicators is identifying when the market is in or about to go into a range trading mode, and as such it can be applied to all markets and timeframes.
Some markets and timeframes trade within ranges more predictably than others, for example Forex, Cryptocurrencies, and Futures on the 15 minute timeframe during the US night session can work well due to the lack of price sensitive news creating lasting trends. With Stocks & ETFs on the 5 minute timeframe during the midday session on large cap blue chip stocks with no recent news releases can show strong range trading environments to use our indicators in.
In addition to single markets, you can also use our indicators on pair charts, for example Coca Cola(KO) versus Pepsi(PEP), you can do this by entering KO/PEP inside your TradingView chart quote box and it will bring up a pair chart. Our indicators will show buy and sell signals right on the pair chart just like any other single instrument chart. You can get very creative with what type of pairs you can come up with.
Our indicators are primarily designed for day trading and swing trading, however they can also be used for position trading and investing by identifying technically oversold and overbought range levels that are based on current and past volatility around a dynamic average price, for this we recommend using a weekly chart to identify longer trading opportunities.
As always indicators should be used as part of a trading strategy to assist in making decisions, instead of just blindly following every signal they produce you should always seek to compliment technical trading signals with additional analysis to reduce your risk and increase your odds of making a winning trade.
Examples Of Use On Various Markets and Timeframes
GBP vs CHF Forex Pair 15 Minute Chart
Tesla Stock 1 Minute Chart
Bitcoin vs USD Crypto Pair 15 Minute Chart
Micro E-Mini SP500 Futures 1 Minute Chart
Mastercard vs Visa Stock Daily Pair Chart
To gain access to the Buy Sell Bands and Range Strength Indicators visit our website shown below.
Happy Range Trading :)
DBT MoMo v.4 Candle Color VersionThis indicator is the older version of the DBT MoMo v.4 that colors candles instead of using shading.
For a full write up on this indicator please see:
For Access or Questions: Private message us. Thank you.

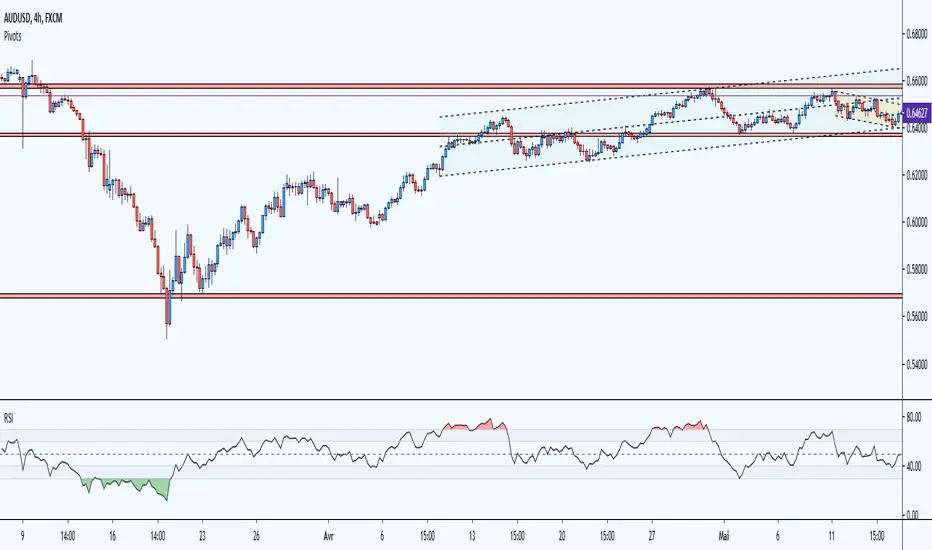
RSI Multicolor editableEN:
RSI with overbought and oversold area in color and editable level. visually more interesting than the basic version the overbought and oversold areas catch the eye quickly. Depending on the strategies and your personal use of the RSI, you can modify all the lines and add colors to each defined zone.
overbought zone, oversold and editable noise zone
I wanted to have a modifiable RSI like some trading platforms.
please excuse me for my english and my code, i'm just getting started.
FR:
RSI avec zone de surachat et survente en couleur et niveau éditable. visuellement plus intéressant que la version basique les zones de surachat et survente attirent l’œil rapidement. Selon les stratégies et l'utilisation personnel que vous faite du RSI, vous pouvez modifier toutes les lignes et ajouter des couleurs à chaque zone défini.
zone de surachat, survente et zone de bruit éditable
je souhaitais avoir un RSI modifiable comme certaines plateforme de trading.
veuillez m'excuser pour mon anglais et mon code, je débute.
B3 Stochastic Full w/BarColorNow with Bar Color!
The simplest upgrade to the classic indicator, old script:
B3 Stochastic Full
Also, if you like this one you may appreciate my personally modified take on the stochastic readings:
B3 Extended Stochastics

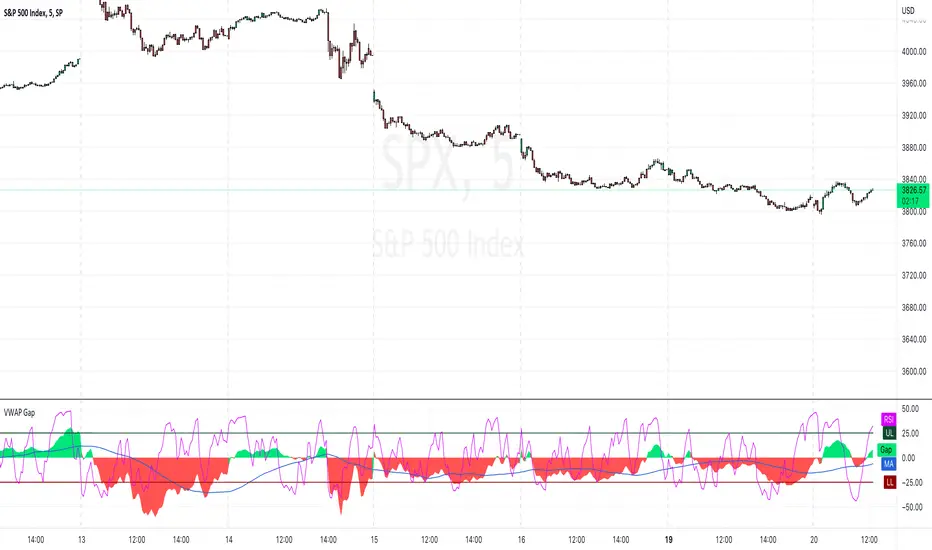
VWAP Gap [AR]This simple indicator measure the difference between price and VWAP line
The VWAP Gap indicator works best on intraday charts
SET-UP INFO
1. Add VWAP to your chart and set it up
2. Open "VWAP Gap Indicator" settings
3. Change source to "VWAP"
Enjoy!
Alex R.
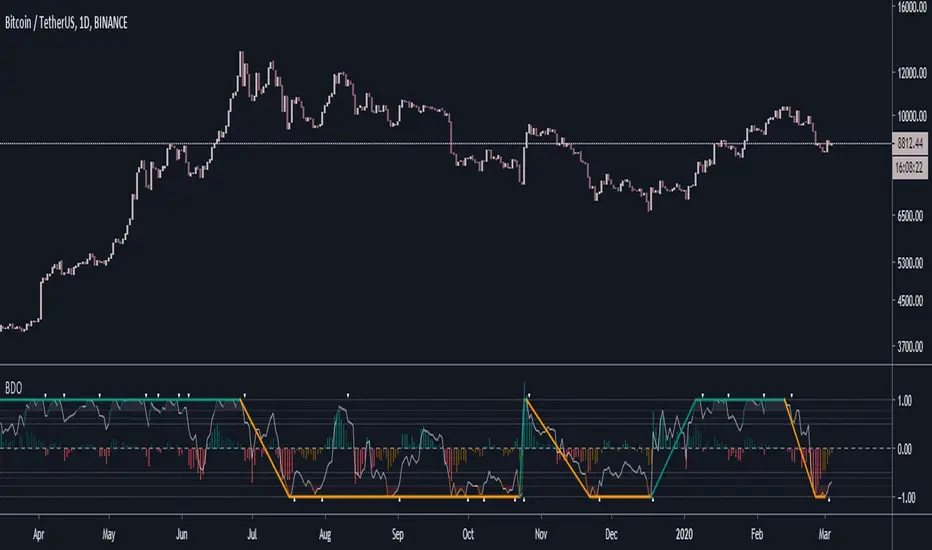
Better Donchian OscillatorWhat is BDO?
- BDO is the Better Donchian Oscillator. This is a proprietary indicator which I derived from the donchian formula.
BDO usage
1. BDO is mainly used to determine overbought and oversold levels. I think it is more accurate in determing these levels than RSI or MACD.
2. It can also be used to follow major trends with a very high accuracy, although it is lagging. However, its main oscillator in the middle is still a leading indicator.
Access and Documentation:
Message or PM to know how to get access.
RSI Call-outs [BigBitsIO]This is a simple RSI indicator that overlays the current chart to show labels for specified oversold and overbought areas defined with inputs.
It will delete any labels of the same kind within the last 3 candles so you don't see as many labels as you would otherwise.
Red labels with white text represent overbought RSI levels as defined by the user.
Green labels with black test represent oversold RSI levels as defined by the user.
This RSI overlay help easily call-out overbought and oversold candles on a chart without sacrificing screen space for a traditional RSI indicator that is not overlayed on the chart.
