Hashharvest - ADX Shader v1ADX Shader overlay. Places a background overlay for ADX weak trend (>20 and <25) and places a background overlay for a string trend (>25). Will also show Positive DM and Negative DM crosses.
Overlay

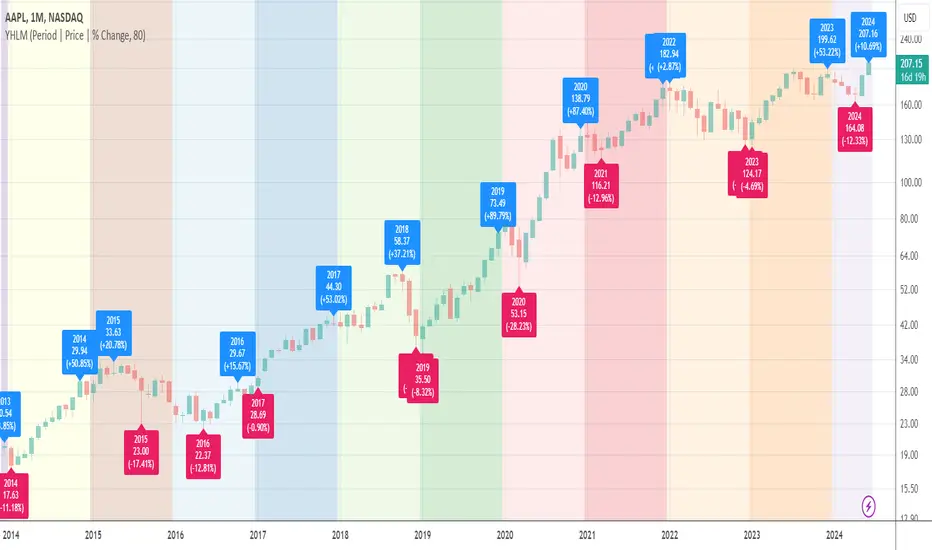
Yearly High/Low MarksAn utility tool for analysts. It marks the highest and lowest prices for each year down to 1989.
Works everywhere and doesn't use any calls of built-in functions that relate to the data extraction.
AAPL, D
AAPL, M
BLX, D
BLX, W
BLX, M
QuartersAn utility tool that highlights the financial calendar quarters and marks the beginning of each period with label.
Weekly Chart:
As always, you can support the author with donations via PayPal or crypto. I will be much appreciated and thankful for that.
A list of addresses is here bit.ly

CrayonsCrayons Grayons
Derived from -
Its messy and experimental until stable version is released , now for testing purposes only
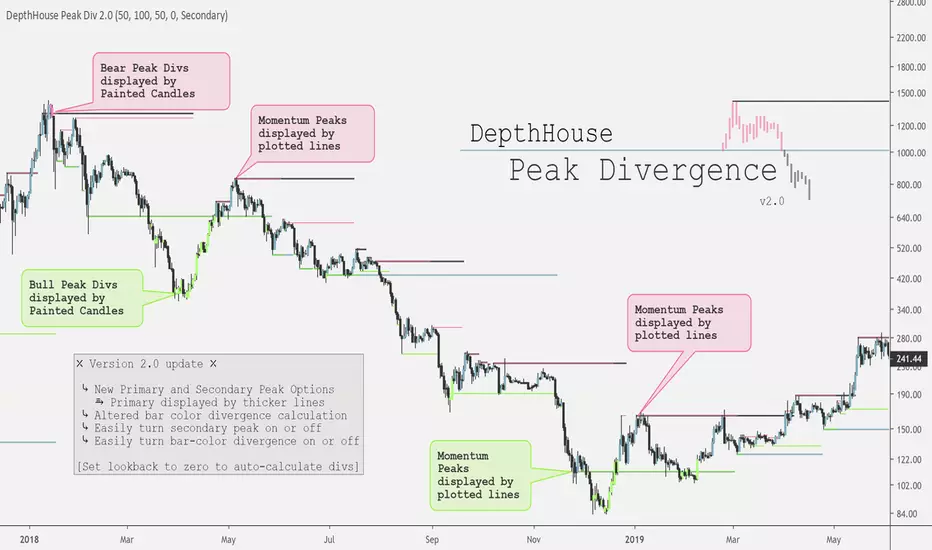
DepthHouse - Peak DivergenceDepthHouse - Peak Divergence indicator uses the same linear regression calculation as my Peak Momentum Oscillator to help determine and plot peak momentum points.
These peak levels are then plotted by either red or green lines above or below the candle.
Red lines represent a peak in bear momentum while green represents peaks in bull momentum.
These levels are then used to determine momentum divergence in the displayed market.
If divergence is present the bars colors will change represent either bull or bear div.
Important Notes:
If the price crosses a peak line and the bar color does not change; it means momentum has increased/decreased with the price and the divergence has been canceled.
If divergence is present, and then the following candle is not colored then momentum has increased to cancel the previously present divergence.
By default, the look-back period is set to zero , which automatically calculates the distance for the peak levels to look-back. However this number can be set to whatever look-back period you would like.
At time of release this indicator is in its early stages. So please leave feedback on how it can be improved!
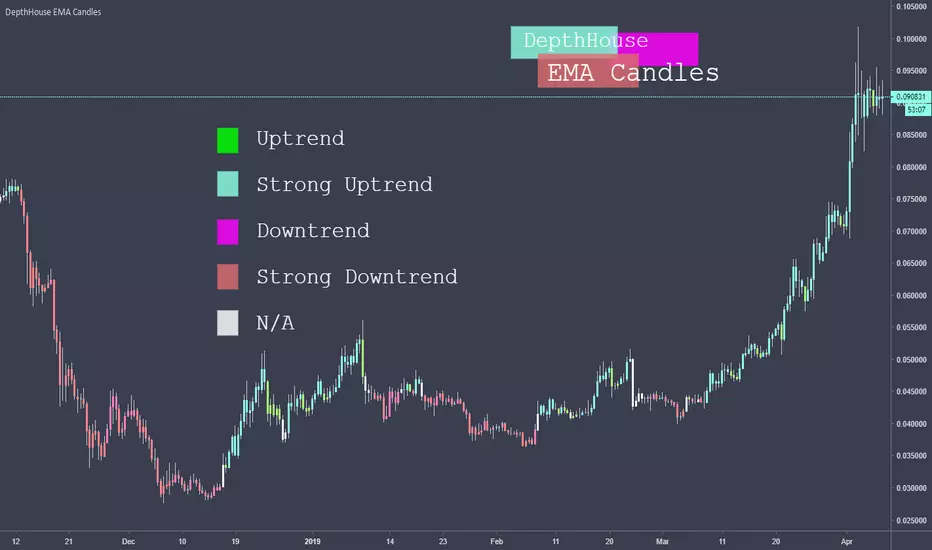
DepthHouse Exponential CandlesThis EMA Candles indicator use the price movement between two user selected Exponential Moving Averages to help determine the current trend.
As of release, there are 5 possible bar color outputs, all of which are shown in the legend above.
The Five Electable Color Outputs:
Uptrend; Strong Uptrend; Downtrend; Strong Downtrend; n/a
I hope you all enjoy!
Please leave your suggestions in the comments below!
ATRMSRATRMSR
MTF ATR Horizontal S/R deviations
MTF ATR trailing stops
MTF ATR High/low
Will be updated soon.
V.01

UMMLMurray math with options to calculate wicks for readjusting of "Frame" ,mtf support to select desired period lines without switching time frames, Fractal and mtf fractal support ,option to keep just extreme deviations, UMML expands and contracts differently than similar scripts in volatile periods and are easily configurable by users for size,style and reactivity of lines
previous version hosted in link below
The Grid
indicator isnt finished yet as smoothening for line expansion and contractions is still being worked on alongside function to average the lines for short-median-long tf in MTF grid mode
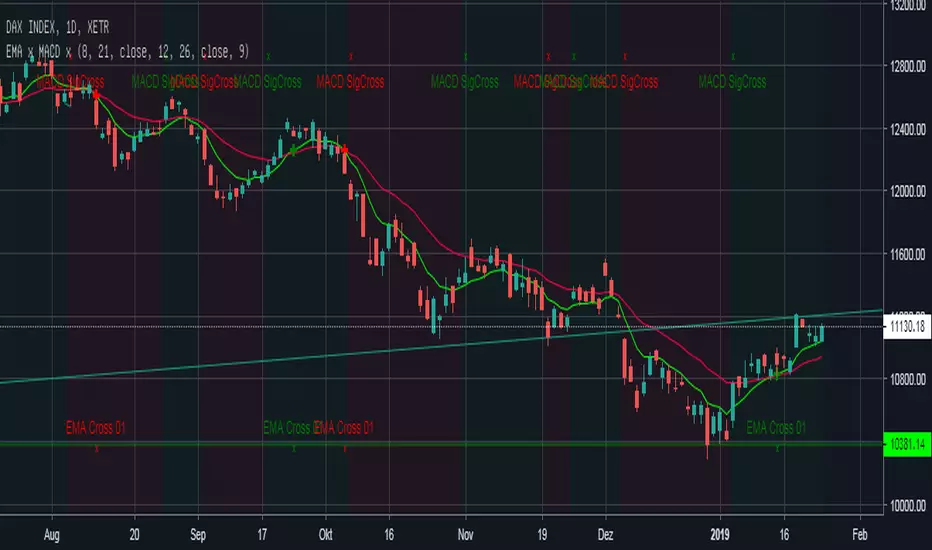
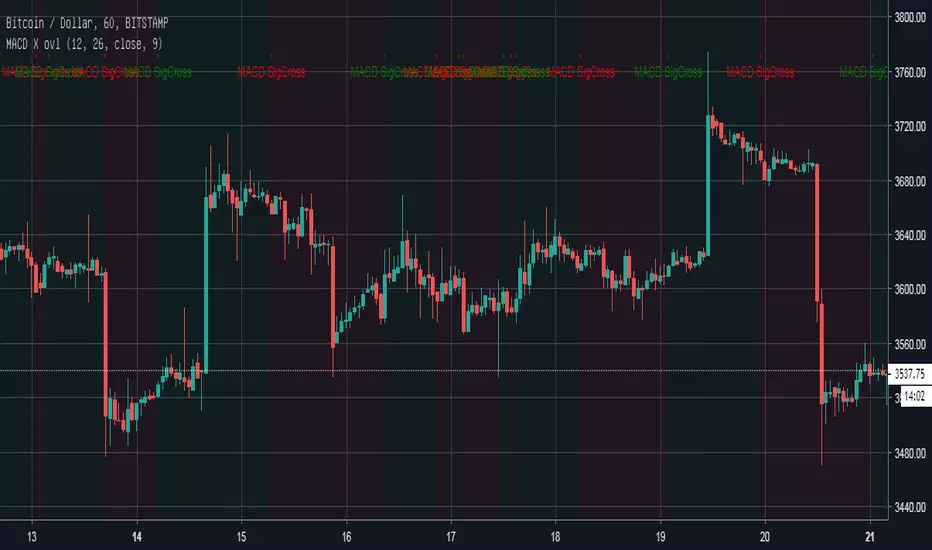
EMA Cross + MACD Signal Cross overlay Einfacher EMA-Cross Indikator mit Indikation der Crosses auf EMA-Linie und am Chart-Bottom +
MACD-Cross wird default an: location.top angezeigt zusätzlich zeigt die Hintergrundfarbe an ob der MACD über (grün) oder unter (rot) seinem Signal liegt.

Historical Point and Figure BoxesThis indicator plots the last filled/completed Point and Figure block, overlaid onto any regular candles chart, for every historical candle.
The Pine security(pointfigure(...)...) function inappropriately associates the timestamps of both the "open" (start of column) and "close" (end of column) with the time at which the terminal reversal took place, which leads to invalid overlays when plotted over top of regular candles charts, regardless of barmerge.lookahead_on/off. This script solves that problem and plots each brick at the time it was confirmed.
V24: Released.

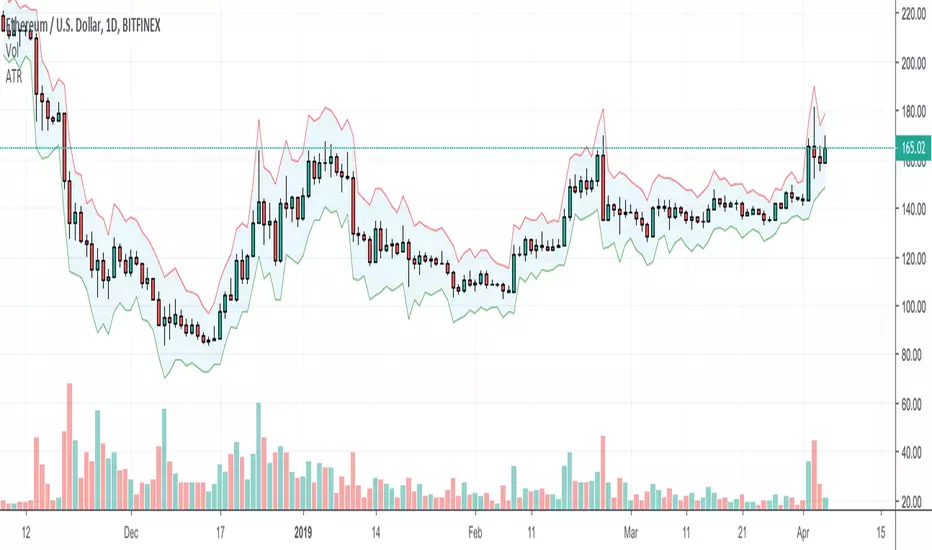
Enhanced Donchian Channel OverlayThis is my first public release of an indicator, free for all to use. There will be a multitude of indicators significantly more complex in the future, still under testing. It's simple purpose is to track highest high in red and lowest low in lime over a specified period of 5 preceding bars by default. The upper and lower banding have independent adjustable period settings. The banding line widths are also adjustable. A smoothable mean line is displayed in olive color and may be disabled by altering the line width to zero. I also included a yellow close line capability disabled by default by it's line width. I presume most people use candles but an occasional few may wish to see a close line plot too. Please provide any feedback/requests as you wish.

Responsive Comparison Line by SymbolThis script allows you to specify a security to overlay on your chart when viewing a certain symbol. The line will only show on that symbol, change symbols and it will disappear. I found that adding more than 4 lines will slow load time significantly, however if you can code it to be faster please let me know!
All credit to @gyromatical, a good samaritan.

Ichimoku DoubleTF overlay
Hello guys, this code allow to overlay a second ichimoku over the first one loaded on the used time-frame.
It's simple.
Choose your preferred Time-frame.
Set the Time-frame for the second Ichimoku in the settings menu .
Now you can see two Ichimoku clouds based on two different time-frame.
It can be very usefull and more ordered of a multi-windows layout.
On second Ichimoku the Chikou-span is omitted 'cause i think that is useless and cumbersome.
To help to reading the graph i set two labels to identify the "2nds" tenkan and kijun.
Tell me if this script was useful and remember to follow me and adding a like.
Available combinations:
DAILY: WEEKLY AND MONTLY
4H: WEEKLY, DAILY
1H: WEEKLY, DAILY, 4H
30m: DAILY, 4H, 1H
15m: DAILY, 4H, 1H, 30m
5m: DAILY, 4H, 1H, 30m, 15m
3m: 1H, 30m, 15m
1m: 1H, 30m, 15m,5m,3min
Thanks, bhutano
*****************************************************************************************************
Ciao ragazzi, questo codice permette di sovrapporre un secondo Ichimoku a quello del time-frame utilizzato.
Scegliete il vostro time-frame preferito.
Impostate il time-frame del secondo Ichimoku dalle impostazioni dello script .
Adesso vedrete due Nuvole Ichimoku basati su due time-frame diversi.
Può essere davvero utile e più ordinato di un layout multi-window.
Sul secondo Ichimoku la Chickou è stata omessa perchè penso che sia inutile e ingombrante.
Per aiutare la lettura del grafico ho impostato due etichette per identificare le seconde tenkan e kijun.
Ditemi se questo script vi è stato utile e ricordatevi di seguirmi e aggiungere un mi piace.
Combinazioni possibili:
DAILY: WEEKLY AND MONTLY
4H: WEEKLY, DAILY
1H: WEEKLY, DAILY, 4H
30m: DAILY, 4H, 1H
15m: DAILY, 4H, 1H, 30m
5m: DAILY, 4H, 1H, 30m, 15m
3m: 1H, 30m, 15m
1m: 1H, 30m, 15m,5m,3min
Grazie, bhutano

Seven Simple Moving AveragesBy default, this script overlays seven simple moving averages (5, 10, 20, 50, 100, 150, 200) and allows you to customize the SMA values as you wish. If a candle closes at or above a moving average, the plot for that SMA is colored green for that candle otherwise it's red.


RIZ - Alpha Cross - Updated Version & For Students OnlyThis is the updated version of the RIZ - Alpha Cross indicator/overlay.
it is ONLY available to Riz International Stock Trading Mentoring Students.
You can check out our website to see what we offer:
rizinternational.com
Thanks,
Riz

Impulse Volume Emiliano Mesa OscillatorThe impulse volume overlay, is the 1st part of my 2 part volume impulse indicator. The indicator has the sole purpose of measurearing a signifcant increase in the volume of either sellers or buyers and with the the help of a signal line suggest when there is an impulse in any of them.
How it works:
Yellow == No impulse... Market will most probably follow the trend
Red == Market has a seller increase
Lime == Market has a buyer increase
I DO NOT TAKE RESPONSABLITY FOR LOSSES. USE INDICATOR UNDER YOUR OWN RISK

Impulse Volume Emiliano Mesa OverlayThe impulse volume overlay, is the 2nd part of my 2 part volume impulse indicator. The indicator has the sole purpose of measurearing a signifcant increase in the volume of either sellers or buyers and with the the help of several EMA lines giving perfect entries. Results are very promising even in FOREX market... For now it has only been tested in 5 min charts.
How it works:
1) Check either if the price is in a down or up trend. So if the price is under both 100 and 200 EMA its down, and viceversa
2) If you have a down trend, wait for the overlay indicator to highlight the bars green, when the highlight stops enter a selling position, it is suggested you calculate your stop loss with the ATR. If the trend was going up, do the same with the red highlight.
3) Exit position when you feel like it, furthermore a trailing stop is suggested in order to maximize profit.
I DO NOT TAKE ANY RESPONSABILITY FOR LOSSES. USE INDICATOR UNDER YOUR OWN RISK.
Better Volume - a separate, non-overlaid volume indicatorHey guys
Coming at you again with a very simple script for displaying volume that is not overlaid on the price chart. This volume is in a separate indicator window for when you don't want the volume to get in your way. Bonus: default colors are color matched to default volume indicator (can be changed in the "Style" tab under settings). Includes the moving average as well, with the option to hide it if desired
Inspired by @tradedevils

RSI Overbought/Oversold OverlayDo you love RSI Overbought/Oversold signals, but want more space on the screen for the actual price chart? "RSI Overbought/Oversold Overlay" to the rescue! This indicator highlights the chart's background color green when the RSI goes overbought and red when the RSI goes oversold. You can set the RSI length, overbought level, and oversold level in the format box.
Obviously, this is not the indicator to use if you're looking for things like RSI divergence, but if you're only interested in when RSI reaches the extremes of the range, this can save you some screen real estate.