On Balance Volume - Color Packed Patch'emOBV is provided as a built-in by TradingView.
This contribution grew out of reading about trend discovery, and since the library kept on this end was lacking in a volume-centric indicator, it looked like a good time to play around.
This approach isn't all that much different than many others with the possible exception of its color scheme.
Should you decide to use the script, it might be worth your while to work with the logic of color and line, to produce alerts.
Enjoy.
온밸런스볼륨 (OBV)

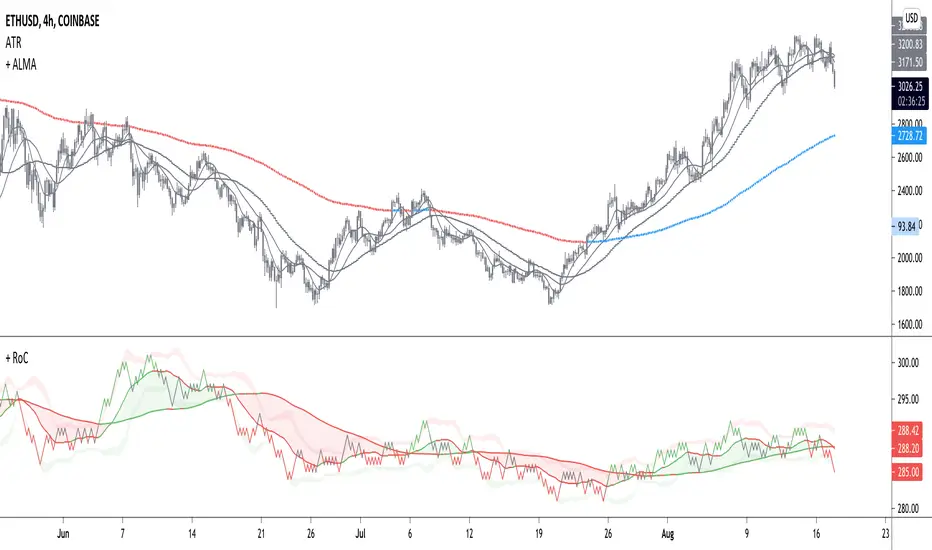
+ Rate of Change (and OBV)The Rate of Change, or RoC, is a momentum indicator that measures the percentage change in price between the current period and the price n periods ago. It oscillates above and below a zeroline, basically showing positive or negative momentum. I applied the OBV's calculation to it, but without the inclusion of volume (also added a lookback period) to see what would happen.
Actually what happened was I was looking at hot-rodding the OBV indicator, but then wondered if I could apply the cumulative calculation to another indicator to see what would happen. Not sure why I chose the Rate of Change, but it seemed a neat idea. And it worked! And so I called it the "Cumulative Rate of Change." I only recently realized that this is actually just the OBV without volume, HOWEVER the OBV does not have a lookback period, and its source is the close of each period. Basically, when you look at the calculation for the OBV you'll notice that it's a cumulative measure of the "change" of the closing price against the previous close times the volume. The Rate of Change is basically that measurement over more than one period, excluding the volume, and is not cumulative. Thus the "Cumulative Rate of Change" is basically an OBV without the volume but with the capability to adjust the lookback period.
Anyway, after days and weeks of playing with the indicator pretty infrequently I did decide that I actually really liked it, especially with the addition of moving averages and bollinger bands. So I decided to play with it a bit more.
I added a drop-down menu to include the standard Rate of Change indicator, and then thought I may as well add the OBV too, in case someone might like to compare that to the C-RoC, or just wants an OBV with myriad moving averages and bollinger bands.
By default I have the indicator set to the "C-RoC" and the lookback is set to 1, but play with longer settings (this is pretty much necessary if using the traditional RoC, which is by default set to 10 in TradingView, and is nigh on useless at 1).
I also recommend playing with the source. 'Close' is nice, but 'ohlc4' provides some very nice signals as well, as it follows the price flow for each period completely, filtering the noisiness of 'close' as source.
Hope you guys like this. With the bollinger bands and your preferred moving average settings this can be a powerful tool for re-entering trades in trend, taking profits, determining momentum swings.
Forex bot full strategy with risk managementThis is a full strategy designed for forex major pairs, specially EUR/USD using 1h time frame chart.
Its components are
200 EMA
MACD
OBV
PSAR
RIsk management with tp and sl movements
Rules for entry
For long = Previous histogram from MACD was below 0 and current one is above 0. CLose of a candle is above EMA 200 , OBV oscillator is negative and we have an uptrend from PSAR
For short = Previous histogram from MACD was above 0 and current one is below 0. CLose of a candle is below EMA 200 , OBV oscillator is positive and we have an downtrend from PSAR
Rules for exit
For tp and sl values we calculate the distance from the close of candle until the psar values.
If you have any questions, let me know !

Advanced VolumeThis simple indicator improves upon the built in volume indicator by adding the following:
-Option to use an EMA instead of SMA
-Advanced Coloring: Lighter bars show growing volume, darker bars show falling volume. Gray bars show very low relative volume (less than or equal to 50% of the moving average), while bars which have a highlighted background have a high relative volume( you can choose the threshold level, default is 2 times the RVOL).
Enjoy!

Cumulative Volume OscillatorCVO: Cumulative Volume Oscillator allows you to choose between 3 types of oscillators based on volume indicators:
-OBV (On Balance Volume)
-CVD (Cumulative Volume Delta)
-PVT (Price Volume Trend)
Being a volume based oscillator this indicator allows for the detection of divergences between price action and volume, ideal for predicting reversals.
As an oscillator you can choose the length of the fast & slow EMAs, and a signal line is provided for trend following.

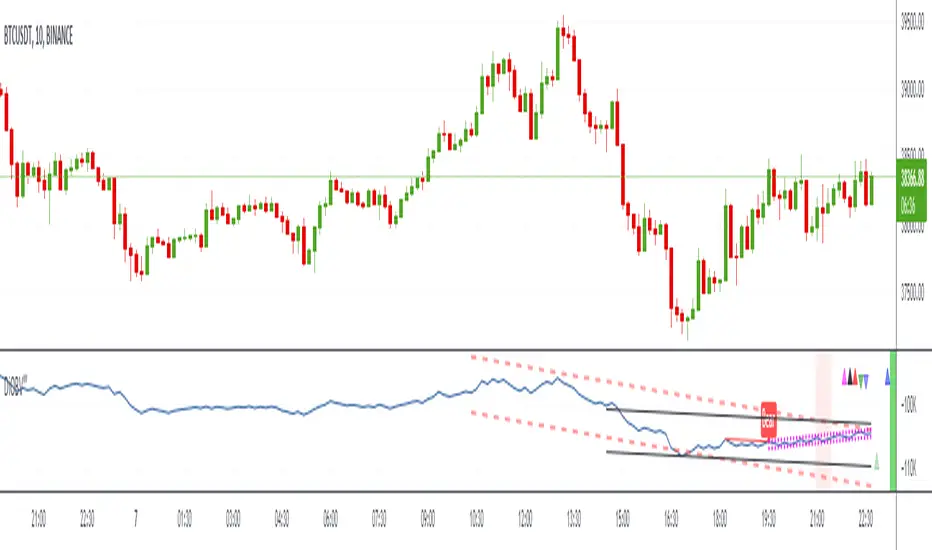
DI-OBV‴ | Divergence Indicator OBV‴What does it do?
Does the same as the ordigary OBV, but it has embeeded the 4TC indicator that provides trending channels that helps understand the strength of direction changing and divergencies with the price.
How does it work?
Works the exact same way as the ordinary OBV, but trending channels are drawn in order for you to see the OBV movement and potential reversal movements. Only 2 channels are drawn but you can activate the other 2 and also change their timeframes.
All channel directions are plotted in triangles on the top of the indicator frame which shows their direction (up or down).
The light red background shade signals that Volatility is activated and that price spread and volume are to be expected
What's my filling?
Helps confirm the volume movement and potential reversal and/or direction, as well as the divergency with price.
To have access to this indicator, please DM me.
Don't contact me in the comment area.
Trigonometric On Balance Volume (OBV) OscillatorLove volume analysis but it's hard for you to implement a simple strategy by it?
Use OBV.
Is OBV still not quite as it should be for you to get it in your trading system?
Use OBV Oscillator.
Does OBV Oscillator give you too many false signals and when you smooth it, it lags by a ton?
Then this indicator is the answer to your problem.
Introducing the Trigonometric OBV Oscillator.
The Trigonometric OBV Oscillator or "Trig OBV" for short, uses an old, but uniquely extremely reliable mathematical formula to smooth the OBV, while eliminating more than 95% of its false signals (noises) and keeping with the real direction of the trend without introducing any lags.
It is very responsive, predictive even to some degree, very reliable, and keeps you out of false trades (like false breakouts, sudden changes in the price, etc).
To go long: wait until the white line crosses up the purple line and continues in that direction.
To go short: wait until the white line crosses down the blue line and continues in that direction.
To exit, do the opposite.
Better to be used with a baseline filter such as Kaufman's moving average.
Use it and let me know what you think about it.

OBV High / LOW (On-Balance Volume )This is a simple application of OBV indicator (On-Balance Volume ), to visually determine when a given stock current obv is near the highest or lowest based on the number of lookback bars.
Indicator examples:
### OBV value is near an all-time high ##
breakthrough , stock value could set new all-time highs.
rejection , stock value could come down or consolidate.
Example
Inputs
OBV High Lookback -> numbers of bars to look back for the obv high.
OBV LowLookback -> numbers of bars to look back for the obv low.
OBV EMA Length -> Ema length
Notes:
This script also comes with an ema indicator based on obv for smoothing the obv signal since it gets noise at lower timeframes (by default comes disabled)
OBV information
www.investopedia.com
Comments:
This is my first script any ideas, suggestions, or detected errors (language/script) don´t hesitate to send a message.
Best regards, Mauro.

OBV+ (Div/Trends) [Anan]Hello friends,
As you requested, this is my own version of OBVwith these features:
- Plot various types of moving averages ("SMA","Smooth SMA","SuperSmooth MA","EMA","DEMA","TEMA","Triangular MA","QEMA","RMA","Hull MA","KAMA","WMA","VWMA","CTI","LSMA","VIDYA","Blackman Filter","Adaptive RSI","Probability")
- Change the length of moving average
- Change the Source of OBV
- Bullish/Bearish Regular/Hidden divergences
- Trend lines on OBV

On Balance Volume HLOC with AverageI am playing OBV now.
The original OBV is only calculate CLOSE.
I got an idea about XOBV with HLOC.
A bar has 5 periods:
- Open--Low--Open--Close--High--Close or
- Open--High--Open--Close--Low--Close
Assume that volume will evenly distributed on these 5 periods. Only Open--Close period has effective changed volume.
So XOBV = OBV * abs(close-open)/(2*(high-low)-abs(close-open)))
Better use XOBV and OBV both. Divergence and same price comparison are worth to watching.

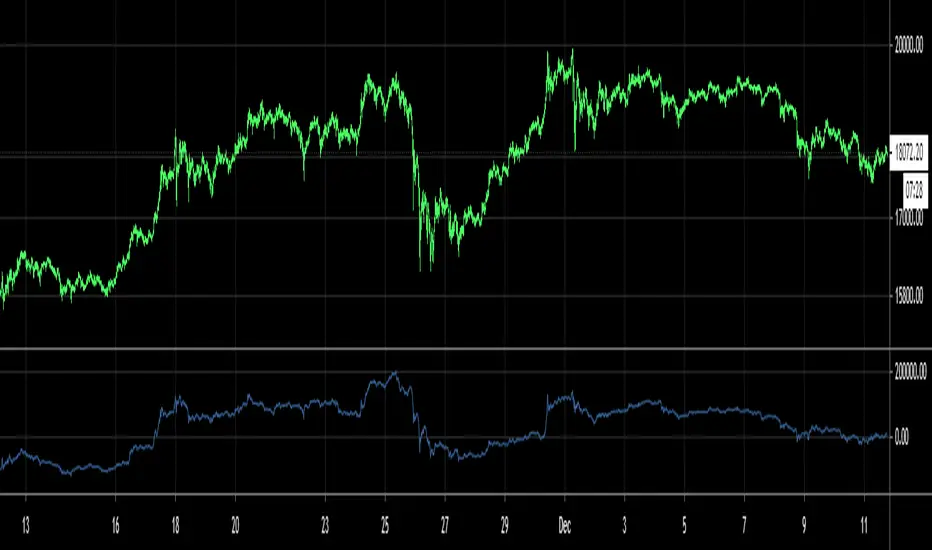
SB On Balance Profit/Loss IndicatorI was always interested in volume indicators as well as market sentiment.
While brainstorming, I came to the thought that people with gains vs people with losses can move a stock up or down.
I don't want to debate the rational behind people buying and selling based on profits or losses, so this isnt a signaling indicator.
However, I still wanted to have a way to measure and visualize this information.
On Balance Volume was not enough for me. I wanted to know how much actual money was made or lost, over time.
This indicator was created based on two different time periods, the daily and the 30m.
The daily time period is used to measure money made from close of the day before to the open of the current day (gap up/down).
The 30 minute precision period is used to measure the money made from the close of the current bar from the close of the bar prior and calculated 13 times per trading session.
There is an option for 15 minute and 5 minute precision, but it may take longer for the script to process and may time out at lower precision periods.
The default lookback period is 10 days, values are cumulative. We can clearly see over the last 10 days how much money was made, lost and on balance. This should affect trader sentiment.
Visual display is the cumulative money made (green line), cumulative money lost (red line), and cumulative net on balance money (black line). The net on balance money is filled green above zero and filled red below zero.
The Green Histogram is the money made overnight, the Red histogram is the money lost overnight.
The black histogram above zero is the money made intraday and the black histogram is the money lost intraday.
Takeways
Just because a stock is trending down, as noted by the downward slop in price on the daily chart , it does not mean that the average trader is losing money. Intraday price action can offset money lost at higher time periods.
Especially in cases where a stock gaps down overnight, buyers step in at the low and the stock closes above open, but below previous days close. Esspecially when this is done on high volume .
The net profit can be greater than net loss, even if the day closes down from previous close. This can really help with "sentiment" and being able to visualize this sentiment may be helpful in making a decision to buy or sell.
View my collection of custom scripts at: www.tradingview.com

Bollinger Bands OBVBB OBV is a Volume-based indicator that shows the balance and performance of the market.
Spots Support and Resistance levels within a growth/decline cycle.
Can be used for different Time Frames.
Length can be changed to a bigger number to adjust it to the smaller TF.

Structure AnalyzerA momentum indicator that uses the highest and lowest values for price in three different lookback lengths to find the performance relative to three timeframes.
- The yellow line is the product of the price performance in three different timeframes.
- The red line is 200 EMA of the performance.
- The blue columns represent the same calculation or the volume(OBV based).
- The aqua line is the 200 EMA of the volume performance.
How to use: Whenever the performance crosses above the 200 EMA, the price is in an uptrend.
Important: When in a downtrend, the performance will stay below the 200 EMA for a long time; hence it is important o wait until the crossover.

PRIME - R.o.c.M Ind. W/ TrendsThis experimental script is a variant of a model that allows a separate indicator window to be opened, revealing data for on balance volume, rsi, consumer commodity index and momentum indications. By use of the settings key, you can change the parameter of the source input as well as the desired lengths. After data compilation, the indicator will automatically draw any trend lines applicable to what is presented. The additional code is an attempt to allow the system to apply pivot points for alerts within the indicator itself.
Disclaimer:
Trading success is all about following your trading strategy and the indicators should fit within your trading strategy, and not to be traded upon solely
The script is for informational and educational purposes only. Use of the script does not constitute professional and/or financial advice. You alone have the sole responsibility of evaluating the script output and risks associated with the use of the script. In exchange for using the script, you agree not to hold the publishing TradingView user liable for any possible claim for damages arising from any decision you make based on use of the script

On Balance Volume + Trend + DivergencesModification of original OBV indicator, with addition of Divergences identification & coloring OBV Line based on line (OBV either above or below EMA20 applied to OBV). Indicator works great in correlation with Volume, Stochastic and DMI and shows potential reversals earlier.

Volume Correlation Indicator [Fournier-Eaton]This script combines two correlation indicators into one:
Volume Oscillator Correlation
Price Correlation
Rationale : This script is predicated on the following premise: we rely often on price correlation. However, we overlook volume-volume correlation too often. The volumetric correlative decoupling of an equity and index or equity - equity can yield important information (and produce it as early or earlier than price-correlation).
Mechanism :
The primary component of this chart is the Volume Correlation Indicator (as red histogram). This is the correlation between the Volume Oscillator of current chart's symbol and the VO of your chosen comparison.
Secondarily, the standard price correlation is also charted for added information in line format.
Example : In the chart attached to this publication, note the following cases:
Case 1: The price correlation with QQQ was increasing as earnings approached. However, the volume correlation with QQQ was clearly decoupled as earnings approached.
Case 2: Contrastingly, other dips in price correlation can be found were volume correlations were behaving in tandem.
Note1: This is the first in a series of volume correlation indicators. Please let me know if you find this useful.

Better OBVOBV with William C. Garrett's Approximation
In the classical OBV (On-Balance Volume) indicator, it simply takes the idea from traditional tape reading - treat the "up tick" as Buy, "down tick" as Sell, and it assumes no change in price as neutral* (*which is not the case in tape reading).
When it comes to interpret the daily volume as such, errors will add up cumulatively. For example, there are days when a Doji Star with high volume just merely one cent higher than yesterday price and the whole day volume would be taken as a BUY Volume....
Here is a gentlemen, William C. Garrett, attempted to break down the daily volume into two parts in his book - "Torque Analysis of Stock Market Cycle".
Published indicator has two modes: Cumulative and Time Segmented. Time Segmented Volume (TSV) - performs a MACD operation on the Garrett Money Flow.
Note on Divergence:
When using a indicator as Time Segmented Money Flow, divergence would surely occur on and off. This is where Wyckoff 3rd principle comes into play - "Effort vs Result" that is not matching. Meaning that the cumulation of shares goes in one direction while the price goes another direction.

Pivot OBV Reset [LM]Hi traders,
I woud like to introduce new script of obv indicator that resets on creation of new pivot high or low. Note that it resets when it's known that it is a pivot. On the reset candle adds accumulated value from previous candles defined by i_right input.
It has following settings:
pivot setting - here you can infulence pivot detection
obv setting - here you can influence whether it should be multiplied by price or not, if it should show when the reset happen
Hope you'll enjoy it

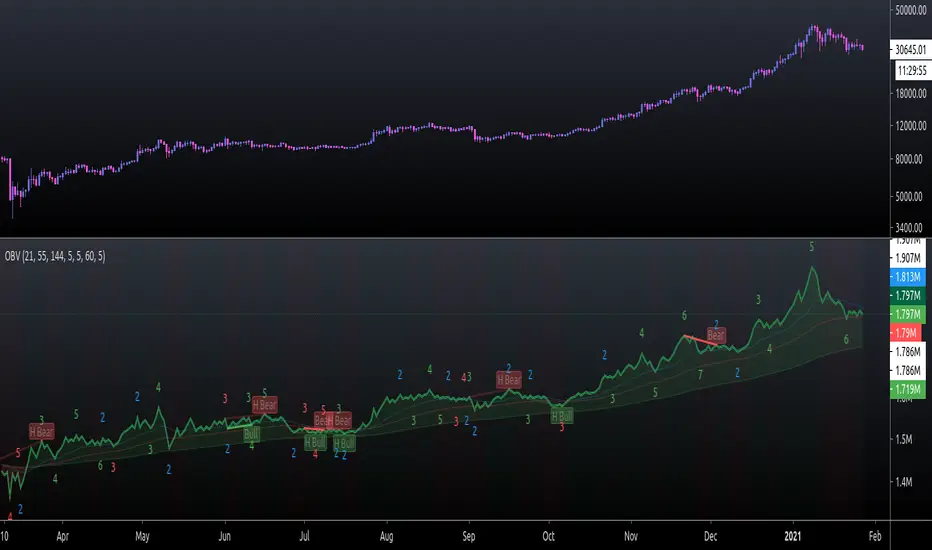
On Balance Volume FieldsThe On Balance Volume (OBV) indicator was developed by Joseph E. Granville and published first in his book "New key to stock market profits" in 1963. It uses volume to determine momentum of an asset. The base concept of OBV is - in simple terms - you take a running total of the volume and either add or subtract the current timeframe volume if the market goes up or down. The simplest use cases only use the line build that way to confirm direction of price, but the possibilities and applications of OBV go far beyond that and are (at least to my knowledge) not found in existing indicators available on this platform.
If you are interested to get a deeper understanding of OBV, I recommend the lecture of the above mentioned book by Granville. All the features described below are taken directly from the book or are inspired by it (deviations will be marked accordingly). If you have no prior experience with OBV, I recommend to start simple and read an easy introduction (e.g. On-Balance Volume (OBV) Definition from Investopedia) and start applying the basic concepts first before heading into the more advanced analysis of OBV fields and trends.
Markets and Timeframes
As the OBV is "just" a momentum indicator, it should be applicable to any market and timeframe.
As a long term investor, my experience is limited to the longer timeframes (primarily daily), which is also how Granville applies it. But that is most likely due to the time it was developed and the lack of lower timeframe data at that point in time. I don't see why it wouldn't be applicable to any timeframe, but cannot speak from experience here so do your own research and let me know. Likewise, I invest in the crypto markets almost exclusively and hence this is where my experience with this indicator comes from.
Feature List
As a general note before starting into the description of the individual features: I use the colors and values of the default settings of the indicator to describe it. The general look and feel obviously can be customized (and I highly recommend doing so, as this is a very visual representation of volume, and it should suit your way of looking at a chart) and I also tried to make the individual features as customizable as possible.
Also, all additions to the OBV itself can be turned off so that you're left with just the OBV line (although if that's what you want, I recommend a version of the indicator with less overhead).
Fields
Fields are defined as successive UPs or DOWNs on the OBV. An UP is any OBV reading above the last high pivot and subsequently a DOWN is any reading below the last low pivot. An UP-field is the time from the first UP after a DOWN-field to the first DOWN (not including). The same goes for a DOWN field but vice versa.
The field serves the same purpose as the OBV itself. To indicate momentum direction. I haven't found much use for the fields themselves other than serving as a more smoothed view on the current momentum. The real power of the fields emerges when starting to determine larger trends of off them (as you will see soon).
Therefor the fields are displayed on the indicator as background colors (UP = green, DOWN = red), but only very faint to not distract too much from the other parts of the indicator.
Major Volume Trend
The major volume trend - from which Granville says, it's the one that tends to precede price - is determined as the succession of the highest highs and lowest lows of UP and DOWN fields. It is represented by the colors of the numbers printed on the highs and lows of the fields.
The trend to be "Rising" is defined as the highest high of an UP field being higher than the highest high of the last UP field and the lowest low of the last DOWN field being higher than the lowest low of the prior DOWN field. And vice versa for a "Falling" trend. If the trend does not have a rising or falling pattern, it is said to be "Doubtful". The colors are indicated as follows:
Rising = green
Falling = red
Doubtful = blue
ZigZag Swing count
The swing count is determined by counting the number of swings within a trend (as described above) and is represented by the numbers above the highs and lows of the fields. It determines the length and thus strength of a trend.
In general there are two ways to determine the count. The first one is by counting the swings between pivots and the second one by counting the swings between highs and lows of fields. This indicator represents the SECOND one as it represents the longer term trend (which I'm more interested in as it denotes a longer term perspective).
However, the ZigZag count has three applications on the OBV. The "simple ZigZag" is a count of three swings which mainly tells you that the shorter term momentum of the market has changed and the current trend is weakening. This doesn't mean it will reverse. A count of three downs is still healthy if it occurs on a strong uptrend (and vice versa) and it should primarily serve as a sign of caution. If the count increases beyond three, the last trend is weakening considerably, and you should probably take action.
The second count to look out for is five swings - the "compound ZigZag". If this goes hand in hand with breaking a major support/resistance on the OBV it can offer a buying/selling opportunity in the direction of the trend. Otherwise, there's a good chance that this is a reversal signal.
The third count is nine. To quote Granville directly: "there is a very strong tendency FOR MAJOR REVERSAL OF REND AFTER THE NINTH SWING" (emphasis by the author). This is something I look out for and get cautious about, although I have found signal to be weak in an overextended market. I have observed counts of 10 and even 12 which did not result in a major reversal and the market trended further after a short period of time. This is still a major sign of caution and should not be taken lightly.
Moving average
Although Granville talks only briefly about averages and the only mention of a specific one is the 10MA, I found moving averages to be a very valuable addition to my analysis of the OBV movements.
The indicator uses three Exponential Moving Averages. A long term one to determine the general direction and two short term ones to determine the momentum of the trend. Especially for the latter two, keep in mind that those are very indirect as they are indicators of an indicator anyway and I they should not necessarily be used as support or resistance (although that might sometimes be helpful). I recommend paying most attention to the longterm average as I've found it to be very accurate when determining the longterm trend of a market (even better than the same indicator on the price).
If the OBV is above the long term average, the space between OBV and average is filled green and filled red if below. The colors and defaults for the averages are:
long term, 144EMA, green
short term 1, 21EMA, blue
short term 2, 55EMA, red
Divergences
This is a very rudimentary adaption of the standard TradingView "Divergence Indicator". I find it helpful to have these on the radar, but do not actively use them (as in having a strategy based on OBV/price divergence). This is something that I would eventually pick up in a later version of the indicator if there is any demand for it, or I find the time to look into strategies based on this.
Comparison line
A small but very helpful addition to the indicator is a horizontal line that traces the current OBV value in real time, which makes it very easy to compare the current value of the OBV to historic values (which is a study I can highly recommend).
OBV Accumulation / Distribution Strategy CryptoThis version its made for 8-12h and works amazingly on the ETH pairs. Can be adapted to others as well
For this example, I used an initial 1$ account, using always full capital on each trade(without using any leverage), together with a 0.1% commission/fees for each deal, on Coinbase broker.
This is a long only strategy
The components for the inside of the strategy are the next one :
1. OBV Accumulation/Distribution
3. EMA
The rules here are simple : we check for cross up or above on OBV and EMAmoving average and after that we check for the trend direction based on ascending/descending OBV. Based on this we enter long or exit long.
RISK WARNING
Trading on any financial market involves a risk of loss. Please consider carefully if such trading is appropriate for you. Past performance is not indicative of future results.
If you have any questions or you are interested in trying it, private message me and I will give you as soon as I see the message a trial for it.

Pure Volume Divergence [NeoButane]PVD: MACD with volume as source.
Options to configure:
OBV, PVT, or MFI as source
Display PVD or a faux zero-based oscillating CVD

[A618] Liquidity Levels Based OBV SR with KAMAWe all know OBV plays a very important role in figuring out price volume divergences and it can help anyone analyse the directivity force of the market and has a very good tradeoff if applied correctly
In this Experiment i have derived liquidity levels for OBV using volume jumps inside the market
A volume jump is classified as:
Good Volume Jump = 1.618 times the Average Volume (WMA or 2pole ButterWorth's Filter of Volume)
Great Volume Jump = 2 times the Average Volume (WMA or 2pole ButterWorth's Filter of Volume)
Extreme Volume Jump = 3 times the Average Volume (WMA or 2pole ButterWorth's Filter of Volume)
So the horizontal levels which you see on the indicator (colored in red/ blue / gray lines) are the derived Liquidity Levels for OBV in the Market, these are the levels where OBV is most likely to perform a movement or come back
Also I have applied KAMA indicator on top of OBV for better Directive guidance, as of my experiments KAMA seems to be most stable and consistence of all the other moving averages,
KAMA's Length inculde:
KAMA - 8
KAMA - 34
KAMA - 200
Hope this Script help you guys!
Thanks to Tradingview for providing such an awesome platform
##Note for Credits ::
The Ehlers 2 pole butterworth Filter function is derived from @cheatcountry script ()