PMax on Rsi w/T3 *Strategy*Profit Maximizer Indicator on RSI with Tillson T3 Moving Average:
PMax uses ATR calculation inside, for this reason users couldn't manage to use PMax on RSI because RSI indicator doesn't have High and Low values in bars, but ATR needs that values. So I personally calculate RSI in a different way to have High and Low values of RSI wrt price bars.
IMPORTANT:
Because of the sudden movements and divergences on RSI , this indicator must firstly optimized for the charts before using. Optimization can be held by users for the meaningful parameters for each chart.
3 parameters are critical when optimizing:
First: Multiplier
Second: Tillson T3 Length
Third: T3 Volume Factor
Says, Kıvanç Özbilgiç. Here's the strategy version for you to backtest & optimize properly.
Enjoy.
무빙 애버리지

Swing High Low Price Channel V.1You should buy/sell small order at small plot zone or after small plot. And, Buy/sell big order at big plot zone or after big plot.
Recommended, You should use this with Fibonacci Retracement, Price Action or Graph Pattern.

Newton theory (Bollinger Band Breakout)Initial capital 1000 USD
Order size 10%
Commission 0.3% with slippage
Timeframe 4h
This is Simple Bollinger Band Trend find out strategy.
I'm using the usual trailing offset as an exit for this strategy.
using 1x leverage to go long short within 3years backtest result more then 200% for all usd pair.
in next version i will try to find out more optimize sma,std,sl,tp parameter by using freqtrade hyperparameter optimization.
Happy Trading :)

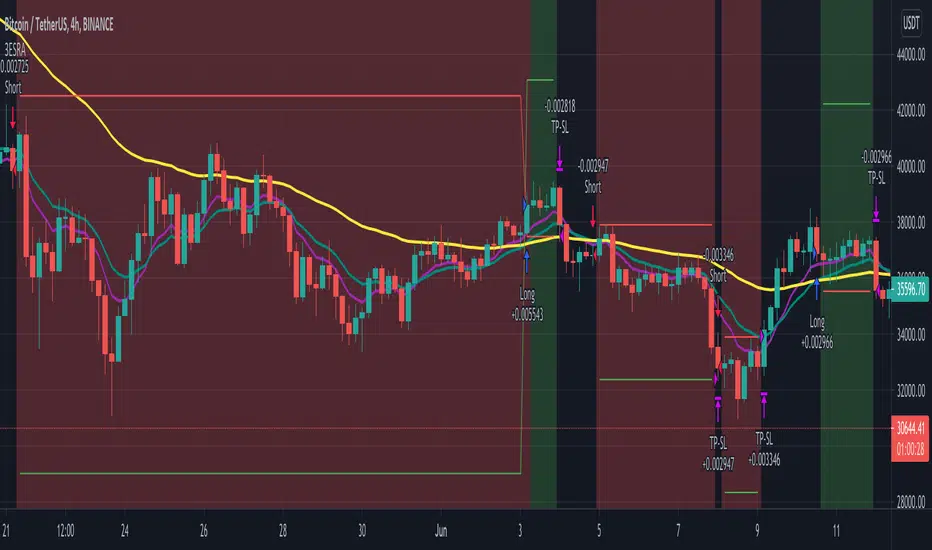
3 EMA + Stochastic RSI + ATR 3ESRA
v0.2a
Coded by Vaida Bogdan
3ESRA consists of a 3 EMA cross + a close above (for longs) the quickest EMA
or below (for shorts). Note that I've deactivated the RSI Cross Over/Under
(you can modify the code and activate it). The strategy also uses a stop loss
that's at 1 ATR distance from the entry price and a take profit that's at
4 times the ATR distance from the entry price.
Chandelier + BB + EMASIn this strategy I am using the Emas and bollinger bands' width to determine the entry conditions:
Objetive of emas: Determine the current market trend
BB: Avoid low volatility market periods
Chandelier: Exit trades
Long Condition:
Once the fast moving average turns above the slow ma is first signal
Entry into the trade if the width crosses above the threshold set up by the user
Short condition: Exact opposite to long condition
Current idea is using an suppose capital of 1000 USD and paying commissions of 0.2%.
Educational purposes only at the time.

PMA Strategy IdeaThis strategy idea uses three EMAs on HLC/3 data, know as PMA(Pivot Moving Average). This strategy is very useful in trending instruments on 1W and 1D timeframes. This is the implementation used in QuantCT app. The study version of this idea is published in public library as ACD PMA .
You can set operation mode to be Long/Short or long-only.
You also can set a fixed stop-loss or ignore it so that the strategy act solely based on entry and exit signals.
Trade Idea
When all EMAs are rising, market is considered rising (bullish) and the plotted indicator becomes green.
When all EMAs are falling, market is considered falling (bearish) and the plotted indicator becomes red.
Otherwise, market is considered ranging and the plotted indicator becomes orange.
Entry/Exit rules
Enter LONG if all EMAs are rising (i.e. when the plotted indicator becomes green).
Enter SHORT if all EMAs are falling (i.e. when the plotted indicator becomes red).
EXIT market if none of the above (i.e. when the plotted indicator becomes orange).
CAUTION
It's just a bare trading idea - a profitable one. However, you can enhance this idea and turn it into a full trading strategy with enhanced risk/money management and optimizing it, and you ABSOLUTELY should do this!
DON'T insist on using Long/Short mode on all instruments! This strategy performs much better in Long-Only mode on many (NOT All) trending instruments (Like BTC , ETH, etc.).

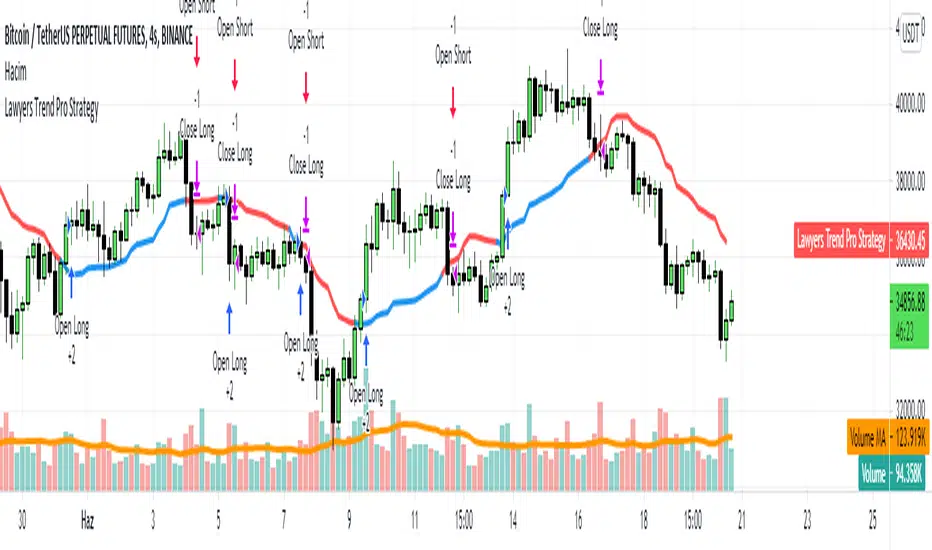
Lawyers Trend Pro StrategyThis indicator basilcy has 1 line
This indicator basicly using 2 different calculations average.
And you can see this average as line on this script.
This line has 2 functions
1. Buy and Sell Strategy
-İf the line colored BLUE this means you can BUY (Long)
-İf the line colored RED this means you can SELL (Short)
As you can see the picture you can buy-sell and long-short with this line
2. Support and Resistance Function
You can use the line as resistance and support.
You can see when you can LONG and when you can SHORT with this strategy.
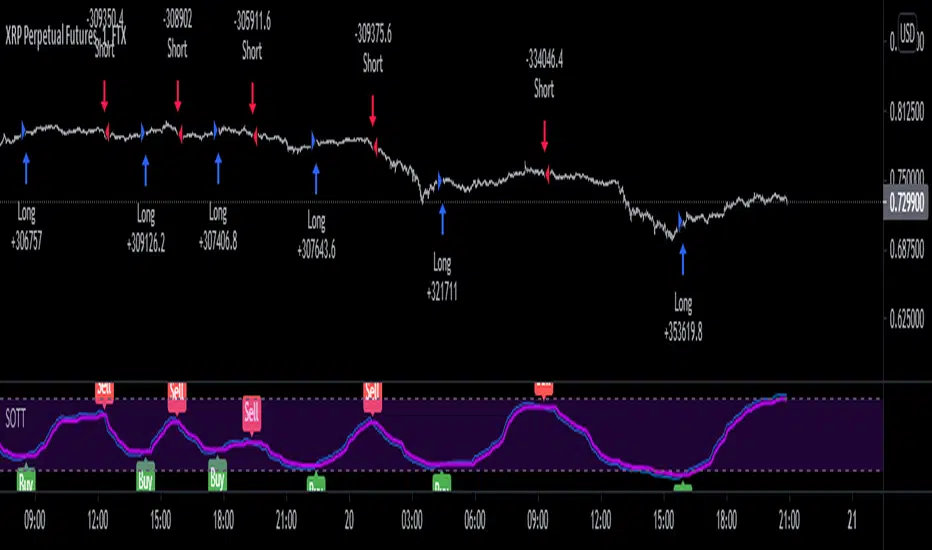
Stochastic Optimized Trend Tracker *Strategy*Stochastic OTT is Anıl Özekşi's latest derived version of Optimized Trend Tracker on Stochastic Oscillator.
He tried to solve the fake signals of Stochastic Oscillator by adopting OTT on the indicator.
He advised users to set the stochastic smoothing parameters to 500 and 200 on his latest video about SOTT.
He personally uses 1 min charts on stock market so the parameters of the indicator might have to be optimized for other time frames nad markets.
He exaggerated the Stochastic to 1000's to have better signals of percent values of OTT .
Also hes used VIDYA in both calculations of OTT and Stochastic smoothing.
Said, Kıvanç Özbilgiç.
I just made a Strategy version of the script so that we lads can backtest it. The codes for that are yet again from Kıvanç Özbilgiç :) I just copy-pasted a few and did some adjustments. Hope you enjoy!
#betonyetmez
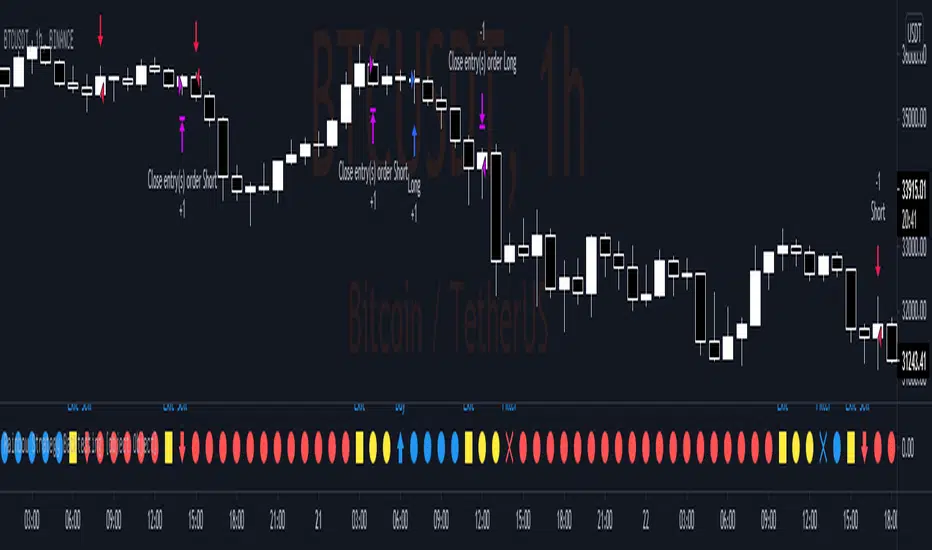
Rainbow Strategy BacktestingRainbow Strategy Backtesting base on "Rainbow Moving Average" Strategy as below:
1.Rainbow Moving Average setup
- Source: source of 1st MA
- Type: SMA/EMA
- Period: period of 1st MA
- Displacement: period of 2nd MA to 7th MA with source is previous MA
2.Trend Define
- Up Trend: Main MA moving at the top of Rainbow
- Down Trend: Main MA moving at the bottom of Rainbow
- Sideway: Main MA moving between the top and the bottom of Rainbow
3.Signal
- Buy Signal: When Rainbow change to Up Trend.
- Sell Signal: When Rainbow change to Down Trend.
- Exit: When Rainbow change to Sideway.
4.RSI Filter
- "Enable": Only signals have 1st RSI moving between Overbought and Oversold and 2nd RSI moving outside Middle Channel are accepted.
- The filter may help trader avoid bull trap, bear trap and choppy market.
5.Backtesting Infomation
- Ticker: BTCUSDT
- Timeframe: H1
- Rainbow parameter:
+ Source: hlc3
+ Type: SMA
+ Period: 12
+ Displacement: 3
- RSI Filter parameter:
+ Enable
+ 1st RSI filter: period 12, overbought 65, oversold 35
+ 2nd RSI filter: period 9, upper middle 56, lower middle 44
Know Sure Thing and EMA Strategy by JLXThis is a simple strategy based in Know Sure Thing indicator and an Exponential moving average,
Rules are as follow:
- You can go long when the KST cross signal bellow 0 and price closes above the target EMA
- You can go short when the KST cross signal above 0 and price closes bellow the target EMA
I include a trailing stop loss, default its 0.5%
Hope you enjoy it

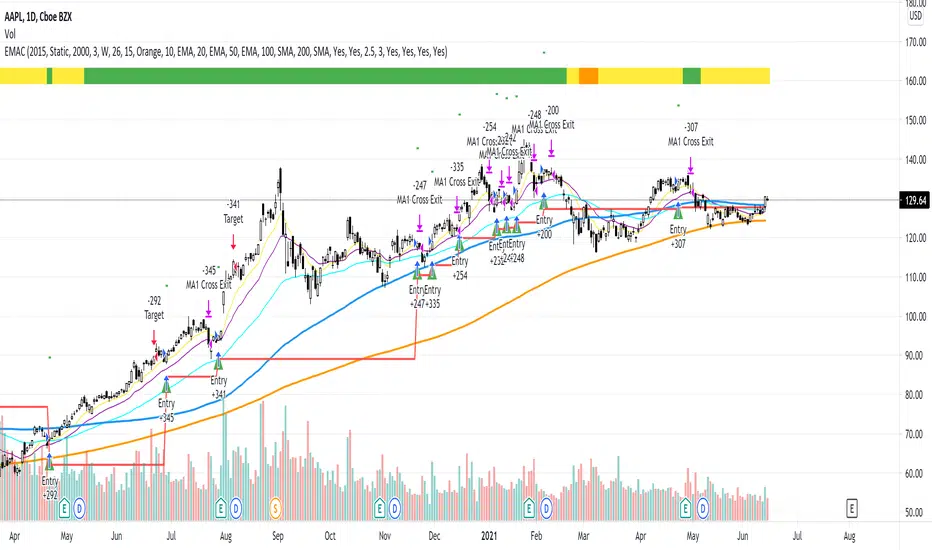
EMAC - Exponential Moving Average Cross - OptimizedEMAC - Exponential Moving Average Cross - Optimized
This is the full Strategy version with the best currently known optimized inputs with the average best settings across the following 26 tickers:
QQQ
TQQQ
SPY
SPXL
AAPL
AMZN
TSLA
BYND
CRWD
DDOG
ESTC
FSLY
MDB
NVDA
PINS
PTON
ROKU
SHOP
SQ
TDOC
TWLO
APPS
CHWY
DKNG
ETSY
FVRR
For the short Study version of EMAC that has been optimized for TradersPost alerts only please see EMAC - Exponential Moving Average Cross - Study
For the original full Strategy version with many editable inputs please see EMAC - Exponential Moving Average Cross

AZ V.3 Test ++Position Size Fix+Float
Core Concept
This Strategy is Base on EMA Cross
But thing what make this strategy be different from original CDC Action Zone V.3 is "Position Size"
Compound Profit & Not Compound Profit Strategy
Position Sizing Concept
Be real.Everyone know the key of survive in the Market is "Risk & Money Management"
So, How can we manage our Risk and Money?
Yes, The key is " Make the Risk celling "
////////////////////////////////////
//// (Risk% * 100) / Stoploss % ////
////////////////////////////////////
How can we make the Risk celling?
1. Define your Risk Per Trade for you. (How much % money of your portfolio are you willing to pay for this trade?)
- Example -
- I Have 3,000$ in my portfolio.
- I think i can take the risk per trade for my trade 2.5% of my portfolio. (75$)
- I calculate the Position Size of my trade to pay 2.5% of my portfolio when i need to stoploss. (75$)
- And then, I have 97.5% of my fund (2,925$) for fight in next trade.
- ***** So, I'll never lose a big money of my fund. And "SURVIVE" in long term. *****
2. Mark the "Entry Point" and "Stop Loss Point"
- Example -
- I have a Entry Point at price 30,000 $
- I Make the "Hard Stop" at previous low 11 Bar. (Hard Stop = When the price went lower from this point, We Sell this position without any pity)
- For example. I assume the previous low is 20,000$
- I Clac. the different % from Entry to Stoploss. (33%)
- ***** So, If the price went low from Entry Point -33%. I'll stop this position. *****
3. Calculate my position size.
////////////////////////////////////
//// (Risk% * 100) / Stoploss % ////
////////////////////////////////////
- In the past 2 Example.
- We have Risk% = 2.5%
- We have Stoploss% = 33%
- So, We clac. >>
- 7.575757 >> 7.5 % of my Portfolio
- 7.5 % of my Portfolio = 225 $
- ***** When my position Dropdown I'll lose for this trade and survive to fight in next trade. *****
Compound Profit Concept
We calculate the base equity from
Normal People use this.
Not Compound Profit Concept
We calculate the base equity from
If we have some profit. We use this profit for "Reserve" the loss in next trade.

EMAC - Exponential Moving Average CrossEMAC - Exponential Moving Average Cross
This strategy is based in part on original 10ema Basic Swing Trade Strategy by Matt Delong: www.tradingview.com
Link to original 10ema Basic Swing Trade Strategy:
This is the Original EMAC - Exponential Moving Average Cross strategy built as a class for reallifetrading dot com and so has all the default settings and has not been optimized. I would not recommend using this strategy with the default settings and is for educational purposes only. For the fully optimized version please come back around the same time tomorrow 6/16/21 for the EMAC - Exponential Moving Average Cross - Optimized
If you have any questions feel free to reach out to me with a comment and I will try to get back to you quickly with a reply.
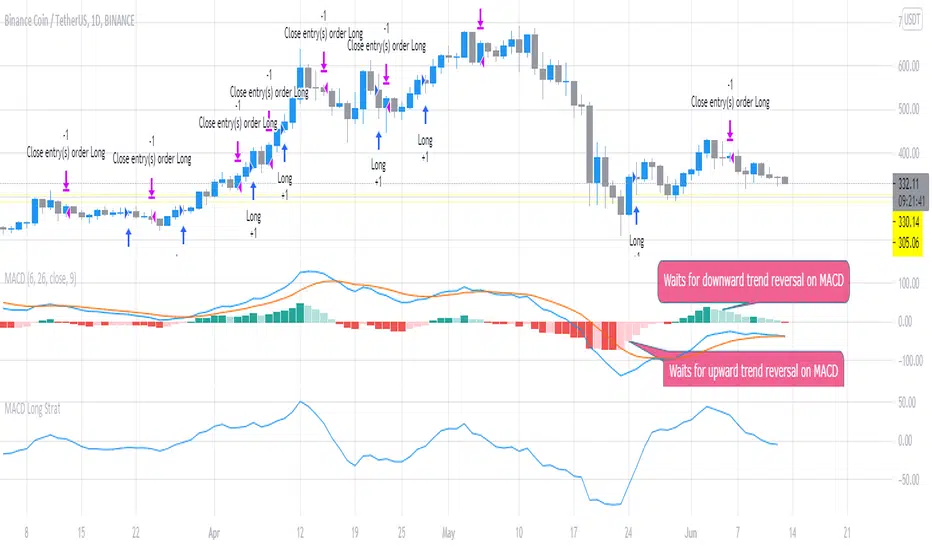
MACD Long StratFirst script I've written, but the concept is pretty simple. This uses the MACD with settings fast_SMA = 6 and slow SMA=16 and uses the distance between the 2 (histogram) to look for potential trend reversals to flag potential entries for Long trades. It waits for the confirmation looking backward 2 x timeframes (to reduce false calls slightly). You can adjust it to open / close quicker (1 timeframe instread of 2) but backtesting shows 2 timeframe delay is best to avoid false signals.
The script suggests Long entry points based on this criteria and uses the converse (reducing histogram / SMA difference delayed by 2 timeframes) to suggest exit or trade close points for downward reversal. It was originally written looking at 1m scalps but backtesting shows this is even more effective on higher timeframes (1D).
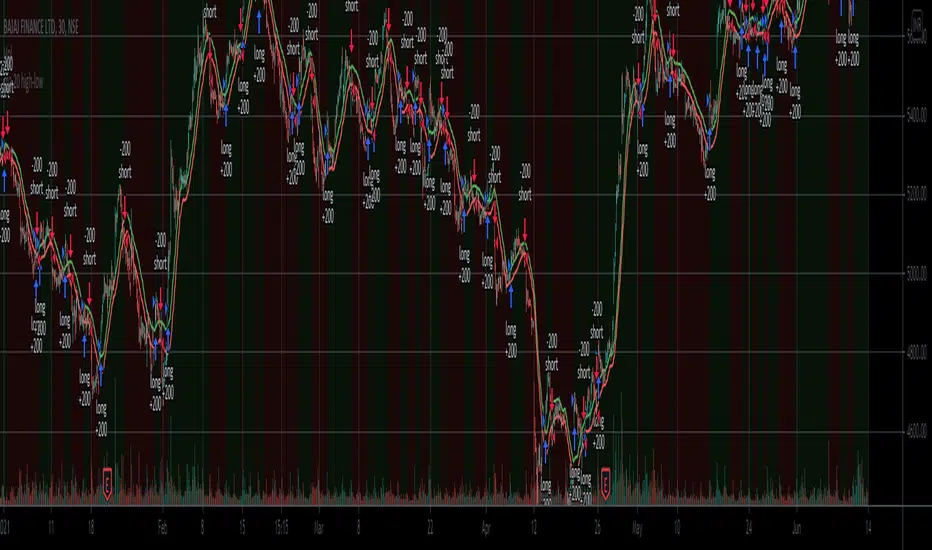
ma 20 high-lowThis is a simple 20-period high and low SMA strategy. We buy the stock when it closes above the 20 period SMA of high prices and sell when it closes below it. We sell when the price closes below 20 period SMA of low prices. This strategy works phenomenally well for a few stocks examples are bajaj finance and bajaj finserv. I want to see if it makes a good return in future. It works well for 30 mins and a daily time frame.
Proper lookback periodThis will allow you to enter the date when the strategy should start trading. It cancels all orders if the the current bar is older than the date you entered in the input field.
Motivation: strategy(lookback) never worked for me and even if it did, it is garbage, because I want to set a date instead of number of bars. I can see on the chart clearly what period is irrelevant (in futures trading).

Crypto EMA Trend Reversal StrategyThis is an EMA crossover strategy which involves 5 EMAs to trigger trades. The strategy has two take profit settings and uses a stop loss.
TP1 and SL are based on ATR and TP2 is an EMA crossover.
The strategy goes both long and short and the default settings work particularly well as a scalping strategy for ETHUSDT on the 5M time frame.
I have also created another version with tweaked settings for scalping LINKUSDT on the 5M with very similar results.
There is an option to add a volume condition parameter within the script on lines 26-28 which can be added to the end of lines 34-35 in the following format: and vol_cond
I personally don't currently use the volume condition parameter.

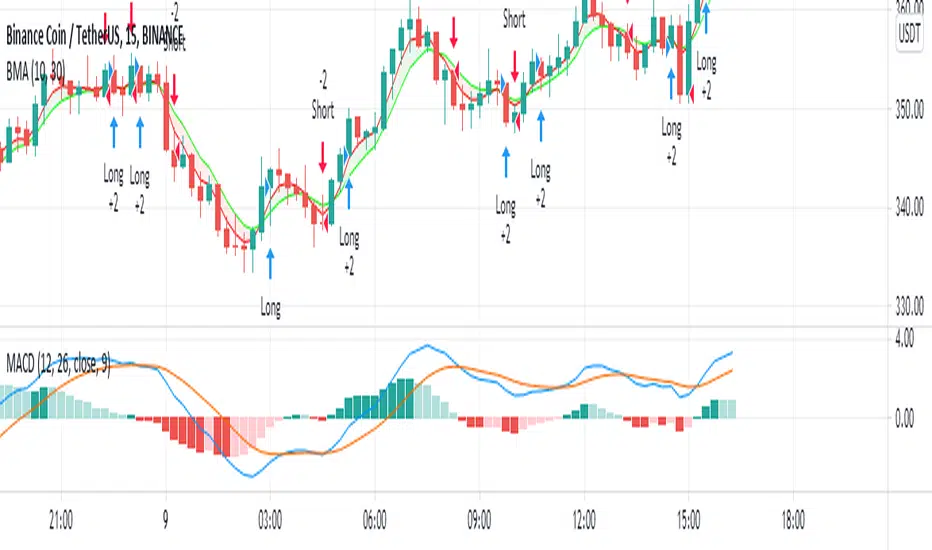
Binomial Moving Average StrategyBinomial Moving Average:
This type of moving average that is made by myself and i did not see anywhere before uses the half of binomial coefficients for
averaging the prices for example if the period be 5 then we use the 9 degree binomial coefficients(that yields 10 coefficients) and use half of them.
we use 126/256 for last bar,84/256,36/256,9/256 and finally use 1/256 for 5th bar. Seemingly this MA works better than EMA.
This Strategy uses the most known method(crossover and cross under two slow and fast MAs) with using BMAs.
Maximized Scalping On Trend (by Coinrule)" The trend is your friend. " This is one of the most famous and valuable teachings that experienced traders can give to newbies. There is a reason for that.
No matter your views about where the price moves, what matters is where the price heads to . The market is always right, and ultimately it decides who gets the profit and who has to take a loss.
The purpose of this strategy is to spot when it's the most suitable time to buy an asset profiting from a potential short-term price increase. The strategy tends to open trades frequently, closing them on average in one and a half days.
ENTRY
The buy order is placed on assets that present strong momentum when it's more likely that it is about to increase further in the short term.
To capture momentum on the asset, the rule strategy requires:
the MA50 greater than the MA100
the RSI greater than 50
The rule, then, places the order when
The price crosses above the MA9.
EXIT
This strategy comes with a stop loss and a take profit which adapt dynamically to market conditions.
The trade is closed in profit when the RSI is greater than 70 , as the trend could experience a pull-back.
Alternatively, the trade is closed when the RSI is lower than 30 , being this a sign of weakening of the trend.
Pro tip : The 1-hour time frame has proven to return the best results on average. The strategy can also work well in the 15-min time frame if you want to increase the trades' frequency.
The strategy assumes each order to trade 30% of the available capital and opens a trade at a time. A trading fee of 0.1% is taken into account.

MACD EMA - TradingRush StrategyHey there!
Today I present you a rather simple, but very profitable MACD strategy. Since I trade it with cryptocurrencies, the settings have been adjusted.
I discovered the strategy on a YouTube channel and tried to transfer it as a strategy into a script.
Tested with the crypto pair ETH/USDT in the 15 minute chart.
There is the possibility to switch between short and long positions.
-----------------------------------------------------------------------------------
How does the strategy work?
ENTRY
The MACD indicator must cross below the histogram. If it crosses when the price is below the EMA, only short positions are traded. Above the EMA - long.
EXIT
The Lowest Low (long) / highest high (short) serves as the stop loss. The TP is formed on the basis of a factor. (SL multiplied by factor 2.1 = TP).
The red lines are used to illustrate the SL. Above for short positions below for long positions.
The results of the strategy are without commissions and levers.
If you have any questions or feedback, please let me know in the comments.
If you need more information about the strategy and want to know exactly how to apply it, check out my profile.
I wish you good luck with the strategy!

EMA RSI ATR Hidden Div Strat - 1 MinHey there!
Hereby I present you the EMA RSI Lowest Low Hidden Divergence strategy, which I discovered on a youtube channel.
He has tested the strategy hundreds of times manually, herewith I try to automate the whole thing.
Since I use the strategy with a bot, it can only enter long positions for now. But in the future I will add the possibility to trade short positions.
The strategy was tested with BTC/ USDT in 1m chart (8 days). The values must be adjusted depending on the timeframe and coin.
-----------------------------------------------------------------------------------
How does the strategy work?
First of all, we need a bullish hidden divergence.
Once this is detected, the following parameters are checked:
The 50 EMA must cross the 250 EMA .
Then, the candle must close above the 50 EMA .
The K line of the RSI STOCH indicator need to crosses the D line.
If the next candle closes above the 50 EMA , a long position is opened.
The stop loss is determined with the "lowest low/highest high lookback".
The profit factor is multiplied by the value of the lowest low/highest high lookback.
The results of the strategy are without commissions and levers.
If you have any questions or feedback, please let me know in the comments.
In the future I will add other types of stop loss / take profits. (ATR; %; eg.)
I wish you good luck with the strategy!

TEMA Cross +HTF BacktestThis is a follow up to a previous script release called " TEMA Cross Backtest ".
This new strategy uses two TEMA crosses, one for trend direction, one for entry and exit. The entry and exit parameters are the same as the previous script. The trend direction is based on a user configurable higher timeframe TEMA cross which determines when to take longs or shorts. When the indicator is purple, it is looking for shorts, and when it is yellow, it is looking for longs. The background of the chart is colored accordingly to see the trend direction at a glance.
The default settings are the ones I have found produce the highest backtest results. The backtest is set by default to use a $500 account, and use $500 for every entry and exit, no matter the direction or overall profit/loss.
Parts of script borrowed from other public scripts.

Ichimoku EMA RSI - Crypto only long StrategyHey there!
Here I show you an Ichimoku Cloud Strategy.
I discovered the strategy on a YouTube channel and tried to transfer it as a strategy into a script.
He said in his video that you would make more profit with this strategy than holding the coin.
Tested with the crypto pair ETH/USDT in the four hour chart.
Period: beginning of 2017 until today.
The strategy should also work with foreign exchange. But then the settings have to be adjusted.
There is the possibility to activate two EMA's and a Stochastic RSI .
-----------------------------------------------------------------------------------
How does the strategy work?
ENTRY
The green Ichimoku lead line must above the red Ichimoku lead line - only the two lead lines are activated.
A green candle must closed above the green lead line.
EXIT
A red candle must close below the green Ichimoku lead line.
OPTIONAL ENTRY
EMA
Once you activate the EMA , long positions will only be taken once the EMA1 is above the EMA2.
Thereby I could observe a significant increase of the profit as well as a decrease of the maximum drawdown.
RSI
As soon as you activate the Stochastic RSI , long positions are only taken when the K line is above the D line.
In the future, I may add an oversold - undersold parameter.
The results of the strategy are without commissions and levers.
If you have any questions or feedback, please let me know in the comments.
If you need more information about the strategy and want to know exactly how to apply it, check out my profile.
I wish you good luck with the strategy!
