Percent above or Below Moving Average Candle colourFilter:
If green candle is 'x' % above moving average than colour of candle is turn in blue colour.
If red candle is 'x' % below moving average than colour of candle is turn in orange colour.
Movingavarage

3c Ultimate reversal strategy With scanner and backtester v2This might just be the ultimate strategy to identify reversals.
This strategy includes a scanner, a backtester and ability to connect it with you 3 commas bot(See adviced settings below)
Strategy:
-Signals reversal that happened in the last bar. This signal DO NOT repaint.
-Identifies potential reversal that might happen in the current bar but can also not happen depending upon the timeframe closing price.
-The strategy combines the Moving Average Trend Changer, SuperTrend (ATR price detection) and ADX.
-It reduces the number of false signals in sideways market conditons and give more reliable trade signals.
-The signal does not repaint and can be used in any market condition. It determines the trend with high precision.
Take profit:
-Set 2 separate TP conditions.
-You can take profit using percentage, ATR, or RR(Risk Reward), aswell as using Trailing Take Profit.
- Use sell signal from the strategy(I often find way better results using that)
Stoploss:
-You can use either ATR, Percentage or sell signal from the strategy
(For now to let the strategy itself decide when to TP or SL, just set these parameters really high.)
Scanner:
-Identifies coins that are currently in the sell zone
-Identifies coins that are currently in the buy zone
-Screener explores up to 20 pairs in current graph's time frame.
-Optimize the strategy to your liking and use the built in backtester to see if it is a viable strategy.
3commas settings:
-For now you can only use simple bots.
-Create LONG and SHORT bots for the coins you like to trade and set up alerts(You can send long and short signal from the same alert)
-Set TP to 50% the strategy will handle buys and exits based on your inputs.
-Set safety orders to 0. I might add DCA to the strategy if testing proves that to be a good solution.
-When you have made the bots input the bot ID and token adress in the settings of the strategy.
-When creating the alert use this webhook :https://3commas.io/trade_signal/trading_view
-In the message field you use {{strategy.order.alert_message}} as the placeholder.
In the future this signal might make it to the 3commas marketplace. You can then subscribe to that signal where I have cherrypicked coins based on thorough backtesting and optimization.

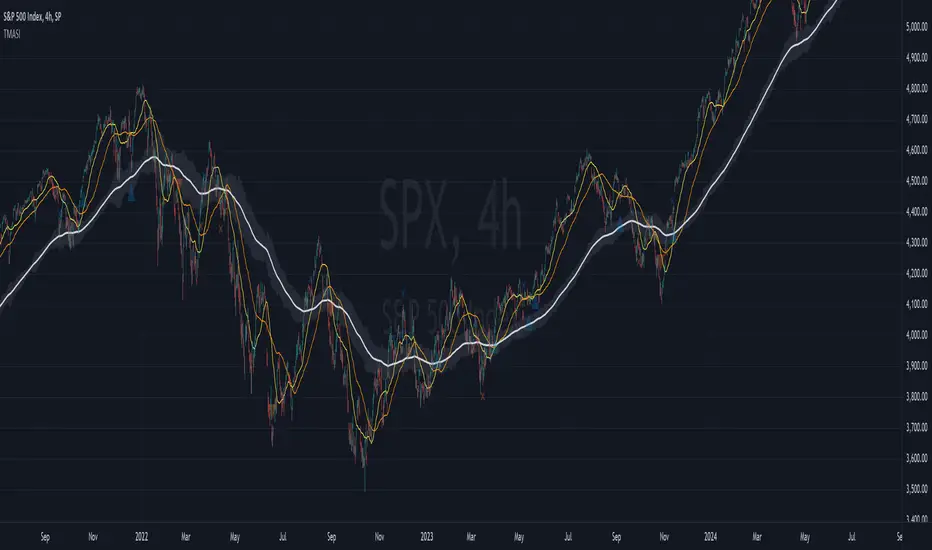
Aarika Trade with the Trend (ATT)Hello traders, purpose of creating this indicator is simply trying to analyse the trend of any symbol.
This indicator is a modification-version of three different indicators from different authors, brought together to create a fine-piece of trend-finder.
This is combination of multi MAs to notice price action with different parameters and calculations.
This indicator generate Green/Red/Yellow bars once all the calculations comes to certain point.
This indicator can be used on any script like Indices, Stocks, Future, Currency & Crypto.
How to trade : This indicator is easy to use on any timeframe and on normal candlestick. Bar colour appeared on candle is based on some calculation and when all the condition are matched; so wait for full candle to be formed and once candle close then go for trade.
Rule for Long trade: Let the current candle form completely. If its a Green colour bar then it indicates a bullish momentum whereas Yellow bar may see a reversal of the current trend.
Rule for Short trade: Let the current candle form completely. If its a Red colour bar then it indicates a bearish momentum whereas Yellow bar may see a reversal of the current trend.
This is not a Holy Grail indicator which always gives profit but if you practice this indicator with consistency, your portfolio may give good returns.
Use proper money management before taking any trade. Go for paper trade and observe how this indicator behaves and once satisfied then only take real trade.
Add - on Feature : we have added HAMA in this indicator. Usually if HAMA is forming Green colour candles then it is a strong bullish trend, whereas Red HAMA candles show bearish trend.
Moreover, if our bar colours are Green and price is above HAMA, it usually shows strong Bull trend; and opposite side Red colour bars with price below HAMA may be seen as a strong Bear trend.
Disclaimer: Please make sure you study this indicator on different timeframes because inserted set of data may act differently on different scripts and may vary from timeframe to timeframe.
We advice you to use this indicator for trend-analysis and study purpose only. Author/publisher of this indicator is not responsible for your profit or loss if you use this indicator for trading purpose one way or another.
N.B.: We do not recommend using HeikinAshi charting for this particular indicator as the data inputs may behave differently than expected. If you have any query, you may comment below.

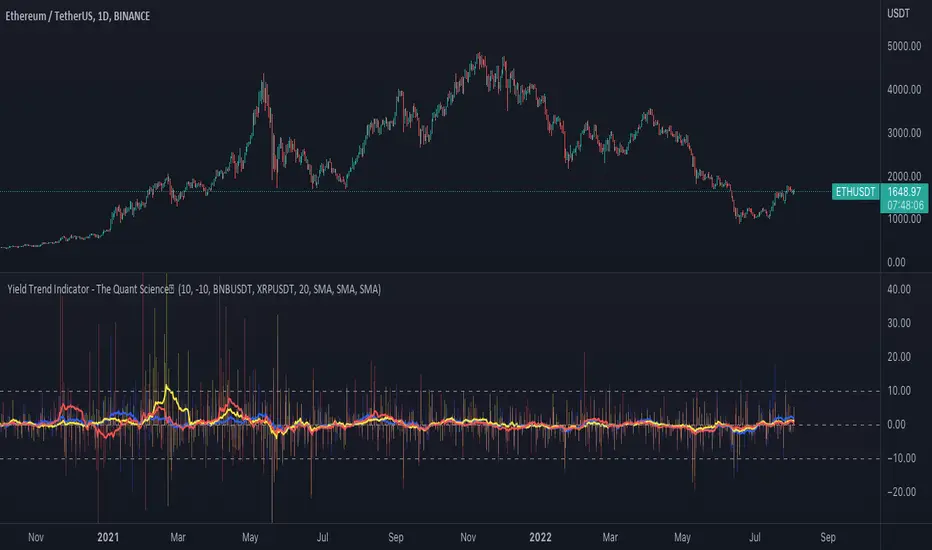
Yield Trend Indicator - The Quant ScienceYield Trend Indicator - The Quant Science™ is a quantitative indicator representing percentage yields and average percentage yields of three different assets.
Percentage yields are fundamental data for all quantitative analysts. This indicator was created to offer immediate calculations and represent them through an indicator consisting of lines and columns. The columns represent the percentage yield of the current timeframe, for each asset. The lines represent the average percentage yield, of the current timeframe, for each asset.
The user easily adds tickers from the user interface and the algorithm will automatically create the quantitative data of the chosen assets.
The blue refers to the main asset, the main set on the chart.
The yellow refers to the second asset, added by the user interface.
The red refers to the third asset, added by the user interface.
The timeframe is for all assets the one set to the chart, if you use a chart with timeframe D, all data is processed on this timeframe. You can use this indicator on all timeframes without any restrictions.
The user can change the type of formula for calculating the average yield easily via the user interface. This software includes the following formulas:
1. SMA (Simple Moving Average)
2. EMA (Exponential Moving Average)
3. WMA (Weighted Moving Average)
4. VWMA (Volume Weighted Moving Average)
The user can customize the indicator easily through the user interface, changing colours and many other parameters to represent the data on the chart.
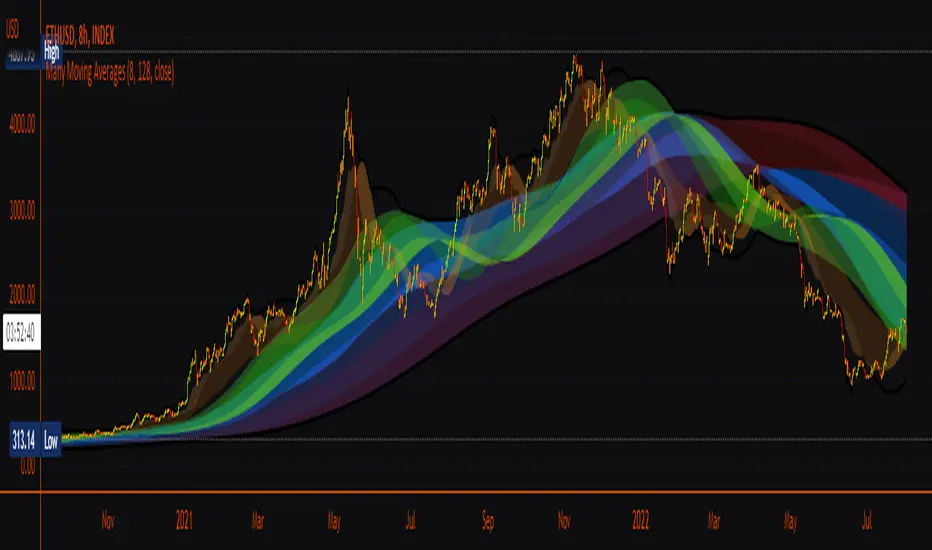
Many Moving AveragesA smooth looking indicator created from a mix of ALMA and LRC curves. Includes alternative calculation for both which I came up with through trial and error so a variety of combinations work to varying degrees. Just something I was playing around with that looked pretty nice in the end.
Candle Strength IndicatorThe candle strength indicator depicts the average strength of the price action by evaluating bullish vs bearish candles.
The scale is relative to price fluctuation and the size of the candles for the particular ticker / market, so there are no significant levels.
A cross on the zero line would generally indicate a change in trend / sentiment.
This indicator may be useful as a filter for entries and use in confluence with other indicators.

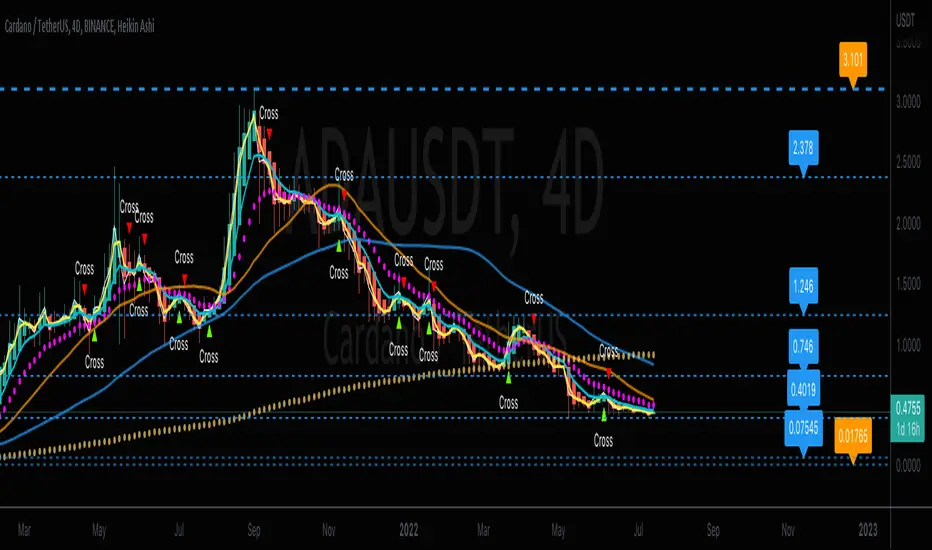
CrossFire -=[ CryptDollar ]=-FEATURES
DO NOT USE WITHOUT READING ALL OF THIS!
Intended to be USED AGAINST Heikin Ashi Averaging Trend Candles for LEGITIMATE ‘AVERAGING’ Trend Recognition and analysis and it is a legitimate mathematical protocol using averages.
NOTE:
THIS IS NOT A simple “ENTER / EXIT" Type Indicator!!! BE CLEAR ABOUT THAT!!
THIS IS A AVERAGE TREND ANALYSIS and Support & Resistance type of indicator
ADDITIONAL NOTE:
This EMA CROSSING signal indicator DOES NOT REPRINT after the EMA CROSS CONFIRMATION, (Candle Close)!!
It may flicker during the confirmation process, which ALL indicator formulas do.
PROOF OF THIS is that the Yellow and Light Blue EMAs are IN FULL VIEW where the indications occur.
What is a Moving Average Crossover Confirmation??
It is when the selected Moving Averages fully cross each other upon candle close.
It is also important to note:
The LOWER the Timeframe, the more 'NOISE to signal' ratio you will get with this and ANY other indicator.
The HIGHER the Timeframe, the more 'SIGNAL to noise' ratio you will get with this and ANY other indicator.
To attain more reliable Trade Planning signals; simply look for signals on the higher TFs, and THEN use the lower, faster-pivoting TFs to limit into position.
You should only execute moves AFTER you 'APPROPRIATELY PLAN YOUR TRADE' and decide to 'TRADE YOUR PLAN!'
------------------------------------------
What is included with this EMA Crossing Indicator:
Dynamic SR (Horizontal lines of Support and Resistance (which is analyzed against recent average price action). An optional VWAP is included as well
ALL of these pop-up indication features can be turned Off or On in settings panel:
Also, it is very important to select the dots next to the indicator name on your chart; scroll the drop menu go to "Visibility" > "Bring to Front." so you can see the 2 and 6 EMAs on top of the Heikin Ashi AVERAGING candles.
AGAIN, this indicator is based off a known and well established Heikin Ashi EMA Crossing Swing Trading Strategy and is optimized with the use of Heikin Ashi AVERAGING Candles.
This contains all of the EMAs related a 2-6-13 Heikin Ashi AVERAGE Trading Strategy. The original strategy for traditional markets used the 17 EMA. But in crypto, I've found that the 13 EMA at least 'seems' to be more relative and consequential as a trend change 'strength' indication.
- Includes alerts with "CROSS" indications for the 2 & 6 EMA crossover points.*
- ALWAYS check for Trend & Price Support or Resistance (SR) ALONG YOUR TRADE PATH, BEFORE planning your Trade.
- DO NOT simply enter trades based on the Cross signals, as these are mere indications of directional change, and make sure you have at least a single candle close confirmation before taking it seriously.
- Along with that, there are certain sets of SMAs (21, 50, & 200) that are universally used by famed rock star traders, for both scalping and swing trades, which can be enabled and disabled in the Style Panel Settings.
- The optional ARROWS are additional indications for when the 13 EMA , 21 SMA , 50 SMA , and 200 SMA are crossed up or down.
Each EMA and SMA has its own alert that you can individually set, along with the primary "CROSS" indication alerts.
* Special note regarding the visual indications of the 13 EMA and the 21 SMA
If an arrow appears with "13-21" above or below it, that is because these moving averages are so close that
for visual notification purposes there was a visual layering issue whenever both of these MAs triggered on same candle.
This compensation for the visual indication has no effect on the individual MA's Alert settings.
- ALL EMAs and SMAs are customizable if the defaults are not to your liking, BUT understand that any EMA and SMA assignment changes will divert away from the strategy for which this indicator was designed.
If you change from the default moving average assignments in the input settings, your changes will unfortunately not be reflected in the "labeling" on the chart or in alerts)!!
- All optional are in the settings panel, and all setting listings are easily understandable as to what they are
- I was finally able to edit the script to where the labels are not obnoxious on the chart!!!
- As with all my indicators so far; I like to include the optional light-white Daily VWAP plot line to save adding an extra indicator if you like to follow the VWAP , as I do.
- If your chart seems noisy with everything turned on, you can always disable any of these features that you find yourself not using as a visual reference and then "Save as default"
Best Applied to Higher Timeframes
With ALL Default “Noisy” Visual Indications Enabled:
With Only the Visible Primary Cross Indications Enabled:
Dragon Multi Moving Averages With labelThis script is for a many?! moving average strategy where the user can select from different types of moving averages, price sources, lookback periods and resolutions.
Features:
- 6 Moving Averages with variable MA types, periods, price sources, resolutions and the ability to disable each individually. Tow of moving averages are disable by default. you can enabel it
- Crossovers are plotted on the chart with detailed information regarding the crossover (Ex: 50 EMA crossed over 100 EMA ). there is only between 1-2, 2-3, 3-4, 4-5, 5-6 moving average cross label.
- Ribbons added and on by default. Optional setting to disable the ribbons. 5 ribbons between MA3 and MA4 and another 5 between MA4 and MA5 and another 5 between MA5 and MA6.

LNL Pullback ArrowsBuying the dip has never been easier! LNL Pullback Arrows are here to pinpoint the best possible entries for the trend following setups. With the Pullback Arrows, trader can pick his own approach and risk level thanks to four different types of arrows. The goal of these arrows is to force the traders to scale in & out of trades which is in my opinion crucial when it comes to trend following strategies. These arrows were designed primarily for the daily & weekly time frame (swing trading).
Four Types of Pullback Arrows:
1. Aggro Arrows - Ideal for aggresive approach during parabolic trends. Sometimes trends are so strong that the price barely revisits the daily 8 EMA. This is where the aggro arrows can perfectly pinpoint the aggresive high risk entries. Ideal for halfsize or 1/4 size of the full position. Aiming for quick 1-2 day moves targeting the recent high/low. These arrows could be also named as scalping arrows for the swing traders. A quick In & Out.
2. HalfSize Arrows - Medium risk approach. First arrows to scale in. HalfSize arrows are the first sign that the pullback might be ending, yet there is still some space left for an even deeper pullback. That is the reason why they are called half-size. Ideally taken with half-sized position. When trading the HalfSize Arrows, It is better to have some "spare ammo in the gun" ready to use.
3. FullSize Arrows - Regular risk approach. These arrows represent a zone where the core of the posititon should be taken. The point of validity for the trend is not that far away, meaning the risk can be kept tight. Ideal for scailing the other halfs or quarters of the full position. Also great for more conservative traders or environments with higher volatility.
4. Rare Arrows - Offer the best risk to reward entries during the trend. Rare Arrows should be the "last kick" of the retracement, therefore stops can be positioned really tight. They either trigger the stop immidiately or they provide another juicy leg up or down in the direction of the trend. However, they really do appear rarely.
Simple EMA Cloud:
A simple cloud based on 21 and 55 exponential moving averages. This default length creates a pullback zone that is wide enough for the conservative traders but also give the opportunities to more aggresive traders. Alternatives such as 8 & 21, or 21 & 34 are forming the zone that is too aggresive and usually too thin. Of course, cloud can be fully adjusted or turned off completely. The only role of the cloud is to gauge the trend.
Tips & Tricks:
1.Importance of the Scailing
- As already stated, scailing is crucial to this since there is no way of knowing the exact level at which the price magically bounce every time. It is hard to tell where and which EMA will be respected. How can we know it will be 21 EMA every time? or 34 EMA or 10 EMA or 100 SMA or 50 DMA ... Single MA does not make a trend. This is the reason why scailing is so important. Scailing can make a difference.
2. Nothing is Perfect
- Same as any other study, nothing works 100% perfectly. Sometimes the setup will go right against you and sometimes the price will fade away sideways and breaks off the structure of the trend. This is not a magic certainty tool. This is just another probability tool.
3. Point of Validity & Other Studies
- Even though the pullback arrows can be a stand-alone strategy. It is important to use other indicators that visualize the actual trend. Whether its EMA Cloud or EMAs or DMI Bars or Keltner Channels, there should be something that validates the trend, something that tells the trend is over. (Pullback Arrows are not showing the actual stops!).
Hope it helps.

DATE and ATR20 for practice using kojiro_indicatorsThis is an indicator to display ATR20, EMA100 of ATR20 and date at a glance for trade practices using kojiro_indicaotrs.
This will allow you to easily perform your practices.
Please change the period of EMA and the display interval and size of the indicator as needed.
Please enter small, normal, large, huge, or auto for the size.
The following is in Japanese.
小次郎講師のインジケーターでプラクティスする際に、
ATR、日付を見やすくするためのインジケーターです。
サイズや間隔を変更可能です。サイズはnormal、normal、large、huge、autoを入力してください。

Two MA Signal IndicatorThis Signal Indicator that emits a signal based on two MAs crossover/crossunder. It is designed to be used as an External Input for "Template Trailing Strategy" to verify the correctness of the External Deal Condition Mode of the aforementioned script and the Internal Strategy logic. Also, this script is a simple example on how to create custom signal indicators that can be "pugged" to the "Template Trailing Strategy" and get all the features this strategy script can provide!
Multiple MAs + No Trend Zone + ATR WidgetThis is my first Pine Script attempt. Nothing special, just an "all in one" for the most common things I use, and what I have found to be the most common in a lot of strategies.
Great for free and limited accounts as it combines 7 total indicators into one.
-- First 5 indicators are Independant Moving Averages:
-Each one can be set for length, as well as source and type (SMA, EMA, SMMA, WMA, VWMA) individually
-- Second type (6th) of indicator is one I find extremly useful for staying OUT of consolidation trading. It's called a "No Trend Zone" indicator I swipped from the Hoffman Startegy. Basically, its set for a small deviation (0.5) of a 35 EMA, which creates a "Band" around the 35 line. When you have this "Band" flat or with no discernable incline/decline, with price action OR some or multiple moving averages inside this banded zone, it typically indicates a zone of consolidation. This will help you identify when you may be in one of those zones, that way you don't get trapped "waiting for paint to dry" before the market starts to move again with your position, and keep you from entering should you be considering the market at that time.
The last indicator is my favorite, and one I will refine a little deeper soon.
-- The ATR widget finishes us out. This widget can be customized for colors, turned on or off, and automatically rounds the ATR (ATR period based on the chart timeframe) to a nice readable number for what you're trading. It has settings to show or not, the length, what rounding style to use (forex pip 0.0001, forex/stock/etf/indicies 0.01) where to show it on the pane, a Multiplier Factor (for stop loss calculations automatically) and the colors.
***NOTE ABOUT ATR WIDGET:
I am primarily a forex trader, so the defaults are for Forex 0.0001. If you see some odd numbers (like 55798 on a current chart), check the inputs tab on the settings, and change the "ATR Style" from "Forex 0.0001" to "Forex/Stock/ETF/Indicies 0.01", and you should arrive with the correct number.

LS Volatility Index█ OVERVIEW
This indicator serves to measure the volatility of the price in relation to the average.
It serves four purposes:
1. Identify abnormal prices, extremely stretched in relation to an average;
2. Identify acceptable prices in the context of the main trend;
3. Identify market crashes;
4. Identify divergences.
█ CONCEPTS
The LS Volatility Index was originally described by Brazilian traders Alexandre Wolwacz (Stormer) , Fabrício Lorenz , and Fábio Figueiredo (Vlad)
Basically, this indicator can be used in two ways:
1. In a mean reversion strategy , when there is an unusual distance from it;
2. In a trend following strategy , when the price is in an acceptable region.
Perhaps the version presented here may have some slight differences, but the core is the same.
The original indicator is presented with a 21-period moving average, but here this value is customizable.
I made some fine tuning available, namely:
1. The possibility of smoothing the indicator;
2. Choose the type of moving average;
3. Customizable period;
4. Possibility to show a moving average of the indicator;
5. Color customization.
█ CALCULATION
First, the distance of the price from a given average in percentage terms is measured.
Then, the historical average volatility is obtained.
Finally the indicator is calculated through the ratio between the distance and the historical volatility.
To facilitate visualization, the result is normalized in a range from 0 to 100.
When it reaches 0, it means the price is on average.
When it hits 100, it means the price is way off average (stretched).
█ HOW TO USE IT
Here are some examples:
1. In a return-to-average strategy
2. In a trend following strategy
3. Identification of crashes and divergences
█ THANKS AND CREDITS
- Alexandre Wolwacz (Stormer), Fabrício Lorenz, Fábio Figueiredo (Vlad)
- Feature scaler (for normalization)
- HPotter (for calc of Historical Volatility)

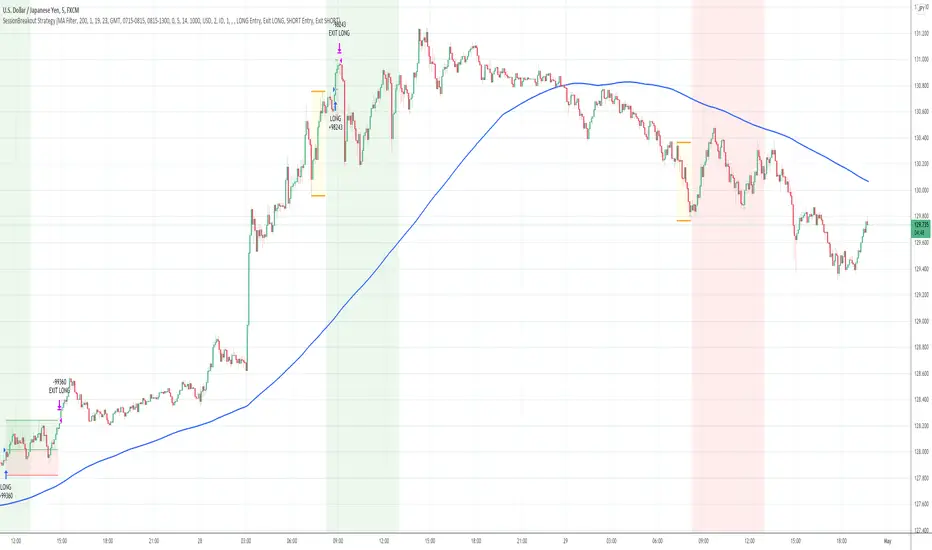
Session Breakout Strategy [Kintsugi Trading]What is Session Breakout Strategy?
This premium indicator was inspired by my desire to find and place high probability forex trades in any market, direction, or time of day.
Why Forex?
The Forex markets operate 24 hours, 5.5 days a week
Access to meaningful leverage
Ability to easily trade long or short
High liquidity
How to use it!
----- First, start by choosing a Range Session and Trade Session. -----
- Range Session = Period of time you believe will be predictive of future price action. I like to overlay 'FX Market Sessions' by boitoki to target timeframes in which forex market sessions overlap. This period is indicative of buyers and sellers battling it out in an effort to choose a direction.
- Trade Session = Period of time you believe the price will act on the information gathered from the range session.
----- Next, we filter the Range Session by information that will help further predict price movement in the Trade Session. -----
Our tools are:
Moving Average Filter
Average RSI Filter
RSI Decision Level
None
Each parameter is customizable.
----- Next, we set our risk. -----
Enter the "stop pip size' you desire.
Enter the 'target profit pip size' you desire.
We can set out ($) dollar risk-per-trade in the inputs. The script does not know your actual account balance, so if you want to risk $100/trade you would enter '$10,000' in the account balance section and '1' in the Risk Per Trade% section.
For example, an '8' stop and an '8' tp would indicate a 1:1 risk-reward. *Note - although you may generate a higher win percent with a less favorable RR, it is rarely worth it.
----- Finally, we backtest our ideas. -----
After using the 'Strategy Tester' tab to thoroughly backtest your predictions you are ready to take it to the next level - Automated Trading!
This was my whole reason for creating the script. If you work a full-time job, live in a time zone that is hard to trade, or just don't have the patience, this will be a game-changer for you as it was for me.
Auto-Trading
When it comes to auto-trading this strategy I have included two options in the script that utilize the alert messages generated by TradingView.
*Note: Please trade on a demo account until you feel comfortable enough to use real money, and then please stick to 1%-2% of your total account value in risk per trade.*
AutoView
PineConnector
Good luck with your trading!
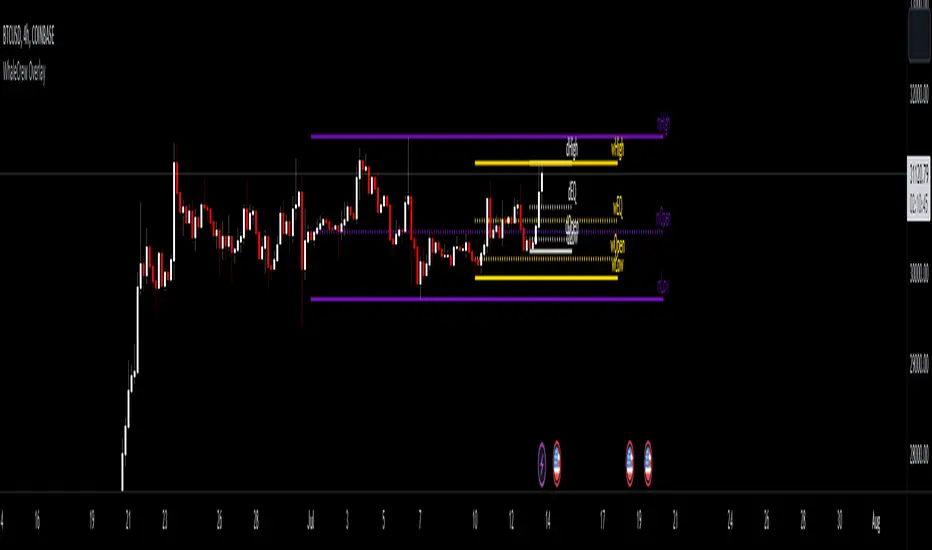
WhaleCrew OverlayThis overlay is all about looking for confluence, and this is achieved by combining the power of Support/Resistance trading and Moving Averages.
Features
Support and Resistance
Trend Visualization
Fib Ribbons
Moving Average System
Intraday Tools
Support and Resistance
This involves Daily Levels (High, Low, Open, and Range Center), Weekly Levels (Open, High and Low), as well as the Monthly/Quarterly/Yearly Open.
Automatically having these support/resistance levels on your chart no matter what timeframe you're on is a big advantage, they can be used as confluence levels for potential trades.
Trend Visualization
Our trend component visualizes the current trend using two moving averages. There are multiple inbuilt modes that should be picked based on your trading style.
Use this indicator as confluence and don't rely solely on it.
Fib Ribbons
Our Fib Ribbons are a bundle of multiple EMAs with custom timeframe built-in. Unlike EMA Ribbons our EMA lengths are only based on Fibonacci Numbers.
The numbers of EMAs is four by default (fastest: 8, slowest: 34), but EMA 5 & 55 can be manually enabled.
The ribbons will act as support in an uptrend and as resistance in a downtrend. A ribbon cross often indicates a potential trend change.
Moving Average System
Build a system around 2 custom moving averages for more confluence (supports custom timeframes and many moving average types).
The moving averages can be used for generating signals whenever they cross, or as possible support/resistance.
Intraday Tools
We also support intraday tools like VWAP (Volume-Weighted-Average Price) and TWAP (Time-Weighted-Average-Price).
They differ from normal moving averages by taking volume/time into account and will act as potential support/resistance (commonly used by big market participants).
Usage
You should look for price levels where moving averages and support/resistance are lined up for confluence.
Closely monitor price action near important price levels for potential trade setups:
Consolidation right below resistance is considered bullish
Consolidation right at support might be considered bearish
Watch out for rejections and retests (also counts for moving averages)
Access to this indicator can be obtained through our website.
Martyv Technical Analysis KitThis indicator is being developed as a tool hopefully suited to both the beginner/amateur/hobbyist and possibly also the professional analyst/trader. The idea is that it would be a tool that can give you an instant ‘overview’ of a few different schools of measurement on any measurable asset. Makes for great training wheels or a primer for further analysis.
Out of the box settings will give you an AutoFib for the most recent low and high (with extension targets), a pair of commonly-used moving averages (50 SMA and 200 SMA), RSI (and/or many other) divergences on the chart, and candles colored according to current trend (Blue = Bullish Control, Purple = Neutral/Coasting, Red = Bearish Control) and intensity according to volume (Darker = High Volume/Increasing, Lighter = Low Volume/Decreasing). For more advanced traders/analysts, almost all settings can be customized, with multiple options and additional features.
*There are a lot of settings. Shrug. Wink. I tried to bundle them together, however there are a few that I use quite often and placed them at the top for easy access. If you have any suggestions as to what's super useful in the top area, lmk. Happy trading! -E
AutoFib
-Places an AutoFib for the most recent low and high (with extension targets)
-You can choose to "contain price action" inside a 0-1 fib retrace, or allow extension targets to automatically be used (potentially useful within Harmonic Trading among other things)
-Uses the Fast/Medium/Slow (Default) global inputs for fib lookback period (Defaults to 8/21/34 at the time of this writing, can be changed in settings)
-Customizable fib levels, colors, and styles
-Can choose between AutoFib with manually defined levels or SmartFib with levels automatically calculated, including extensions as needed
--Choose between only using the most recent confirmed fib retrace, or the currently developing (non-confirmed) fib retrace - this will also contain price action within a 0-1 fib
--Adds fib extensions as needed, you can define extension levels
-Can change the lookback period and turn the visible Zig Zag and/or AutoFib on/off
-Can turn Logarithmic on/off in settings
Divergence
-Can identify and mark divergences (regular and hidden) for MACD, MACD Histogram, RSI (Default), Stochastic (Default), CCI, Momentum, OBV, Diosc, VWmacd, and Chaikin Money Flow
-Can turn divergences on/off individually
-Can choose to show hidden divergence
-Uses the Fast/Medium/Slow global inputs (Defaults to 8/21/34 at the time of this writing, can be changed in settings)
Trend Channels
-Uses a Zig-Zag with a specified lookback period (can be changed in settings)
-Setting AutoFIb to a different lookback than Trend Channels yields interesting results imo
-Can turn channels on/off
-Can change the lookback period and turn the Zig Zag and/or Channels on/off
Trend Ribbon
-Uses the John F. Ehlers Supersmooth method on a specified lookback period (Default 14)
-Checks the current price action against the lookback period trend and if the Supersmooth signal aligns with the trend direction, it gives a strong signal (Bull/Bear). A continuation signal (Neutral) is given if these two don’t match, and often indicates trend continuation or trend reversal.
-Can turn supersmooth and/or matching bar repaint on/off
-Can choose between Bull/Bear/Neutral signals and only Bull/Bear signals
-Alerts available for Bullish or Bearish change
-Can choose current timeframe or any timeframe
Bar Repaint
-Candles colored according to current trend (Blue = Bullish Control, Purple = Neutral/Coasting, Red = Bearish Control) and intensity according to volume (Darker = High Volume/Increasing, Lighter = Low Volume/Decreasing). You can set candle color to reflect: Open/Close, Trend (Default), or an RSI Gradient. You can set candle intensity to reflect: Volume (Default), Momentum, RSI, or ADX.
Price Tag
-Price tag that sits neatly between the candles and the fib labels. You can turn this on or off.

SVA - Simple Volume Analyzer, by BlueJayBird [bjb] ENGLISH & SPANISH
------------------------------------- ENSLIGH
The idea was initially inspired in the concepts shared by @LazyBear on his indicator "Better Volume Indicator" (). But I found it somewhat complicated and dull. So I came up with this.
Concept:
It changes the color of volume bars based on surrounding volume changes.
Volume changes are plotted as volume MAs lines in the volume pane.
Whenever the volume is higher than these MAs, the bar changes color.
For this reason, the bar color change is RELATIVE TO the surroundings, because the color change depends on how far the MA has been extended due to sudden (or not) changes in the volume.
BAR COLORS:
Weak Green and Red: Low volume. The calm before or after the storm.
Normal Green and Red: Mid volume. Still low volume, you may get bored.
Yellow: High volume. Players are playing hard and harder.
White: Ultra-High Volume. The elephants stepped in.
NOTES:
SVA works better at lower timeframes. Though as far as I can tell, it works pretty well as far as 1D timeframe.
------------------------------------- SPANISH
La idea estuvo inicialmente inspirada en los conceptos expuestos por @LazyBear en su indicador "Better Volume Indicator" (). Pero lo encontré un poco complicado y falto de claridad. Así que me inventé este.
Conceptp:
Cambia el color de las barras basándose en los últimos cambios de volumen.
Los cambios de volumen son ploteados como lineas de medias móviles (MAs, es decir "Moving Averages") en la sección del volumen (chart pane).
En cualquier momento que el volumen es mayor que estos MAs, el color de las barras cambia.
Por esta razon, el cambio de color de las barras es RELATIVO a lo que está sucediendo alrededor, ya que el cambio de color depende de qué tan lejos el MA se haya extendido por causa de los últimos cambios (o no) de volumen.
BAR COLORS:
Verde y rojo apagados: Volumen bajo (Low Volume). La calma antes de la tormenta.
Verde y rojo normales: Volumen medio (Mid volume). Volumen todavía bajo. Es posible que te aburras.
Amarillo: Volumen alto (High Volume). Los jugadores están jugando duro.
Blanco: Volumen ultra-alto (Ultra-High Volume). Los elefantes entran a la cancha.
NOTAS:
SVA funciona mejor en temporalidades menores. Pero por lo que he visto, funciona bien hasta la temporalidad de 1D.

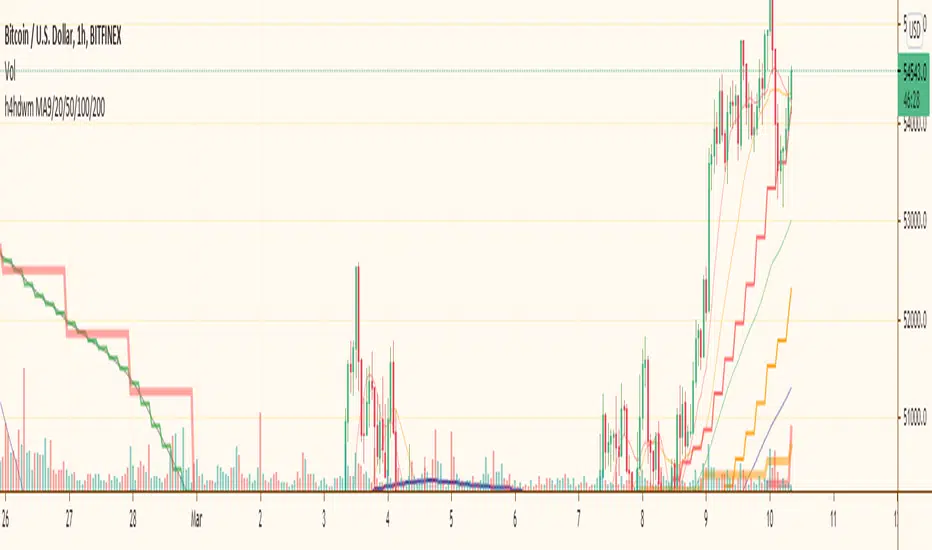
h4hdwm (updated)I put most importand moving avarages for most importand time frames together. When you whatching a graph you are sometimes missing another time frime very importand moving avarage and there is a reaction on price. with this multi time frame multi ma indicator you can see all of them at once. it makes a little mass if you let all of them together. so you might close some of them.
Bigger time frames Moving Avarages has ticker lines and bigger steps.