ChartRage - ELMAELMA - Exponential Logarithmic Moving Average
This is a new kind of moving average that is using exponential normalization of a logarithmic formula. The exponential function is used to average the weight on the moving average while the logarithmic function is used to calculate the overall price effect.
Features and Settings:
◻️ Following rate of change instead of absolute levels
◻️ Choose input source of the data
◻️ Real time signals through price interaction
◻️ Change ELMA length
◻️ Change the exponential decay rate
◻️ Customize base color and signal color
Equation of the ELMA:
This formula calculates a weighted average of the logarithm of prices, where more recent prices have a higher weight. The result is then exponentiated to return the ELMA value. This approach emphasizes the relative changes in price, making the ELMA sensitive to the % rate of change rather than absolute price levels. The decay rate can be adjusted in the settings.
Comparison EMA vs ELMA:
In this image we see the differences to the Exponential Moving Average.
Price Interaction and earlier Signals:
In this image we have added the bars, so we can see that the ELMA provides different signals of resistance and support zones and highlights them, by changing to the color yellow, when prices interact with the ELMA.
Strategy by trading Support and Resistance Zones:
The ELMA helps to evaluate trends and find entry points in bullish market conditions, and exit points in bearish conditions. When prices drop below the ELMA in a bull market, it is considered a buying signal. Conversely, in a bear market, it serves as an exit signal when prices trade above the ELMA.
Volatile Markets:
The ELMA works on all timeframes and markets. In this example we used the default value for Bitcoin. The ELMA clearly shows support and resistance zones. Depending on the asset, the length and the decay rate should be adjusted to provide the best results.
Real Time Signals:
Signals occur not after a candle closes but when price interacts with the ELMA level, providing real time signals by shifting color. (default = yellow)
Disclaimer* All analyses, charts, scripts, strategies, ideas, or indicators developed by us are provided for informational and educational purposes only. We do not guarantee any future results based on the use of these tools or past data. Users should trade at their own risk.
This work is licensed under Attribution-NonCommercial-ShareAlike 4.0 International
creativecommons.org
Moving_average
RWEDT Weighted Moving Average Overview:
The RWEDT MA, which is short for rolling, weighted, exponential, double exponential, and triple exponential, is a group of moving averages that were subjected to a log transformation to deal with the skewness of price, and the weight of each of these moving averages was also used for calculating the standard deviations from the mean.
Clearing a misunderstanding on Standard Deviation Bands and Moving Averages
Bands, such as standard deviation bands, are frequently misinterpreted as indicators of support and resistance levels or as "mean-reverting" indicators." However, this is not their intended purpose. Bands are statistical tools that provide ranges within which price (in this case) movements are expected to occur based on historical data. Deviations beyond these bands suggest a decrease in confidence in the model rather than a reversal back to a moving average or a "support/resistance level."
Example : Assuming you correctly applied a log transformation to your standard deviation bands to remove the right skew, and assuming your data closely resembles a normal distribution or some other type of symmetrical distribution, then the probability of a value being in the 2 standard deviation range is around 95%. This does not mean it will reject or go up, or mean revert. The price won't bounce from -2 STDEV 95% of the time; that is incorrect. It just tells you that around 95% of the values will be within the 2 SD range.
Moving averages, including the ones in this indicator, are often misinterpreted as signals of trend reversals or levels of "bouncing." What moving averages actually tell you is what the expected value is. It does not show where you expect the price to be in the future; it tells you that based on the lookback, the expected value is in the center, and the confidence you have in the estimate is the confidence interval or the standard deviation range.
Example: Let's say you enter a trade with a positive expected value (expecting the price to drift up), and we have the limits set at 95%. What it tells you is that as long as the price stays within the limits, you can be 95% certain the model isn't completely random. As the price moves further away from the average, or expected value, it tells you that the model is less likely to be correct.
RWEDT MA
This indicator comes with 5 moving averages, each log transformed to reduce the skewness and asymmetry of price as much as possible
Rolling
Weighted
Exponential
Double Exponential
Triple Exponential
The band standard deviation can be adjusted, and the standard deviations have the weight of all of the moving averages that are present in the indicator. The weight is not customizable.
Why this indicator is useful:
This indicator can tell you what the expected value is. Above the moving average signifies a positive expected value, and below the moving average signifies a negative expected value. As previously stated above, the price moving further from the expected value lets you know that you should have less confidence that the model is "correct," and you could see this as taking profits as the price deviates further from the expected value.
The importance of log-transforming prices for standard deviations and moving averages.
Symmetry: Logarithmic transformations can help achieve symmetry in the distribution of price data. Stock prices, for example, exhibit some type of right-skewed distribution, where large positive price movements are more common than large negative movements. Price also can't go below 0 but can go towards positive infinity, so having a right-skew makes sense; all the outliers will be towards infinity, while all the average occurrences are "near" 0.
Stabilizing Variance: Price data typically exhibit heteroscedasticity, meaning that the variance of price movements changes over time. Log transformations can stabilize the variance and make it more consistent across different price levels. This is important for ensuring that the variability in price moves is not disproportionately influenced by extreme values.
Statistical Assumptions: Many retail indicators like Bollinger Bands use the standard deviation and moving average models of a normal distribution to attempt to model price, whose distribution more closely resembles some type of right-skew distribution. Even with the log-transformation, it still won't always resemble a perfect symmetrical distribution, and you still should not use it for mean reversion. You can still use it to understand the expected value and whether or not you should have confidence in your model.
The OG Outback [TTF]The Outback indicator
After a major overhaul of our Outback strategy, we decided that we would make our original version available for anyone to use.
The fundamental element of this indicator is based on price action relative to a slow moving average. That said, given that price will always tend towards a moving average, we have also implemented a method for helping filter out false signals leveraging a "consolidation cloud" and fast moving average. This, coupled with references to a customized version of the Relative Strength Index (RSI), has enabled us to provide significantly higher quality signals relating to price crossing a moving average.
Note: For this version, we have only prepared a single set of conditions and alerts (as noted by the 🦘 symbols). However it's worth noting there are several variations that can be done with some fundamental technical analysis and referencing additional indicators that can take this foundation and build upon it for a substantial increase in risk/reward and profit targets.
Leading T3Hello Fellas,
Here, I applied a special technique of John F. Ehlers to make lagging indicators leading. The T3 itself is usually not realling the classic lagging indicator, so it is not really needed, but I still publish this indicator to demonstrate this technique of Ehlers applied on a simple indicator.
The indicator does not repaint.
In the following picture you can see a comparison of normal T3 (purple) compared to a 2-bar "leading" T3 (gradient):
The range of the gradient is:
Bottom Value: the lowest slope of the last 100 bars -> green
Top Value: the highest slope of the last 100 bars -> purple
Ehlers Special Technique
John Ehlers did develop methods to make lagging indicators leading or predictive. One of these methods is the Predictive Moving Average, which he introduced in his book “Rocket Science for Traders”. The concept is to take a difference of a lagging line from the original function to produce a leading function.
The idea is to extend this concept to moving averages. If you take a 7-bar Weighted Moving Average (WMA) of prices, that average lags the prices by 2 bars. If you take a 7-bar WMA of the first average, this second average is delayed another 2 bars. If you take the difference between the two averages and add that difference to the first average, the result should be a smoothed line of the original price function with no lag.
T3
To compute the T3 moving average, it involves a triple smoothing process using exponential moving averages. Here's how it works:
Calculate the first exponential moving average (EMA1) of the price data over a specific period 'n.'
Calculate the second exponential moving average (EMA2) of EMA1 using the same period 'n.'
Calculate the third exponential moving average (EMA3) of EMA2 using the same period 'n.'
The formula for the T3 moving average is as follows:
T3 = 3 * (EMA1) - 3 * (EMA2) + (EMA3)
By applying this triple smoothing process, the T3 moving average is intended to offer reduced noise and improved responsiveness to price trends. It achieves this by incorporating multiple time frames of the exponential moving averages, resulting in a more accurate representation of the underlying price action.
Thanks for checking this out and give a boost, if you enjoyed the content.
Best regards,
simwai
---
Credits to @loxx

Normalised Gaussian MACD Heikin Ashi [AlgoAlpha]🌟🚀Introducing the Normalised Gaussian MACD Heikin Ashi by AlgoAlpha !
Elevate your trading game with this multipurpose indicator, crafted to pinpoint trend continuation opportunities while highlighting volatility and oversold/overbought conditions. Whether you're embarking on your trading journey or you're a seasoned market navigator, this tool is equipped with intuitive visual cues to amplify your decision-making prowess and enrich your market analysis toolkit. Let's dive into the key features, utilization strategies, and the innovative logic underpinning this indispensable trading asset.
Key Features:
🔧 Enhanced Customization : Tailor your experience with adjustable parameters including Fast Length, Slow Length, Source, Macd Smoothing Length, Signal Smoothing, and more.
🖌️ Visual Enhancements : Opt for Heikin Ashi Candles display and choose to show or hide MACD and Signal lines for a clutter-free chart.
🌈 Color Customization : Personalize your chart with selectable primary and secondary up and down colors to suit your visual preferences.
🔔 Advanced Alert System : Stay ahead with comprehensive alert conditions for market movements, including trend reversals, bullish and bearish swings.
How to Use:
Configure the Inputs : Start by customizing the indicator’s settings to match your trading style. Adjust the length parameters, source selection, and smoothing lengths to fine-tune the indicator’s sensitivity.
Interpret the Candles and Colors : Keep an eye on the Heikin Ashi Candles (if enabled) and the color shifts within the MACD Line Candles and Histogram. These visual cues are pivotal for identifying market trends.
Analyze with Flexibility : Make use of the option to display or hide the MACD and Signal lines based on your analysis requirements. This can help in focusing on the essential information without overcrowding your chart.
Utilize Alerts for Timely Decisions : Leverage the extensive alert system to get notified about potential market movements. These alerts can help you capture the right moment to enter or exit trades.
Basic Logic:
The Normalised Gaussian MACD Heikin Ashi by AlgoAlpha integrates Gaussian filters to elevate the traditional MACD indicator's efficiency, providing a more detailed analysis of market trends and momentum. This sophisticated approach reduces noise and enhances signal speed, which is crucial for identifying momentum trading opportunities.
Gaussian Filter Implementation : The core innovation lies in applying a Gaussian filter to the input price series. This mathematical technique smooths the price data, significantly reducing market noise and making trend signals clearer and more reliable. The Gaussian filter calculates a smoothed value for each data point by weighting nearby data points, with the weights decreasing as the distance from the current data point increases.
Refined MACD Calculation : The Gaussian MACD is derived from the difference between two Gaussian smoothed moving averages (fast and slow), which are then normalized to account for market volatility. This normalization process involves dividing the difference by a measure of market range (such as the high minus the low), and multiplying by a factor (usually 100) to scale the indicator appropriately.
🔑 This script is a versatile tool designed to aid in the identification of momentum and reversals, helping traders to make informed decisions based on technical analysis. Its customization options allow for a tailored analysis experience, fitting the unique needs and strategies of each trader.
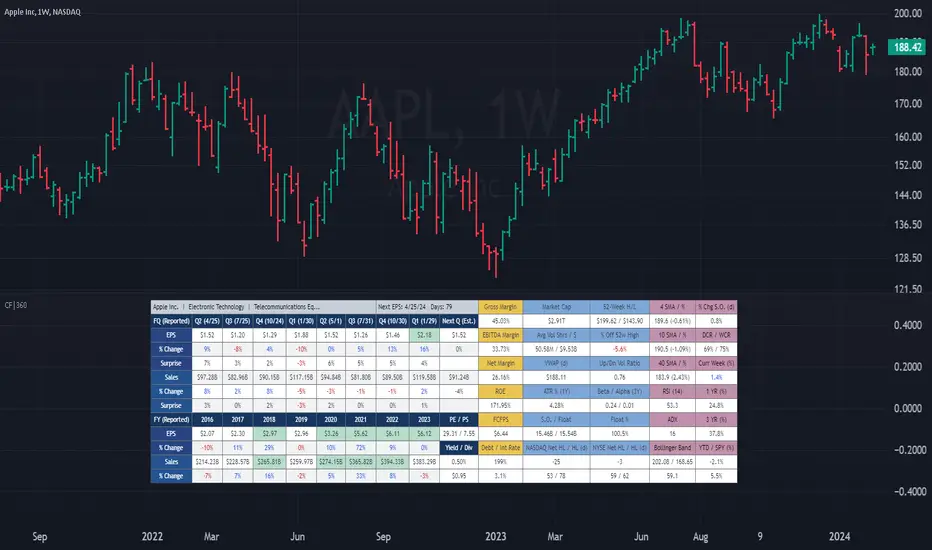
(CF|360) Caruso Financial DashboardThe Caruso Financial 360 Dashboard (CF|360) revolutionizes your TradingView charts by seamlessly integrating comprehensive Fundamental, Statistical, Technical, Performance, and Event information into an intuitively organized dashboard. This empowers users to make informed investment decisions effortlessly, eliminating the need to switch between pages or applications.
The dashboard is strategically divided into five distinct sections, each color-coded for user-friendly navigation. A quick glance at the dark blue "Fundamentals" table reveals two years of quarterly EPS and Sales data, YoY % change, and Surprise %, complete with report dates. Users can explore eight years of annual data and choose between Non-GAAP EPS, Diluted EPS, and Basic EPS for versatile analysis. Opting for Non-GAAP EPS also unveils next quarter estimates. The Fundamentals section further encompasses P/E and P/S data, alongside TTM dividend and dividend yield information.
In the yellow "Extended Fundamentals" section, users gain insights into Gross, EBITDA, and Net margins for easy profitability comparisons within the same industry group. Return on Equity data and Free Cashflow per share provide perspectives on profitability, efficiency, and financial flexibility.
The light blue "Statistics" section furnishes essential statistical measures for a rapid grasp of a company's trading characteristics. Metrics such as Market Cap, Average Volume per day (Shares and $ value), VWAP, Up/Down volume ratio, ATR%, Alpha, Beta, Shares Outstanding & Float, 52-week High/Low, and % distance from the 52-week high are presented. Additionally, market breadth is depicted through Nasdaq and NYSE 52-week high/low data.
The purple "Technical & Performance" section seamlessly integrates both Technical Analysis data and Performance statistics, enabling users to assess the stock's technical context and performance against the market over different periods. Technical indicators, including three customizable moving average types, RSI, ADX, Bollinger Band, Keltner Band, and daily and weekly closing ranges, are featured.
The grey top "Events" section offers a quick overview of the next earnings release date, countdown, and associated color changes as the date approaches. Company name, sector, and industry details are also presented.
To enhance information visibility, record EPS and Sales data are highlighted, emphasizing new records, along with highlights for new 52-week highs and lows.
The CF|360 offers customization options , including three display styles for Desktops, Desktop Slim, and Mobile devices.
Users can also tailor the lengths of technical indicators to suit their preferences. International market enthusiasts will appreciate that the CF|360 provides financial and market data for various regions, including the US, EU, Canada, and beyond.
88 Metrics Included:
Fundamentals Section (Dark Blue Group)
EPS (Adjusted Non-GAAP, Diluted, Basic)
- Quarterly, YoY % Chg, Surprise, Report Date, Next Quarter Estimate (Adjusted EPS only)
- Annual, YoY % Chg
Sales
- Quarterly, YoY % Chg, Surprise, Report Date, Next Quarter Estimate
- Annual, YoY % Chg
P/E ratio
P/S ratio
Dividend TTM
Dividend TTM Yield
Fundamentals Extended (Yellow Group)
Gross Margin
EBITDA Margin
Net Margin
Return on Equity (ROE)
Free Cashflow per Share (FCFPS)
Debt to Equity (Debt)
Effective Interest Rate (Int Rate)
Statistics (Light Blue Group)
Market Cap
Average Daily Volume (Shares)
Average Daily Volume (Dollar Value)
VWAP (Daily)
Average True Range Percent
Shares Outstanding
Shares in Float
Percentage of Share in Float
52-Week High
52-Week Low
% off of 52-Week High
Up / Down Volume Ratio
Beta
Alpha
Nasdaq Net 52-Week High/Lows
Nasdaq 52-Week Highs
Nasdaq 52-Week Lows
NYSE Net 52-Week High/Lows
NYSE 52-Week Highs
NYSE 52-Week Lows
Technical & Performance (Purple Group)
Moving Average Value (3 different averages)
Distance from Moving Average (3 different averages)
Relative Strength Index (RSI)
Average Directional Index (ADX)
Bollinger Band Value (Upper/Lower)
%b
Keltner Band Value (Upper/Lower)
%k
Percentage Changes Since Today’s Open
Daily Closing Range (DCR)
Weekly Closing Range (WCR)
Current Week % Change
1 Month % Change
3 Month % Change
6 Month % Change
1 Year % Change
3 Year % Change
YTD % Change
S&P 500 YTD % Change
Name, Group, & Events (Grey Section)
Company Name
Sector
Industry
Next Earnings Date
Days Until Next Earnings Date
Event Highlights
Record EPS (Quarterly/Annual)
Record Sales (Quarterly/Annual)
52-Week High
52-Week Low
Layout Types
Desktop
Get the full experience with the Desktop view.
Desktop Slim
Save screen real estate with a slim version of the dashboard.
Mobile
Take the most vital metrics with you on your mobile device. For the best experience, view in landscape mode.
series_collectionLibrary "series_collection"
A personal collection of commonly used series types like moving averages that are supported directly by
the pinescript library ('ALMA', 'DEMA', 'EMA', 'HMA', 'RMA', 'SMA', 'SWMA', 'VWMA', 'WMA'), highest and lowest source,
median and pivots. One single function (with overloads) that can be configured easily by the user input and can be
used as a core piece of functionality for many user cases. This library was created to abstract away and re-use this
commonly used functionality in my "Two MA Signal Indicator" script and the "Template Trailing Strategy" script. Both
of them use the "two_ma_logic" for defining entry and exit signals. While this piece of work does not contain any
novel mathematical expressions and just adds a convinient (and configurable) way to do things, I hope that might add
value to other scripts as well and future projects.
cust_series(length, seriesType, source)
cust_series - Calculate the custom series of the given source for the given length and type
Parameters:
length (simple int) : - The length of the custom series
seriesType (simple string) : - The type of the custom series
source (float) : - The source of the values
Returns: - The resulting value of the calculations of the custom series
cust_series(length, seriesType, source)
cust_series - Calculate the custom series of the given source for the given length and type
Parameters:
length (simple float) : - The length of the custom series (ceiled)
seriesType (simple string) : - The type of the custom series
source (float) : - The source of the values
Returns: - The resulting value of the calculations of the custom series

EMA + Lower Timeframe EMA (correct display in Replay Mode)This indicator shows
one EMA for the current timeframe
one EMA for a lower timeframe
Unlike the built-in Tradingview EMA indicator, this indicator shows the correct values for the lower timeframe EMA during Replay Mode.
Liquidity Weighted Moving Averages [AlgoAlpha]Description:
The Liquidity Weighted Moving Averages by AlgoAlpha is a unique approach to identifying underlying trends in the market by looking at candle bars with the highest level of liquidity. This script offers a modified version of the classical MA crossover indicator that aims to be less noisy by using liquidity to determine the true fair value of price and where it should place more emphasis on when calculating the average.
Rationale:
It is common knowledge that liquidity makes it harder for market participants to move the price of assets, using this logic, we can determine the coincident liquidity of each bar by looking at the volume divided by the distance between the opening and closing price of that bar. If there is a higher volume but the opening and closing prices are near each other, this means that there was a high level of liquidity in that bar. We then use standard deviations to filter out high spikes of liquidity and record the closing prices on those bars. An average is then applied to these recorded prices only instead of taking the average of every single bar to avoid including outliers in the data processing.
Key features:
Customizable:
Fast Length - the period of the fast-moving average
Slow Length - the period of the slow-moving average
Outlier Threshold Length - the period of the outlier processing algorithm to detect spikes in liquidity
Significant Noise reduction from outliers:
Blockunity Excess Index (BEI)Identify excess zones resulting in market reversals by visualizing price deviations from an average.
The Excess Index (BEI) is designed to identify excess zones resulting in reversals, based on price deviations from a moving average. This moving average is fully customizable (type, period to be taken into account, etc.). This indicator also multiplies the moving average with a configurable coefficient, to give dynamic support and resistance levels. Finally, the BEI also provides reversal signals to alert you to any risk of trend change, on any asset.
The Idea
The goal is to provide the community with a visual and customizable tool for analyzing large price deviations from an average.
How to Use
Very simple to use, this indicator plots colored zones according to the price's deviation from the moving average. Moving average extensions also provide dynamic support and resistance. Finally, signals alert you to potential reversal points.
Elements
The Moving Average
The Moving Average, which defaults to a gray line over 200 periods, serves as a stable reference point. It is accompanied by an Index, whose color varies from yellow to orange to red, offering an overview of market conditions.
Extensions
These dynamic lines can be used to determine effective supports and resistances.
Signals
Green and red triangles serve as clear indicators for buy and sell signals.
Settings
Mainly, the type of moving average is configurable. The default is an SMA.
A Simple Moving Average (SMA) calculates the average of a selected range of prices by the number of periods in that range.
But you can also, for example, switch the mode to EMA.
The Exponential Moving Average (EMA) is a moving average that places a greater weight and significance on the most recent data points:
You also have WMA.
A Weighted Moving Average (WMA) gives more weight on recent data and less on past data:
And finally, the possibility of having a PCMA.
PCMA takes into account the highest and lowest points in the lookback period and divides this by two to obtain an average:
You can change other parameters such as lookback periods, as well as the coefficient used to define extension lines.
You can refer to the tooltips directly in the indicator parameters.
For those who prefer a minimalist display, you can activate a "Bar Color" in the settings (You must also uncheck "Borders" and "Wick" in your Chart Settings), and deactivate all other elements as you wish:
Finally, you can customize all the different colors, as well as the parameters of the table that indicates the Index value and the asset trend.
How it Works
The Index is calculated using the following method:
abs_distance = math.abs(close - base_ma)
bei = (abs_distance - ta.lowest(abs_distance, lookback_norm)) / (ta.highest(abs_distance, lookback_norm) - ta.lowest(abs_distance, lookback_norm)) * 100
Signals are triggered according to the following conditions:
A Long (buy) signal is triggered when the Index falls below 100, when the closing price is lower than 5 periods ago, and when the price is under the moving average.
A Short (sell) signal is triggered when the Index falls below 100, when the closing price is greater than 5 periods ago, and when the price is above the moving average.

BTC Halving [YinYangAlgorithms]This Indicator not only estimates what it thinks may be the PRICE for the Start, High and Low of the Halving, but likewise estimates WHEN the Start, High and Low of Halving may be. It then creates Trend Lines based on these predictions so that you may get an evaluation towards if the Price is currently Overbought or Oversold. These Trend Lines may be very useful for seeing the Slope in which the Price may move if it is to reach the estimated Price by the estimated Date. By evaluating the Prices location based on these Trend Lines we may determine if the Price is currently Overbought or Oversold.
These Trend Lines likewise may help identify locations of Support and Resistance. If the Price is much higher than its current Trend Line it is Overbought. There is a chance it will Consolidate back to the Trend Line or it may even correct with a dump all the way back to it; the opposite is true if it is much lower than its current Trend Line.
Trend Lines and Estimates are not all that is featured within this Indicator however. There are also Price Zones which may help identify if the price is currently:
Very Overbought (Red)
Slightly Overbought (Orange)
Neutral (Yellow)
Slightly Oversold (Teal)
Very Oversold (Green)
These zones may help give you an idea of how the price is currently fairing and its potential for movement. Likewise, it may help define where Support and Resistance may be found.
The trend line estimates are done with an algorithm created to evaluate the difference between price and % change that has occurred between the Start, High and Low of all the halvings over how many days between each data type. This may allow us to make an educated estimate towards what Price and Date the Start, High and Low will occur at.
Our Zones are created by evaluating the current Market Cap and circulating supply vs Max Supply of BTC. This may help give us an evaluation of what Price may be considered to be Overbought and Oversold; and likewise may help with estimations of where there may be Support and Resistance based on these Zones.
Tutorial:
In the example above we’re displaying the Halving Start Trend Line, our Information Tables and our Estimated Halving Vertical Marker. This Trend Line may help to display not only the trajectory and slope the Price needs to take to reach the Estimated Halving Price by the Estimated Halving Date; but it may also help to show if the price is Overvalued or Undervalued based on its position above or below this Trend Line.
Based on the Trajectory of the Estimated High Upward Trend Line (Green Line) in the photo above and from the ‘High Date’ estimated in the Information tables; we may attempt to estimate the location the ATH of this Bull Market will create and the price slope it may follow in doing so. This Trajectory may be very useful for understanding the price action that may occur for it to reach the High estimated Price by the High estimated Date.
We currently allow for two different types of zones within our Settings, one called ‘Fast’ displayed in the example above; and the other called ‘Slow’ displayed in the example below.
Our Fast Zone aims to move the Zone Levels Faster in an attempt to move with volatility and parabolic movement. This may help to keep the Very Overbought (Red) and Very OverSold (Green) Levels more accurate by attempting to keep the price within them. By doing so, we may aim to keep all of the Slightly Overbought, Slightly Oversold and Neutral Levels more accurate as well.
The Levels within these zones are defined by the Bright (less transparent) Lines. Whereas the Darker (more transparent) lines represent the Basis Lines between two different levels. These Basis lines may likewise act as a Support and Resistance Location too, but generally hold less weight than the actual Levels themselves.
What you may see is that during the Bull Market, the price is within the very Overbought Zones and even touches again the Very Overbought Level a few times. Likewise, during the Bear Market, the price is within the very Oversold Zones and even slightly drops below the Very Oversold Level. This may be expected and likewise may help to give estimates at potential for growth and decay within the Price based on which condition the Market is within.
Slow Zones move a little slower than Fast Zones, however they may still be accurate. Likewise, it is up to you to decide which Zone works better for your specific Trading Style; however, by default, the Zone type is set to Fast.
If you refer to both the Fast and Slow examples above, you may notice in the Fast the Price is only slightly above the ‘Slightly Oversold’ (Teal) line. Also, In the Fast, the Price where the ‘Very Overbought’ Level is 100k. This is one of the many reasons we’ve opted for ‘Fast’ as the default, and it is because it allows more room for movement; and in our opinion, potentially accuracy as well.
If you refer to the Slow example, you’ll see that the price is currently facing the Neutral Level as a Resistance location. However, if you refer to the price residing at the Slows ‘Very Overbought’ Level, it is only 81.5k, compared to the 100k of Fast.
The BTC Halving is a major event that takes place roughly every 4 years. It historically has a major impact on the market, and some may even say it signifies the Start, or close to start of the Bull Market. Therefore, since historically there may be cycles that BTC and potentially crypto itself follows, we’ve developed this Indicator in hopes that it may solve one of the biggest questions traders face. What Date will the Start, High and Low of the Halving occur and also at what Price.
Hopefully this Tutorial has given you some guidance as to how this Indicator may be used to help identify some of these key levels; including the slope at which the price may have to move if it is to reach its projection Price by its projected Date.
Settings:
1. Show Prediction Trend Lines:
- Options:
All
Start + High
Start + Low
High + Low
Start
High
Low
None
- Description:
Prediction Trend Lines may be an important way to see the Slope the Price needs to take to reach the Predicted Price by the Predicted Date. This may be useful for identifying if the Price is currently Overbought or Oversold.
2. Zone Type:
- Options:
Fast
Slow
- Description:
Zone types change the way the Zones expand.
3. Show Zones:
- Options:
All
Zones
Basis
None
- Description:
Zones are a way of seeing Overbought and Oversold Price locations based on Market Cap and Circulating Supply vs Max Supply.
4. Vertical Markers:
- Options:
All
Line
Label
None
- Description:
Vertical Markers display where the Halving has occurred with a Vertical Line and Label.
5. Show Tables:
Tables may be useful for seeing the Price and Date for when the Start, High and Low of the Halving may occur.
6. Fill Zones:
Filling in Zones may help to identify which Zone the Price is currently in.
If you have any questions, comments, ideas or concerns please don't hesitate to contact us.
HAPPY TRADING!

WPO Modified [BackQuant]The Wave Period Oscillator (WPO), developed by Akram El Sherbini, is a sophisticated technical analysis tool that offers traders a dynamic way to interpret market cycles. Its design is inspired by the natural ebb and flow of markets, which often follow cyclical patterns driven by underlying economic, political, and psychological factors. The oscillator's unique contribution to market analysis lies in its ability to smooth out the "noise" inherent in daily price movements, thus providing a clearer view of the market's rhythmic fluctuations over time.
-----> Time Cycle Oscillators' in the IFTA Journal 2018 (page 66 - 77), as found below:
ifta.org
El Sherbini's WPO is grounded in the concept of wave period analysis, which suggests that financial markets move in waves or cycles. The oscillator translates these movements into a visual tool that oscillates above and below a central zero line. Peaks and troughs on the oscillator correspond to the crests and troughs of market price waves, providing a visual representation of the market's heartbeat.
The WPO is not merely a tool for identifying trends but also for detecting shifts in market momentum. It does this through a mathematical model that measures divergence—when the direction of the oscillator deviates from the direction of price movement. Such divergences can be precursors to potential reversals or continuations in the market, offering traders advance notice of significant changes in price direction.
Further refining its utility, the WPO incorporates methods for calculating divergence that are sensitive to the unique conditions of different markets and securities. This includes adjusting for volatility and market velocity, allowing the oscillator to provide relevant signals regardless of the market environment.
In practical terms, traders use the WPO to time their entries and exits with greater precision. When the oscillator shows a high peak or a deep trough, it can signal that a market is potentially overbought or oversold, respectively. The WPO's smoothing property ensures that these signals are not just reactionary to short-term price spikes or drops, but indicative of more substantial, sustained movements.
By providing a more measured and smoothed analysis of market cycles, the WPO helps to filter out insignificant price movements and focus on the ones that matter—those that indicate a significant wave of buying or selling pressure. This can be particularly valuable in the cryptocurrency markets, where volatility is high, and traditional indicators may struggle to provide clear signals.
For traders and analysts alike, the Wave Period Oscillator represents a convergence of technical precision and market psychology. By focusing on the periodic nature of market movements, it aligns traders with the rhythm of the markets, potentially leading to more harmonious trading decisions that are in step with the market's natural waves.
Please see the backtest here:
For more simple terms:
You can use this indicator as a the oscillator
Above 0 for long
Below 0 for short
OR
WPO MA
Above 0 for long
Below 0 for short

Machine Learning: STDEV Oscillator [YinYangAlgorithms]This Indicator aims to fill a gap within traditional Standard Deviation Analysis. Rather than its usual applications, this Indicator focuses on applying Standard Deviation within an Oscillator and likewise applying a Machine Learning approach to it. By doing so, we may hope to achieve an Adaptive Oscillator which can help display when the price is deviating from its standard movement. This Indicator may help display both when the price is Overbought or Underbought, and likewise, where the price may face Support and Resistance. The reason for this is that rather than simply plotting a Machine Learning Standard Deviation (STDEV), we instead create a High and a Low variant of STDEV, and then use its Highest and Lowest values calculated within another Deviation to create Deviation Zones. These zones may help to display these Support and Resistance locations; and likewise may help to show if the price is Overbought or Oversold based on its placement within these zones. This Oscillator may also help display Momentum when the High and/or Low STDEV crosses the midline (0). Lastly, this Oscillator may also be useful for seeing the spacing between the High and Low of the STDEV; large spacing may represent volatility within the STDEV which may be helpful for seeing when there is Momentum in the form of volatility.
Tutorial:
Above is an example of how this Indicator looks on BTC/USDT 1 Day. As you may see, when the price has parabolic movement, so does the STDEV. This is due to this price movement deviating from the mean of the data. Therefore when these parabolic movements occur, we create the Deviation Zones accordingly, in hopes that it may help to project future Support and Resistance locations as well as helping to display when the price is Overbought and Oversold.
If we zoom in a little bit, you may notice that the Support Zone (Blue) is smaller than the Resistance Zone (Orange). This is simply because during the last Bull Market there was more parabolic price deviation than there was during the Bear Market. You may see this if you refer to their values; the Resistance Zone goes to ~18k whereas the Support Zone is ~10.5k. This is completely normal and the way it is supposed to work. Due to the nature of how STDEV works, this Oscillator doesn’t use a 1:1 ratio and instead can develop and expand as exponential price action occurs.
The Neutral (0) line may also act as a Support and Resistance location. In the example above we can see how when the STDEV is below it, it acts as Resistance; and when it’s above it, it acts as Support.
This Neutral line may also provide us with insight as towards the momentum within the market and when it has shifted. When the STDEV is below the Neutral line, the market may be considered Bearish. When the STDEV is above the Neutral line, the market may be considered Bullish.
The Red Line represents the STDEV’s High and the Green Line represents the STDEV’s Low. When the STDEV’s High and Low get tight and close together, this may represent there is currently Low Volatility in the market. Low Volatility may cause consolidation to occur, however it also leaves room for expansion.
However, when the STDEV’s High and Low are quite spaced apart, this may represent High levels of Volatility in the market. This may mean the market is more prone to parabolic movements and expansion.
We will conclude our Tutorial here. Hopefully this has given you some insight into how applying Machine Learning to a High and Low STDEV then creating Deviation Zones based on it may help project when the Momentum of the Market is Bullish or Bearish; likewise when the price is Overbought or Oversold; and lastly where the price may face Support and Resistance in the form of STDEV.
If you have any questions, comments, ideas or concerns please don't hesitate to contact us.
HAPPY TRADING!

ATR Based Stoploss - TakeProfit [CharmyDexter]
This script combines the power of Average True Range (ATR) and a Moving Average (MA) to dynamically set stop-loss and take-profit levels. It introduces a volatility surge condition and includes a risk management table for comprehensive trade insights.
1) **Originality:**
- This script is original in its approach to combining Average True Range (ATR) with a Moving Average (MA) to create a dynamic stop-loss and take-profit strategy. The addition of a volatility surge condition and the inclusion of a risk management table further contribute to its uniqueness.
2) **Functionality:**
- The script aims to provide traders with a dynamic stop-loss and take-profit strategy based on ATR, incorporating a volatility surge condition and a moving average. The risk management table displays crucial information, including the fund size, potential profit/loss, ATR values, and risk.
3) **Operation:**
- The script uses ATR to calculate volatility, identifying surges in volatility. It adjusts the stop-loss and take-profit levels based on the average of ATR during these surge periods. The moving average acts as a trend indicator, and the script dynamically adjusts stop-loss and take-profit levels accordingly.
4) **Usage:**
- Traders can use this script by applying it to their preferred financial instrument's chart. The script automatically plots the moving average and dynamically adjusts stop-loss and take-profit levels based on ATR and volatility surges. Users can observe the levels on the chart for potential trade management.
5) **Concepts:**
- The script employs concepts of ATR for volatility, moving average for trend identification, and a dynamic adjustment mechanism during volatility surges. Risk management is incorporated by calculating potential profit/loss percentages based on user-defined risk.
6) **Mashup Explanation:**
- The script combines ATR, moving average, and volatility conditions to create a comprehensive strategy. ATR determines the market's volatility, the moving average serves as a trend indicator, and volatility surges trigger dynamic adjustments to stop-loss and take-profit levels. The risk management table enhances the script's utility.
7) **Line Descriptions:**
- Blue Line (Moving Average): Indicates the trend direction.
- Lime Line (Long Take Profit): Represents the level for taking profit in a long position.
- Maroon Line (Short Take Profit): Represents the level for taking profit in a short position.
- Fuchsia Line (Short Stop Loss): Represents the level for setting a stop loss in a short position.
- Orange Line (Long Stop Loss): Represents the level for setting a stop loss in a long position.
8) **Line Usage:**
- Use the blue line for trend identification.
- When taking long positions, the close should be above the blue line.
- For long positions, the lime line is a potential take-profit level, and the orange line is a potential stop-loss level.
- For short positions, the maroon line is a potential take-profit level, and the fuchsia line is a potential stop-loss level.
- The risk management table provides insights into fund size, potential profit/loss, ATR values, and risk.
Note: The profit/loss calculations in this script may not be entirely accurate due to factors like market execution. Market execution may not always occur at the exact levels specified by the script due to slippage or delays in order processing. This can impact the realized profit or loss compared to the calculated levels.
It is crucial to note that this ATR Based Stop-loss - Take-Profit indicator is merely one tool among many that traders can employ to establish trading targets. Additional technical indicators are essential for taking trades and making informed decisions.
Commented-out sections for alerts and shape plotting are provided, allowing for visual and auditory notifications if desired.
It's crucial for traders to be aware of these factors and use the script as a tool within a broader trading strategy. Additionally, regular monitoring and adjustments based on real-time market conditions are recommended to enhance the accuracy of profit/loss assessments.
SMA Cross with a Price FilterA moving average strategy generates an entry (buy) signal when the price goes above the moving average, and an exit (sell) signal when the price goes below the moving average. But it gives lots of whipsaws and noise depends on the moving average we use. A fast moving average gives more whipsaws and a slow moving average gives less whipsaws. To reduce the noise/whipsaws, we can add a filter on a fast/slow moving average. It will improve entry/exit performance significantly specially for those who don't want to watch the market actively.
I created this indicator with a price filter. This means the price of an underlying asset must be at least a specific percentage above its moving average to generate a buy signal and a specific percentage below its moving average to generate a sell signal. This price filter can also be a confirmation after the price crosses above/below its SMA. I couldn't find any indicator yet based on this idea. So I wrote this indicator and publishing it so it helps those who are interested.
I use 200 SMA and 3% price filter as default and using SPY as an example. So,
ENTRY signal when the closing price of SPY is 3% above its 200 SMA.
EXIT signal when the closing price of SPY is 3% below its 200 SMA.
Enjoy and let me know if it works.
** This chart only generates entry (buy) and exit (sell) signals. Please, do your own diligence to make any investment or trading decisions.

Trend-based Price Action StrategyThis is a strategy script that combines trend-based price action analysis with the Relative Strength Index (RSI) and Exponential Moving Averages (EMA) as trend filters. Here's a summary of the key components and logic:
Price Action Candlestick Patterns:
Bullish patterns: Engulfing candle and Morning Star.
Bearish patterns: Engulfing candle and Evening Star.
RSI Integration:
RSI is used to identify overbought and oversold conditions.
EMA Trend Filter:
Three EMAs with different periods: Fast , Medium and Slow.
Long trend condition occur when the fast EMA is above the medium and the medium is above the slow EMA.
Short trend condition occur when the slow EMA is above the medium and the medium is above the fast EMA.
Long entry conditions: RSI is oversold, RSI is decreasing, bullish candlestick pattern, and EMA trend filter conditions are met.
Short entry conditions: RSI is overbought, RSI is decreasing, bearish candlestick pattern, and EMA trend filter conditions are met.
Exit conditions:
Take profit or stop loss is reached.
Plotting:
Signals are plotted on the chart when entry conditions are met.
EMAs are plotted when the EMA trend filter is enabled.
This script aims to capture potential trend reversal points based on a combination of candlestick patterns, RSI, and EMA trend analysis.
Traders can use this script as a starting point for further customization or as a reference for developing their own trading strategies. It's important to note that past performance is not indicative of future results, and thorough testing and validation are recommended before deploying any trading strategy.

[KVA] Extremes ProfilerExtremes Profiler is a specialized indicator crafted for traders focusing on the relationship between price extremes and moving averages. This tool offers a comprehensive perspective on price dynamics by quantifying and visualizing significant distances of current prices from various moving averages. It effectively highlights the top extremes in market movements, providing key insights into price extremities relative to these averages. The indicator's ability to analyze and display these distances makes it a valuable tool for understanding market trends and potential turning points. Traders can leverage the Extremes Profiler to gain a deeper understanding of how prices behave in relation to commonly watched moving averages, thus aiding in making informed trading decisions
Key Features :
Extensive MA Analysis : Tracks the price distance from multiple moving averages including EMA, SMA, WMA, RMA, and HMA.
Top 50 (100) Distance Metrics : Highlights the 50 (100)greatest (highest or lowest) distances from each selected MA, pinpointing significant market deviations.
Customizable Periods : Offers flexibility with adjustable periods to align with diverse trading strategies.
Comprehensive View : Switch between timeframes for a well-rounded understanding of short-term fluctuations and long-term market trends.
Cross-Asset Comparison : Utilize the indicator to compare different assets, gaining insights into the relative dynamics and volatility of various markets. By analyzing multiple assets, traders can discern broader market trends and better understand asset-specific behaviors.
Customizable Display : Users can adjust the periods and number of results to suit their analytical needs.

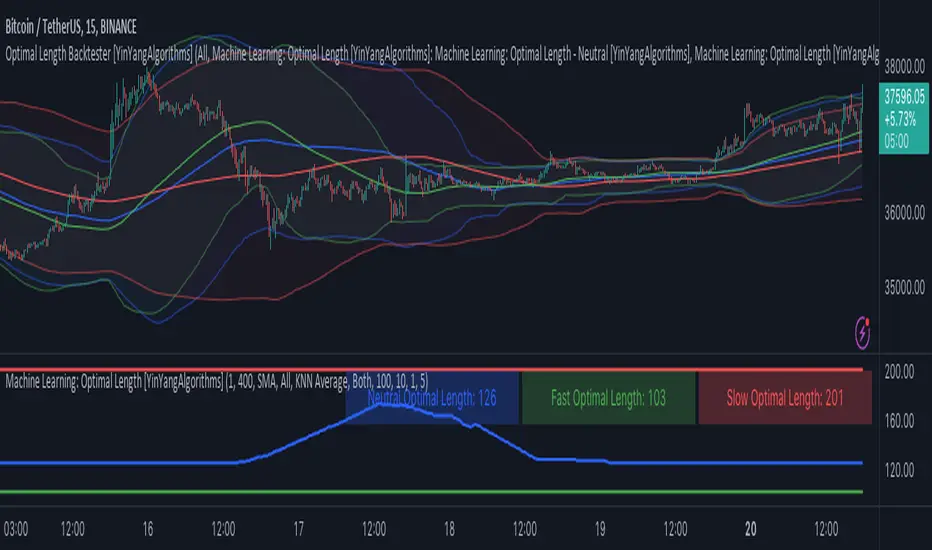
Machine Learning: Optimal Length [YinYangAlgorithms]This Indicator aims to solve an issue that most others face; static lengths. This Indicator will scan lengths from the Min to Max setting (1 - 400 by default) to calculate which is the most Optimal Length in the current market condition. Almost every Indicator uses a length in some part of their calculation, and this length is usually adjustable via the Settings; however it is generally a static fixed length. Static non changing lengths may not always produce optimal results. As market conditions change generally the optimal length will too. For this reason we have created this indicator.
This Indicator will create a Neutral (Min - Max Length), Fast (Min - Mid Length ((Max - Min) / 2)) and Slow (Mid Length ((Max - Min) / 2) - Max Length). This allows you to understand which the Optimal Fast, Slow and Neutral lengths are within the given Mix and Max length settings.
This Indicator then plots these Optimal Lengths as an Oscillator which can then be used within ANOTHER Indicator as a Source within its Settings. Stand alone this Indicator may not prove all that useful, however when its Lengths are inputted into another Indicator it may prove very useful. This allows other Indicators to use the Optimal Length within its calculations from the Settings rather than relying on simply a fixed length. Unfortunately this results in users needing to manually plug the Optimal Length plots into the second Indicator; but it also allows for endless possibilities with applying Machine Learning Optimal Lengths within both Traditional and Non-Traditional Indicators and may give other Pine Coders an easy and effective way to add Machine Learning auto adjustable lengths within their already created Indicators.
The beautiful part about this Indicator is that aside from inputting the Optimal Length Plot into another Indicator, there is no manual updating needed. When the Optimal Length changes, the change will automatically reflect in the other Indicator without the need for you to manually adjust its length. This may be very useful with both time preservation, as well as if there is an automated strategy based upon said Indicator that now won’t need manual intervention.
Tutorial:
By default this is what the Machine Learning: Optimal Length Indicator looks like. It is simply a way of both Displaying and Plotting our current Optimal Length so that we may then use it as a source within ANOTHER Indicator. This will allow the automation of an Optimal Length to be updated, rather than needing any manual input from yourself (aside from set up).
For instance if you set the start length to 1 and the end length to 400 (default settings), it will scan to find the optimal Length setting between 1 and 400. This features 3 types of lengths:
Fast (Green Line): 1-199 (from start length to half way of total)
Slow (Red Line): 200 - 400 (mid way to end length)
Neutral (Blue Line): 1 - 400 (start to end length)
By breaking down the Optimal Length detection into these 3 different types, we can see how the Optimal Length compares and changes based on the lengths allotted to them and how performance changes.
For instance, you may notice that both the Fast and Slow Optimal Length didn’t change much in the example above; however the Neutral Optimal Length changed quite a bit. This is due to the fact that the Neutral is inclusive of all lengths available and may be considered the more accurate due to that. However, this doesn’t mean the Fast and Slow lengths aren’t important and should be used. They may be useful for seeing how something fairs in a Fast and Slow standpoint.
If you change your TimeFrame from 15 minute to 1 Day, you’ll notice that the Optimal Lengths gravitate towards their upper bounds:
199 is max for Fast, it’s at 195
400 is max for Slow, its at 393
400 is max for Neutral, its at 399
The Optimal Length may move up to its upper bounds on Higher Time Frames because there is a lot of price action and long term data being displayed. This may lead to higher lengths performing better in a profitability standpoint since its data is based on so far back and such drastic price movements.
Below we’re going to go through a few examples, including the code so you may reproduce the example and have an understanding of how versatile Inputting an Optimal Length as a source may be within Traditional Indicators.
Adding the Machine Learning: Optimal Length to another Indicator:
You may add the Optimal Length to another Indicator as shown in the example above. In the example we are adding the ‘Machine Learning: Optimal Length - Neutral’ to our Neutral Length within the Settings. The external Indicator needs to have the ability to input the Optimal Length as a Source, this way it can automatically change within the external Indicator when the Optimal Length Indicator changes its Optimal Length.
Please note you may get an error within an external Indicator that accepts the Length as a Source if you don’t select the Machine Learning: Optimal Length. For instance, if you use ‘Close’ within BTC/USDT the length used would be ~36,000. This length is too long and will throw an error.
For this reason, we will ensure the Max Length that may be used is 1000.
Please note, on lower Time Frames you may need to adjust the Max Length. For instance if 20k bar data is used, the Max Length ‘may’ fail to load when going by default Min: 1 and Max: 400. Generally with most pairs it will load if your TradingView subscription is Premium or greater; however if it is less there is a chance it may fail. If it fails for you too often please lower the Max Length Amount; or send us a message we can look into a fix for this.
*** If it fails to load, please try removing the external Indicator and re-adding it and adding the Lengths back as a Source within the Settings. Sometimes it fails, but re-adding may fix it. If it keeps failing afterwards, reduce the Max Length Amount as mentioned above. ***
Simple Moving Average:
In this example above have the Fast, Slow and Neutral Optimal Length formatted as a Slow Moving Average. The first example is on the 15 minute Time Frame and the second is on the 1 Day Time Frame, demonstrating how the length changes based on the Time Frame and the effects it may have.
Here is the code for the example Indicator shown above. This example shows how you may use the Optimal Length as a Source and then use that Optimal Length and plot it as a Simple Moving Average:
//@version=5
indicator("Optimal Length - Backtesting - MA", overlay=true, max_bars_back=5000)
outputType = input.string("All", "Output Type", options= )
lengthSource = input.source(close, "Neutral Length")
lengthSource_fast = input.source(close, "Fast Length")
lengthSource_slow = input.source(close, "Slow Length")
showNeutral = outputType == "Neutral" or outputType == "Fast + Neutral" or outputType == "Slow + Neutral" or outputType == "All"
showFast = outputType == "Fast" or outputType == "Fast + Neutral" or outputType == "Fast + Slow" or outputType == "All"
showSlow = outputType == "Slow" or outputType == "Slow + Neutral" or outputType == "Fast + Slow" or outputType == "All"
//Neutral
optimalLength = math.min(math.max(math.round(lengthSource), 1), 1000)
optimalMA = ta.sma(close, optimalLength)
//Fast
optimalLength_fast = math.min(math.max(math.round(lengthSource_fast), 1), 1000)
optimalMA_fast = ta.sma(close, optimalLength_fast)
//Slow
optimalLength_slow = math.min(math.max(math.round(lengthSource_slow), 1), 1000)
optimalMA_slow = ta.sma(close, optimalLength_slow)
plot(showNeutral ? optimalMA : na, color=color.blue)
plot(showFast ? optimalMA_fast : na, color=color.green)
plot(showSlow ? optimalMA_slow : na, color=color.red)
Bollinger Bands:
In the two examples above for Bollinger Bands we have first the 15 Minute Time Frame and then the 1 Day Time Frame. As described above in ‘Adding the Machine Learning: Optimal Length to another Indicator’ sometimes it may fail to load, for this reason in the 15 Minute it was reduced to a max of 300 Length.
Bollinger Bands are a way to see a Simple Moving Average (SMA) that then uses Standard Deviation to identify how much deviation has occurred. This Deviation is than Added and Subtracted from the SMA to create the Bollinger Bands which help Identify possible movement zones that are ‘within range’. This may mean that the price may face Support / Resistance when it reaches the Outer / Inner bounds of the Bollinger Bands. Likewise, it may mean the Price is ‘Overbought’ when outside and above or ‘Underbought’ when outside and below the Bollinger Bands.
By applying All 3 different types of Optimal Lengths towards a Traditional Bollinger Band calculation we may hope to see different ranges of Bollinger Bands and how different lookback lengths may imply possible movement ranges on both a Short Term, Long Term and Neutral perspective. By seeing these possible ranges you may have the ability to identify more levels of Support and Resistance over different lengths and Trading Styles.
Below is the code for the Bollinger Bands example above:
//@version=5
indicator("Optimal Length - Backtesting - Bollinger Bands", overlay=true, max_bars_back=5000)
outputType = input.string("All", "Output Type", options= )
lengthSource = input.source(close, "Neutral Length")
lengthSource_fast = input.source(close, "Fast Length")
lengthSource_slow = input.source(close, "Slow Length")
showNeutral = outputType == "Neutral" or outputType == "Fast + Neutral" or outputType == "Slow + Neutral" or outputType == "All"
showFast = outputType == "Fast" or outputType == "Fast + Neutral" or outputType == "Fast + Slow" or outputType == "All"
showSlow = outputType == "Slow" or outputType == "Slow + Neutral" or outputType == "Fast + Slow" or outputType == "All"
mult = 2.0
src = close
neutralColor = color.blue
slowColor = color.red
fastColor = color.green
//Neutral
optimalLength = math.min(math.max(math.round(lengthSource), 1), 1000)
optimalMA = ta.sma(close, optimalLength)
//Fast
optimalLength_fast = math.min(math.max(math.round(lengthSource_fast), 1), 1000)
optimalMA_fast = ta.sma(close, optimalLength_fast)
//Slow
optimalLength_slow = math.min(math.max(math.round(lengthSource_slow), 1), 1000)
optimalMA_slow = ta.sma(close, optimalLength_slow)
//Neutral Bollinger Bands
dev = mult * ta.stdev(src, math.round(optimalLength))
upper = optimalMA + dev
lower = optimalMA - dev
plot(showNeutral ? optimalMA : na, "Neutral Basis", color=color.new(neutralColor, 0))
p1 = plot(showNeutral ? upper : na, "Neutral Upper", color=color.new(neutralColor, 50))
p2 = plot(showNeutral ? lower : na, "Neutral Lower", color=color.new(neutralColor, 50))
fill(p1, p2, title = "Neutral Background", color=color.new(neutralColor, 96))
//Slow Bollinger Bands
dev_slow = mult * ta.stdev(src, math.round(optimalLength_slow))
upper_slow = optimalMA_slow + dev_slow
lower_slow = optimalMA_slow - dev_slow
plot(showFast ? optimalMA_slow : na, "Slow Basis", color=color.new(slowColor, 0))
p1_slow = plot(showFast ? upper_slow : na, "Slow Upper", color=color.new(slowColor, 50))
p2_slow = plot(showFast ? lower_slow : na, "Slow Lower", color=color.new(slowColor, 50))
fill(p1_slow, p2_slow, title = "Slow Background", color=color.new(slowColor, 96))
//Fast Bollinger Bands
dev_fast = mult * ta.stdev(src, math.round(optimalLength_fast))
upper_fast = optimalMA_fast + dev_fast
lower_fast = optimalMA_fast - dev_fast
plot(showSlow ? optimalMA_fast : na, "Fast Basis", color=color.new(fastColor, 0))
p1_fast = plot(showSlow ? upper_fast : na, "Fast Upper", color=color.new(fastColor, 50))
p2_fast = plot(showSlow ? lower_fast : na, "Fast Lower", color=color.new(fastColor, 50))
fill(p1_fast, p2_fast, title = "Fast Background", color=color.new(fastColor, 96))
Donchian Channels:
Above you’ll see two examples of Machine Learning: Optimal Length applied to Donchian Channels. These are displayed with both the 15 Minute Time Frame and the 1 Day Time Frame.
Donchian Channels are a way of seeing potential Support and Resistance within a given lookback length. They are a way of withholding the High’s and Low’s of a specific lookback length and looking for deviation within this length. By applying our Fast, Slow and Neutral Machine Learning: Optimal Length to these Donchian Channels way may hope to achieve a viable range of High’s and Low’s that one may use to Identify Support and Resistance locations for different ranges of Optimal Lengths and likewise potentially different Trading Strategies.
The code to reproduce these Donchian Channels as displayed above is so:
//@version=5
indicator("Optimal Length - Backtesting - Donchian Channels", overlay=true, max_bars_back=5000)
outputType = input.string("All", "Output Type", options= )
lengthSource = input.source(close, "Neutral Length")
lengthSource_fast = input.source(close, "Fast Length")
lengthSource_slow = input.source(close, "Slow Length")
showNeutral = outputType == "Neutral" or outputType == "Fast + Neutral" or outputType == "Slow + Neutral" or outputType == "All"
showFast = outputType == "Fast" or outputType == "Fast + Neutral" or outputType == "Fast + Slow" or outputType == "All"
showSlow = outputType == "Slow" or outputType == "Slow + Neutral" or outputType == "Fast + Slow" or outputType == "All"
mult = 2.0
src = close
neutralColor = color.blue
slowColor = color.red
fastColor = color.green
//Neutral
optimalLength = math.min(math.max(math.round(lengthSource), 1), 1000)
optimalMA = ta.sma(close, optimalLength)
//Fast
optimalLength_fast = math.min(math.max(math.round(lengthSource_fast), 1), 1000)
optimalMA_fast = ta.sma(close, optimalLength_fast)
//Slow
optimalLength_slow = math.min(math.max(math.round(lengthSource_slow), 1), 1000)
optimalMA_slow = ta.sma(close, optimalLength_slow)
//Neutral Donchian Channels
lower_dc = ta.lowest(optimalLength)
upper_dc = ta.highest(optimalLength)
basis_dc = math.avg(upper_dc, lower_dc)
plot(showNeutral ? basis_dc : na, "Donchain Channel - Neutral Basis", color=color.new(neutralColor, 0))
u = plot(showNeutral ? upper_dc : na, "Donchain Channel - Neutral Upper", color=color.new(neutralColor, 50))
l = plot(showNeutral ? lower_dc : na, "Donchain Channel - Neutral Lower", color=color.new(neutralColor, 50))
fill(u, l, color=color.new(neutralColor, 96), title = "Donchain Channel - Neutral Background")
//Fast Donchian Channels
lower_dc_fast = ta.lowest(optimalLength_fast)
upper_dc_fast = ta.highest(optimalLength_fast)
basis_dc_fast = math.avg(upper_dc_fast, lower_dc_fast)
plot(showFast ? basis_dc_fast : na, "Donchain Channel - Fast Neutral Basis", color=color.new(fastColor, 0))
u_fast = plot(showFast ? upper_dc_fast : na, "Donchain Channel - Fast Upper", color=color.new(fastColor, 50))
l_fast = plot(showFast ? lower_dc_fast : na, "Donchain Channel - Fast Lower", color=color.new(fastColor, 50))
fill(u_fast, l_fast, color=color.new(fastColor, 96), title = "Donchain Channel - Fast Background")
//Slow Donchian Channels
lower_dc_slow = ta.lowest(optimalLength_slow)
upper_dc_slow = ta.highest(optimalLength_slow)
basis_dc_slow = math.avg(upper_dc_slow, lower_dc_slow)
plot(showSlow ? basis_dc_slow : na, "Donchain Channel - Slow Neutral Basis", color=color.new(slowColor, 0))
u_slow = plot(showSlow ? upper_dc_slow : na, "Donchain Channel - Slow Upper", color=color.new(slowColor, 50))
l_slow = plot(showSlow ? lower_dc_slow : na, "Donchain Channel - Slow Lower", color=color.new(slowColor, 50))
fill(u_slow, l_slow, color=color.new(slowColor, 96), title = "Donchain Channel - Slow Background")
Envelopes / Envelopes Adjusted:
Envelopes are an interesting one in the sense that they both may be perceived as useful; however we deem that with the use of an ‘Optimal Length’ that the ‘Envelopes Adjusted’ may work best. We will start with examples of the Traditional Envelope then showcase the Adjusted version.
Envelopes:
As you may see, a Traditional form of Envelopes even produced with our Machine Learning: Optimal Length may not produce optimal results. Unfortunately this may occur with some Traditional Indicators and they may need some adjustments as you’ll notice with the ‘Envelopes Adjusted’ version. However, even without the adjustments, these Envelopes may be useful for seeing ‘Overbought’ and ‘Oversold’ locations within a Machine Learning: Optimal Length standpoint.
Envelopes Adjusted:
By adding an adjustment to these Envelopes, we may hope to better reflect out Optimal Length within it. This is caused by adding a ratio reflection towards the current length of the Optimal Length and the max Length used. This allows for the Fast and Neutral (and potentially Slow if Neutral is greater) to achieve a potentially more accurate result.
Envelopes, much like Bollinger Bands are a way of seeing potential movement zones along with potential Support and Resistance. However, unlike Bollinger Bands which are based on Standard Deviation, Envelopes are based on percentages +/- from the Simple Moving Average.
The code used to reproduce the example above is as follows:
//@version=5
indicator("Optimal Length - Backtesting - Envelopes", overlay=true, max_bars_back=5000)
outputType = input.string("All", "Output Type", options= )
displayType = input.string("Envelope Adjusted", "Display Type", options= )
lengthSource = input.source(close, "Neutral Length")
lengthSource_fast = input.source(close, "Fast Length")
lengthSource_slow = input.source(close, "Slow Length")
showNeutral = outputType == "Neutral" or outputType == "Fast + Neutral" or outputType == "Slow + Neutral" or outputType == "All"
showFast = outputType == "Fast" or outputType == "Fast + Neutral" or outputType == "Fast + Slow" or outputType == "All"
showSlow = outputType == "Slow" or outputType == "Slow + Neutral" or outputType == "Fast + Slow" or outputType == "All"
mult = 2.0
src = close
neutralColor = color.blue
slowColor = color.red
fastColor = color.green
//Neutral
optimalLength = math.min(math.max(math.round(lengthSource), 1), 1000)
optimalMA = ta.sma(close, optimalLength)
//Fast
optimalLength_fast = math.min(math.max(math.round(lengthSource_fast), 1), 1000)
optimalMA_fast = ta.sma(close, optimalLength_fast)
//Slow
optimalLength_slow = math.min(math.max(math.round(lengthSource_slow), 1), 1000)
optimalMA_slow = ta.sma(close, optimalLength_slow)
percent = 10.0
maxAmount = math.max(optimalLength, optimalLength_fast, optimalLength_slow)
//Neutral
k = displayType == "Envelope" ? percent/100.0 : (percent/100.0) / (optimalLength / maxAmount)
upper_env = optimalMA * (1 + k)
lower_env = optimalMA * (1 - k)
plot(showNeutral ? optimalMA : na, "Envelope - Neutral Basis", color=color.new(neutralColor, 0))
u_env = plot(showNeutral ? upper_env : na, "Envelope - Neutral Upper", color=color.new(neutralColor, 50))
l_env = plot(showNeutral ? lower_env : na, "Envelope - Neutral Lower", color=color.new(neutralColor, 50))
fill(u_env, l_env, color=color.new(neutralColor, 96), title = "Envelope - Neutral Background")
//Fast
k_fast = displayType == "Envelope" ? percent/100.0 : (percent/100.0) / (optimalLength_fast / maxAmount)
upper_env_fast = optimalMA_fast * (1 + k_fast)
lower_env_fast = optimalMA_fast * (1 - k_fast)
plot(showFast ? optimalMA_fast : na, "Envelope - Fast Basis", color=color.new(fastColor, 0))
u_env_fast = plot(showFast ? upper_env_fast : na, "Envelope - Fast Upper", color=color.new(fastColor, 50))
l_env_fast = plot(showFast ? lower_env_fast : na, "Envelope - Fast Lower", color=color.new(fastColor, 50))
fill(u_env_fast, l_env_fast, color=color.new(fastColor, 96), title = "Envelope - Fast Background")
//Slow
k_slow = displayType == "Envelope" ? percent/100.0 : (percent/100.0) / (optimalLength_slow / maxAmount)
upper_env_slow = optimalMA_slow * (1 + k_slow)
lower_env_slow = optimalMA_slow * (1 - k_slow)
plot(showSlow ? optimalMA_slow : na, "Envelope - Slow Basis", color=color.new(slowColor, 0))
u_env_slow = plot(showSlow ? upper_env_slow : na, "Envelope - Slow Upper", color=color.new(slowColor, 50))
l_env_slow = plot(showSlow ? lower_env_slow : na, "Envelope - Slow Lower", color=color.new(slowColor, 50))
fill(u_env_slow, l_env_slow, color=color.new(slowColor, 96), title = "Envelope - Slow Background")
Hopefully these examples, including reproducing code, have given you some insight as to how useful this Machine Learning: Optimal Length may be and how another Indicator may easily modify their existing code to incorporate the usage of such Machine Learning: Optimal Length. We likewise will publish a Backtesting Indicator which incorporates all of the concepts we’ve gone over within here; in case you wish to take advantage of the Traditional Indicators mentioned above that allow the input of Machine Learning: Optimal Length and don’t wish to code them.
If you have any questions, comments, ideas or concerns please don't hesitate to contact us.
HAPPY TRADING!
K`s Extreme DurationExtreme duration uses a special combination of the RSI and its relative position to deliver a reversal signal.
The following are the conditions to generate signals:
* Bullish signal: The current 8-period RSI is below 50 and above 35 while the previous 5 RSI's are below 35.
* Bearish signal: The current 8-period RSI is above 50 and below 65 while the previous 5 RSI's are above 65.

DNS Relax Buy/SellDNS Relax Buy/Sell Indicator
It is a very simple indicator to use for long-term investors.
It uses ema 3 in Buy and Sell alerts. If ema 3 crosses the baseline line (ema200 Daily) up, it means Buy, and if it breaks down, it means Sell.
There is also a 'take profit line' to determine and see the profit rate.
It can be changed from the settings.
Additionally, the blue line on the indicator (appears as full blue) is the closing price line of the bar where the buy signal is located. It can be turned off from the style settings.
You can also turn buy and sell signals on and off from the settings.
My advice to you is to use this indicator in small time periods. for example, in 1-minute, 3-minutes or 5-minutes time periods.
It can be used in all financial instruments.
Wishing you to always win.

Smart MAThe Smart MA indicator is a tool designed for traders seeking insights into market trends, with its foundation rooted in moving averages. It offers two distinctive color options, with "Crossing" as the default choice and "Direction" as an alternative. Let's delve deeper into these options:
1. "Crossing" Color Option (Default):
Key Features:
Utilizes the interaction between fast and slow moving averages.
The color of the base moving average (MA) line dynamically changes based on crossovers between these moving averages.
Offers real-time visual signals for potential shifts in market sentiment.
Interpretation:
With the "Crossing" color option as the default setting, the base MA line's color responds to the interaction of the fast and slow moving averages.
A crossover where the fast MA crosses above the slow MA may prompt the base MA line to change to a bullish color (e.g., teal), indicating a potential bullish trend.
Conversely, if the fast MA crosses below the slow MA, the base MA line's color may alter to represent a bearish sentiment (e.g., red). This color shift provides a visual marker for a potential bearish trend, potentially guiding traders towards shorting opportunities.
2. "Direction" Color Option:
Key Features:
Focuses on the directional trend of the base moving average (MA).
The color of the base MA line signifies the direction in which the base MA is moving.
Aids in quickly identifying the prevailing market trend.
Interpretation:
Uptrend - Bullish Direction: When the base MA slopes upward, indicating an average price increase over the chosen base MA length, the base MA line's color may shift to a bullish hue (e.g., teal). This visual cue signals a potential uptrend, suggesting favorable long positions.
Downtrend - Bearish Direction: If the base MA slopes downward, signifying an average price decrease over the selected base MA length, the base MA line could change to a bearish shade (e.g., red). This color shift acts as an indicator of a potential downtrend, implying possible opportunities for shorting.
Customization:
Both color options allow traders to adjust the indicator's parameters, including base MA length, MA type, fast MA length, and slow MA length, to align with their trading strategies and preferred timeframes.
In summary, the Smart MA indicator, based on moving averages, provides traders with two color options: the default "Crossing" and "Direction" as an alternative. The "Crossing" option leverages fast and slow moving averages to offer real-time visual cues for dynamic market shifts. The "Direction" option simplifies trend analysis by focusing on the directional trend of the base MA. The choice between these options depends on your trading style and the depth of analysis you require. With the Smart MA indicator, you're equipped to make informed trading decisions in today's financial markets.

Machine Learning: VWAP [YinYangAlgorithms]Machine Learning: VWAP aims to use Machine Learning to Identify the best location to Anchor the VWAP at. Rather than using a traditional fixed length or simply adjusting based on a Date / Time; by applying Machine Learning we may hope to identify crucial areas which make sense to reset the VWAP and start anew. VWAP’s may act similar to a Bollinger Band in the sense that they help to identify both Overbought and Oversold Price locations based on previous movements and help to identify how far the price may move within the current Trend. However, unlike Bollinger Bands, VWAPs have the ability to parabolically get quite spaced out and also reset. For this reason, the price may never actually go from the Lower to the Upper and vice versa (when very spaced out; when the Upper and Lower zones are narrow, it may bounce between the two). The reason for this is due to how the anchor location is calculated and in this specific Indicator, how it changes anchors based on price movement calculated within Machine Learning.
This Indicator changes the anchor if the Low < Lowest Low of a length of X and likewise if the High > Highest High of a length of X. This logic is applied within a Machine Learning standpoint that likewise amplifies this Lookback Length by adding a Machine Learning Length to it and increasing the lookback length even further.
Due to how the anchor for this VWAP changes, you may notice that the Basis Line (Orange) may act as a Trend Identifier. When the Price is above the basis line, it may represent a bullish trend; and likewise it may represent a bearish trend when below it. You may also notice what may happen is when the trend occurs, it may push all the way to the Upper or Lower levels of this VWAP. It may then proceed to move horizontally until the VWAP expands more and it may gain more movement; or it may correct back to the Basis Line. If it corrects back to the basis line, what may happen is it either uses the Basis Line as a Support and continues in its current direction, or it will change the VWAP anchor and start anew.
Tutorial:
If we zoom in on the most recent VWAP we can see how it expands. Expansion may be caused by time but generally it may be caused by price movement and volume. Exponential Price movement causes the VWAP to expand, even if there are corrections to it. However, please note Volume adds a large weighted factor to the calculation; hence Volume Weighted Average Price (VWAP).
If you refer to the white circle in the example above; you’ll be able to see that the VWAP expanded even while the price was correcting to the Basis line. This happens due to exponential movement which holds high volume. If you look at the volume below the white circle, you’ll notice it was very large; however even though there was exponential price movement after the white circle, since the volume was low, the VWAP didn’t expand much more than it already had.
There may be times where both Volume and Price movement isn’t significant enough to cause much of an expansion. During this time it may be considered to be in a state of consolidation. While looking at this example, you may also notice the color switch from red to green to red. The color of the VWAP is related to the movement of the Basis line (Orange middle line). When the current basis is > the basis of the previous bar the color of the VWAP is green, and when the current basis is < the basis of the previous bar, the color of the VWAP is red. The color may help you gauge the current directional movement the price is facing within the VWAP.
You may have noticed there are signals within this Indicator. These signals are composed of Green and Red Triangles which represent potential Bullish and Bearish momentum changes. The Momentum changes happen when the Signal Type:
The High/Low or Close (You pick in settings)
Crosses one of the locations within the VWAP.
Bullish Momentum change signals occur when :
Signal Type crosses OVER the Basis
Signal Type crosses OVER the lower level
Bearish Momentum change signals occur when:
Signal Type crosses UNDER the Basis
Signal Type Crosses UNDER the upper level
These signals may represent locations where momentum may occur in the direction of these signals. For these reasons there are also alerts available to be set up for them.
If you refer to the two circles within the example above, you may see that when the close goes above the basis line, how it mat represents bullish momentum. Likewise if it corrects back to the basis and the basis acts as a support, it may continue its bullish momentum back to the upper levels again. However, if you refer to the red circle, you’ll see if the basis fails to act as a support, it may then start to correct all the way to the lower levels, or depending on how expanded the VWAP is, it may just reset its anchor due to such drastic movement.
You also have the ability to disable Machine Learning by setting ‘Machine Learning Type’ to ‘None’. If this is done, it will go off whether you have it set to:
Bullish
Bearish
Neutral
For the type of VWAP you want to see. In this example above we have it set to ‘Bullish’. Non Machine Learning VWAP are still calculated using the same logic of if low < lowest low over length of X and if high > highest high over length of X.
Non Machine Learning VWAP’s change much quicker but may also allow the price to correct from one side to the other without changing VWAP Anchor. They may be useful for breaking up a trend into smaller pieces after momentum may have changed.
Above is an example of how the Non Machine Learning VWAP looks like when in Bearish. As you can see based on if it is Bullish or Bearish is how it favors the trend to be and may likewise dictate when it changes the Anchor.
When set to neutral however, the Anchor may change quite quickly. This results in a still useful VWAP to help dictate possible zones that the price may move within, but they’re also much tighter zones that may not expand the same way.
We will conclude this Tutorial here, hopefully this gives you some insight as to why and how Machine Learning VWAPs may be useful; as well as how to use them.
Settings:
VWAP:
VWAP Type: Type of VWAP. You can favor specific direction changes or let it be Neutral where there is even weight to both. Please note, these do not apply to the Machine Learning VWAP.
Source: VWAP Source. By default VWAP usually uses HLC3; however OHLC4 may help by providing more data.
Lookback Length: The Length of this VWAP when it comes to seeing if the current High > Highest of this length; or if the current Low is < Lowest of this length.
Standard VWAP Multiplier: This multiplier is applied only to the Standard VWMA. This is when 'Machine Learning Type' is set to 'None'.
Machine Learning:
Use Rational Quadratics: Rationalizing our source may be beneficial for usage within ML calculations.
Signal Type: Bullish and Bearish Signals are when the price crosses over/under the basis, as well as the Upper and Lower levels. These may act as indicators to where price movement may occur.
Machine Learning Type: Are we using a Simple ML Average, KNN Mean Average, KNN Exponential Average or None?
KNN Distance Type: We need to check if distance is within the KNN Min/Max distance, which distance checks are we using.
Machine Learning Length: How far back is our Machine Learning going to keep data for.
k-Nearest Neighbour (KNN) Length: How many k-Nearest Neighbours will we account for?
Fast ML Data Length: What is our Fast ML Length? This is used with our Slow Length to create our KNN Distance.
Slow ML Data Length: What is our Slow ML Length? This is used with our Fast Length to create our KNN Distance.
If you have any questions, comments, ideas or concerns please don't hesitate to contact us.
HAPPY TRADING!

Fisher+ [OSC]The Fisher Transform Indicator is classified as an oscillator, meaning that its value swings above and below a central point. This characteristic allows traders to identify overbought and oversold conditions, providing potential clues about market reversals. As mentioned previously, it is an oscillator so the strength of the move is displayed by how long the fisher line stays above/below zero. Indicator can be used to aid in confluence near supply/demand zones.
White Line = Fisher
Red/Blue Line = Moving Average
--Changes color whether fisher line is above/below the MA
Red/Blue Shaded Line = Moving Average
--Changes color based on a smoothing factor
Red/Blue Shaded Fill = Asset in Overbought/Oversold Conditions
Red/Blue Circles = Asset in Extreme Overbought/Oversold Conditions
Red/Blue Triangles = MACD Signals Below/Above "0"
Divergence Labels = Asset Signaling Divergence
The moving average line will turn red/blue as long as the fisher line is below/above the moving average. The shaded MA line will switch colors based on if it is moving in an up/down trend. The MA can also be used as a signal and treated similar to an oscillator. Market trending conditions will either keep the MA below/above the dashed zero line.
MACD code credited to LazyBear's MACD Leader indicator. It is used to filter out/confirm any signals such as divergences. As long as the MACD Leader line is above both the MACD line and signal lines then it'll signal with with a triangle. MACD divergences will be added at a later time.
