Binque's Stop LossFixed Script only showing Daily Stop Loss. Now will show stop loss based on the resolution of the chart you are on, i.e. 1 min, 5 min, 15 min, 1 h, 4 h, 1 d, 1 w, 1 month, etc...
Moving


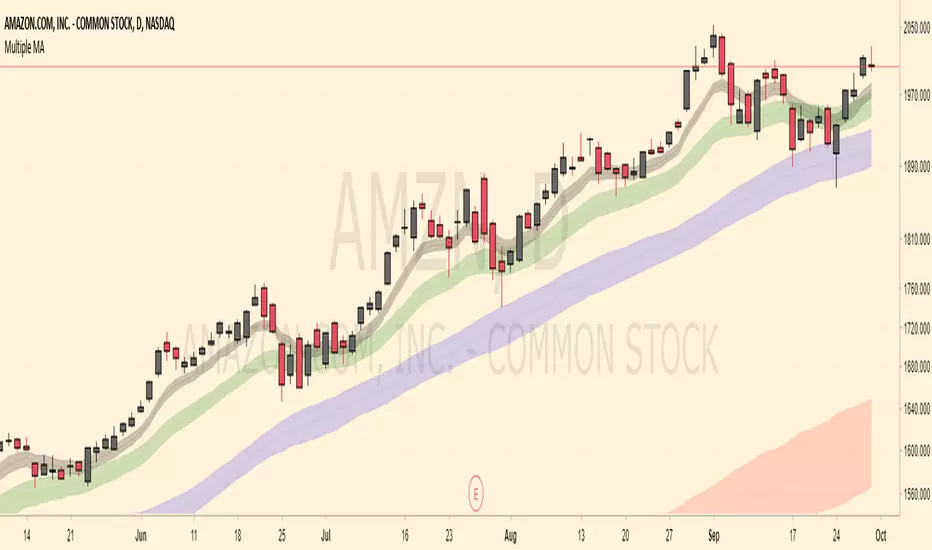
Multiple MA (techsound088)Common moving addresses often act as support and resistance levels. This script will incorporate four (2 exponential and 2 simple ) moving averages. The default are lengths of 8, 20, 50, and 200. These are adjustable. Many of us are aware that these areas often tend to be supply / demands zones. We are also aware that movement around these areas can fluctuate greatly so I've included ATR-based bands around the moving averages hoping to visualize these moving averages in a less rigid and more realistic way. Feel free to modify this script as you please. Constructive feedback is always appreciated.
Edge of MomentumThe script was designed for the purpose of catching the rocket portion of a move (the edge of momentum).
Long
--When RSI closes over 60, take long order 1 tick above that bar. The closed bar above RSI 60 will be colored "green" or whatever color the user chooses. (RSI > 60)
--On a long position, exit will be a closed bar below the ema (low, 10) . The closed bar below the ema will be colored "yellow." (Price < ema)
--Note: On a long position there is no need to exit when a closed bar is colored "purple." RSI is just below 60 but above 40. Pullback or chop
Short
--When RSI closes below 40, take a short order 1 tick below that bar. The closed bar below RSI 40 will be colored "red." RSI<40)
--On a short position, exit will be a closed bar above the ema (low, 10). The closed bar above the ema will be colored "purple." (Price > ema)
--Note: On a short position there is no need to exit when a closed bar is colored "yellow."
Note: You may see a series of purple and yellow bars, that is simply chop. I define chop as RSI moving between 60 and 40.
Trade should only be taken above green colored candle(long) and below red colored candle (short). No position should be taken off yellow or purple candle (chop)
Again this is designed to catch the momentum part of a move, and to help reduce some entries during chop. It is a simple systems that beginning traders can use and profit from.
Note: I don't no shit about coding scripts I just learn from reading others.
Enjoy. If you decide to use please drop me a line...suggestions/comments, etc.
Best of luck in all you do.

Ehlers FilterThis is the Adaptive Ehlers Filter.
I had to unroll the for loops and array because TV is missing crucial data structures and data conversions (Arrays and series to integer conversion for values).
I'm in the process of releasing some scripts. This is a very old script I had. This contains volatility ranges and can be used as trading signals. You can also see how the EF moves up or down, the direction, when price is sideways, and use price breaks up and down as signals from the line.
Have fun, because I didn't making this script hahaha
NOTE : There is an issue with the script where at certain time frames it positions itself below or above. I think its due to calculations. If anyone knows the fix before I get the chance to take a look at it, please let me know.
books.google.com

5 Moving Average Exponential 7-15-30-50-2005 Moving Average Exponential. Crypto EMA. 7 is a fast support or resistance, 15 confirmation support or resistance. 30 Important support and resistance. 50 institutional support or resistance. 200 general trend, support and resistance.

Moving average cloud strategyHi folks!
Here a script uses the moving average cloud. A sma (50, aqua) and a sma (200, olive) are plotted on the cart. When both sma go up the cloud is green. When both sma go down the cloud is red. When sma (200, olive) goes down and sma (50, aqua) goes up the cloud is orange. When sma (200, olive) goes up and sma (50, aqua) goes down the cloud is lime.
There three entry points in this strategy.
Long
Aggressive: When the cloud turns orange and price closes above the sma (200).
Neutral: When the both sma make the golden cross.
Cautious: When the cloud is green and price closes sma (200) after searching for support. So not when there's a great distance between them.
In case you missed the entry point you can jump in when price CLOSES above sma (50). So after it searched for support on that line. The cloud has to be green at that moment.
Short
Aggressive: When the cloud turns lime and price CLOSES below the sma (200).
Neutral: When the both sma make the death cross.
Cautious: When the cloud is green and price is above the sma (200).
In case you missed the entry point you can jump in when price CLOSES above sma (50). So after it searched for support on that line.
There are also two exit points in this strategy.
Cautious: When price closes on the other side of the sma (50).
Neutral: When the cloud changes color.
Aggressive: When price closes on the other side of the sma (200). There's always the opportunity that the price searches for support at the sma (200) line and goes from that moment in the direction you want.
Don't wait for the cross of the both sma. Very usually you give a huge part of your profit away at that point.
Remember: Above the cloud is bullish area, never go short there. Below the cloud is bearish area, never go long there.
Remember 2: When the clouds changes rapidly from color we're not in a trend. The sma (200) will be almost flat at those situations. It's a sign not to go into a trade since the market doesn't know in which direction it will go.

Leeloo Triple Simple Moving AverageAllows you to have three simple moving averages in one indicator.


6 SMA's (fit to BTC) 9,20,30,50,128,200 (exponential optional)I've been using these for a while trading Bitcoin and I've found them to be the most useful to me. I replaced the 7 you may have seen in the first set with the 9 as I'm seeing it tested across many time frames quite frequently. The least used of the six is the 30 period, but it does have some influence I've found on the large time frames, mainly the weekly.

ALL Philakone's EMA's (8,13,21,55,100, 200)These are Philakone's EMA's. I added the 100 day in there as I didn't see that anyone had done that.
The 100 might be the same color as the 200 looking at the code, I changed it on my chart, but just make sure you check the colors.

crashm111 3-200 Moving Average RibbonAll the moving averages bewteen 3 and 200 in increments of 5.
with the ability to change colours
and change between simple and exponential.
It provides an easy and fast way to determine the trend direction and possible reversals.

Multiple Timeframe Moving Average SystemModified code from ChrisMoody, RicardoSantos & Ricardo M Arjona.
Allows for multiple moving average types across custom time-frames.
Simple Moving Averages (7, 30, 50, 100, 200)7, 30, 50, 100, 200 simple moving averages, bundled in one indicator (for users who are using the free TradingView service and can only load limited number of indicators at any given time).
You can turn each moving average on or off at will and change the colors.

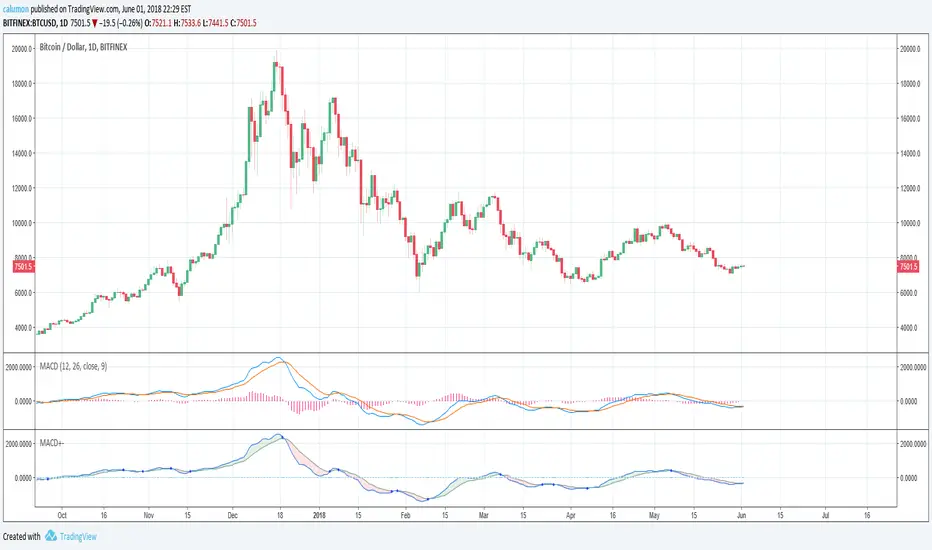
MACD with highlighted positive and negative trendThe values used by this indicator are equal to MACD 12 26 9 (and Signal). Only changes are made to looks:
If MACD closes higher than Signal, then we are seeing green. Else, we are seeing red.
Another point is that we get a blue circle when there is a trend change from bullish to bearish or vice versa. Please note that there needs to be an offset for this. We will only see the circle, when there already WAS (instead of is) a trend change.
SMA/EMA 12|26|50SMA/EMA 12|26|50
Exactly as title says
SMA is bold
EMA is light
Orange 12
Green 26
Blue 50


EMA Min0nat0rEMa based on the Fibonacci sequence of numbers.
Perfect to trade on leverage.
Min0taur0

Dual Moving AverageGiven the limitation on indicators, I figured it would be nice to combine a couple into a single indicator. I'll likely make another one for EMA or make one that lets you use whichever type of moving averages you want.
Philakone 55/100 EMA incl. color & sizeInspired on Philakone's EMA settings in his colors and line width. Also added 100 EMA.
Multiple Moving AveragesThis is really simple. But useful for me as I don't have a paid account. No-pro users can only use 3 indicators at once and because I rely heavily on simple moving averages it can be a real pain.
This one indicator features:
20 MA
50 MA
100 MA
200 MA
which I find are the most useful overall. The 20 and 50 over all time frame but in particular < 1 day, the 100 and 200 at > 4 hr time frames. In general I don't use the 100 MA that much. The daily 200 MA is a critical support for many assets like stocks and cryptos. I'm by no means a pro and if you are learning I recommend becoming familiar with moving averages right at the beginning.
If you want to deactivate some of the lines, you can do it via the indicator's settings icon.
