[blackcat] L1 Stick-Line Merged MACDLevel: 1
Background
The MACD is a superior derivative of moving average crossovers and was developed by Gerald Appel in 1979 as a market timing tool. MACD uses two exponential moving averages with different bar periods, which are then subtracted to form what Mr. Appel calls the Fast Line. A 9-period moving average of the fast line creates the slow line.
Function
L1 Stick-Line Merged MACD merges dif and dea lines with macd sticks by the same color candles. The generation of candles help to confirm the trend contiuation. E.g. yellow candles indicate up trend continuation while blue candles indicate down trend continuation
Key Signal
dif --> classic MACD diff fast line in yellow
dea --> classic MACD dea slow line in fuchsia
macd --> classic difference histogram
upslmerge --> up trend continuation yellow candle merge condition
dnslmerge --> down trend continuation blue candle merge condition
Pros and Cons
Pros:
1. merged line and stick with candles help confirm trend reversal
2. long entry signal is indicated.
Cons:
1. need sophisticated knowledge of MACD to use this well
2. this still requires a lot of MACD experience to obtain reliable trading signals
Remarks
Merge lines and sticks of MACD into candles. Better view of the trend
Readme
In real life, I am a prolific inventor. I have successfully applied for more than 60 international and regional patents in the past 12 years. But in the past two years or so, I have tried to transfer my creativity to the development of trading strategies. Tradingview is the ideal platform for me. I am selecting and contributing some of the hundreds of scripts to publish in Tradingview community. Welcome everyone to interact with me to discuss these interesting pine scripts.
The scripts posted are categorized into 5 levels according to my efforts or manhours put into these works.
Level 1 : interesting script snippets or distinctive improvement from classic indicators or strategy. Level 1 scripts can usually appear in more complex indicators as a function module or element.
Level 2 : composite indicator/strategy. By selecting or combining several independent or dependent functions or sub indicators in proper way, the composite script exhibits a resonance phenomenon which can filter out noise or fake trading signal to enhance trading confidence level.
Level 3 : comprehensive indicator/strategy. They are simple trading systems based on my strategies. They are commonly containing several or all of entry signal, close signal, stop loss, take profit, re-entry, risk management, and position sizing techniques. Even some interesting fundamental and mass psychological aspects are incorporated.
Level 4 : script snippets or functions that do not disclose source code. Interesting element that can reveal market laws and work as raw material for indicators and strategies. If you find Level 1~2 scripts are helpful, Level 4 is a private version that took me far more efforts to develop.
Level 5 : indicator/strategy that do not disclose source code. private version of Level 3 script with my accumulated script processing skills or a large number of custom functions. I had a private function library built in past two years. Level 5 scripts use many of them to achieve private trading strategy.
Macdhistogram

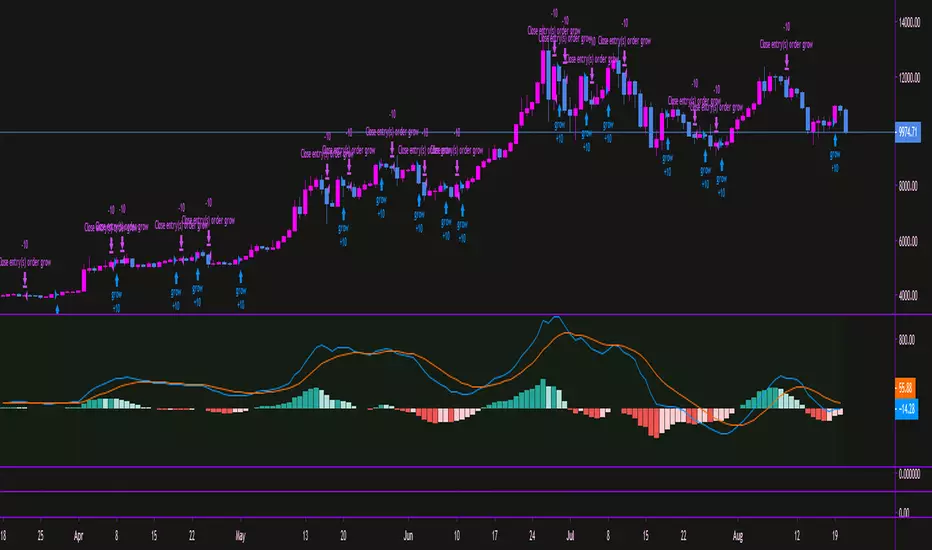
MACD_trendtrader v2 (picte)This is an upgraded version of my MACD_trendtrader indicator.
UPGRADES:
- Histogram slope changes colors according to the direction of the slope.
- Panel that displays volatility of the asset. The volatility is measured from 0 to 100. Zero being the lowest and 100 the highest volatility. I also included different text colors for a certain volatility value (white= very low volatility, blue = low volatility, purple= high volatility, green= very high volatility)
It works well on all time-frames but i found it particularly useful on the lower time-frames for identifying pullbacks in a trending market.
It has been tested in the Forex and Traditional market.

[SignalFI] MACD PrimeWelcome! As part of our continual process to build and enhance trusted existing indicators, we're proud to release MACD Prime to the PRIME series for those traders that rely on the popular divergence mechanics traditional MACD provides.
MACD Prime provides a default MACD structure using the popular 12,26 EMAs and a 9 lockback signal line as the core of the indicator's functionality. In this way, you will get a consistent view for what you're use to, but of course we've added additional functionality that can be used to increase the value this view provides when trading.
ADDITIONAL Functions:
1) MACD Fast and Slow EMA sources are selectable, thus allowing the user to select OHLC variants as the source input for the 12/26 trendlines.
2) Background Coloring is based on a secondary "Signal" color which be default has been set to 6. This length is configurable, and providing a leading edge to the typical "MACD Cross". Said simply, the background color will change with the trend BEFORE a default MACD cross occurs. This may provide early warning of a MACD cross, and allow for additional entry/exit signals to manifest depending on other confluence with price and trend information.
3) MACD Trend Lines. In accordance with the PRIME series MACD Prime comes bundled with Trend Line support and resistance pivots that provide additional context for how the MACD may act based on a previous and projected trend line information. By default projections are turned off, but can be enabled from within the menu options. These trendlines can be used to spot divergences as well, and can be tuned within the option to increase resolution or decrease noise provided by trend lines.
All other standard functions persist, including the typical MACD line, MACD Signal Line, and MACD Histogram.
SignalFI was created to help traders and investors to effectively analyze the market based on the Golden Mean Ratio (Fibonacci numbers), plan a trade and ultimately execute it. To help inform and educate market decisions we developed a set of Trading Indicators which are available on TradingView.
SignalFI indicators are just that, indicators. Our indicators are generally configured to use completely historical data (negating repaint), and we advise all alerts created with SignalFI indicators to be fired upon "close" of the current candle. Our indicators can provide valuable context and visualization support when performing market analysis and executing buy and sell decisions. However. we are not financial experts, and all information presented on this site or our other media outlets are for educational purposes only.

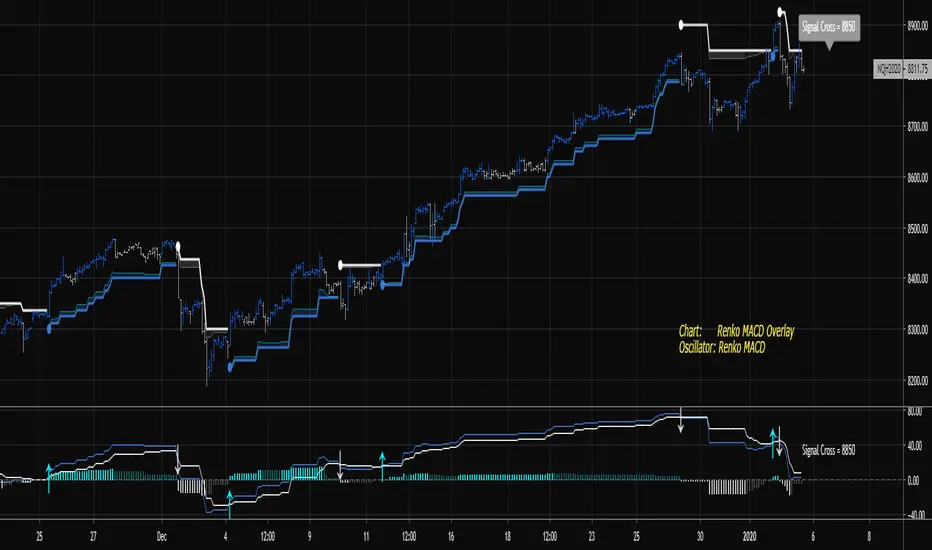
Renko MACD TrendThe goal of this indicator is to plot the MACD, Signal, and Histogram values "as if" the chart is a true price action based Renko chart. It can be used on a time series chart or Renko series chart. The MACD is derived from the raw price action of a time-based chart, where the historic and live price is clustered into Renko bricks. The Renko brick production algorithm is entirely backed by Renko Overlay Ribbon and thoroughly tested.
The algorithm takes into account rapid brick production within a single time candle and adjusts accordingly. The output may vary slightly between different chart time frames for the same indicator settings, but this is due to the lack of price fluctuation visibility that can occur in higher chart time frames. If the brick tick size is low, an appropriate chart interval should be selected that maximizes the amount of price volatility visible to the indicator. A bad setting would be something like a 1 tick EURUSD Renko setting on an H4 or Day chart, there simply is no way to derive the exact and ordered price fluctuations in a single candle, 1 pip at a time. A more appropriate chart time frame would be 1-5 minutes for this selected Renko brick size.
The difference between this indicator and the companion Renko MACD indicator can be understood in the following video. The indicator plots the current MACD - Signal cross and MACD - Zero cross thresholds on the chart so that you know exactly where the most important crossing values are at all times. This can be used as a dynamic stop or a dynamic entry location for trades.
If you are interested in the RSI-RENKO DIVINE Strategy please have a look here:
Contact me in Trading View or telegram for more information and access instructions.
Telegram: t.me
Daily Edge: www.daily-edge.com
Renko MACDThe goal of this indicator is to plot the MACD, Signal, and Histogram values "as if" the chart is a true price action based Renko chart. It can be used on a time series chart or Renko series chart. The MACD is derived from the raw price action of a time-based chart, where the historic and live price is clustered into Renko bricks. The Renko brick production algorithm is entirely backed by Renko Overlay Ribbon and thoroughly tested.
The algorithm takes into account rapid brick production within a single time candle and adjusts accordingly. The output may vary slightly between different chart time frames for the same indicator settings, but this is due to the lack of price fluctuation visibility that can occur in higher chart time frames. If the brick tick size is low, an appropriate chart interval should be selected that maximizes the amount of price volatility visible to the indicator. A bad setting would be something like a 1 tick EURUSD Renko setting on an H4 or Day chart, there simply is no way to derive the exact and ordered price fluctuations in a single candle, 1 pip at a time. A more appropriate chart time frame would be 1-5 minutes for this selected Renko brick size.
Please find the following video introduction helpful for this indicator and the Renko MACD Trend indicator:
If you are interested in the RSI-RENKO DIVINE Strategy please have a look here:
Contact me in Trading View or telegram for more information and access instructions.
Telegram: t.me
Daily Edge: www.daily-edge.com

MACD Builder ProOur newest indicator, the MACD Builder Pro, gives traders the ability to build a MACD based on 7 different kinds of moving averages. The options include:
1.Standard MACD (EMA)
2.Hull Moving Average MACD
3.Volume Weighted MACD (VWMA)
4.Arnaud Legoux MACD (ALMA)
5.Double EMA MACD
6.MACD based on median
7. Simple Moving Average (SMA) MACD
Additionally, we've included countless plotting options for users to choose from. Users can choose to plot either the MACD or MACD Histogram in addition to the signal line. There is also an option to have the entry and exit signals displayed as green(entry) and red(exit) triangles for the entry and exit signals or red and green vertical highlight lines.
We've also provided the ability to fully customize the entry and exit conditions for the indicators trading logic. As mentioned, we've included over 7 different types of MACD indicators. But, we also included the ability to customize the lengths of the fast and slow Moving Averages used in the MACD calculation, as well as the length of the signal line. For entry conditions, the different options are:
1. MACD Histogram Above/Below Zero- Entry signals are generated when MACD Histogram crosses above the zero line into positive territory and exit signals come when the MACD Histogram crosses under the zero line into negative territory.
2. MACD Histogram Rising/Falling - Entry signals are generated when MACD Histogram first begins rising and exits when MACD Histogram first starts decreasing.
3. MACD Above/Below Zero - Entry signals are generated when MACD crosses above the zero line into positive territory and exit signals come when the MACD crosses under the zero line into negative territory.
4. MACD Rising/Falling - Entry signals are generated when MACD first begins rising and exits when MACD first starts decreasing.
As always, this script comes with pre-set alerts and we will be offering 3 day trials to anyone interested!
To check out more of our indicators head on over to our website : profitprogrammers.com

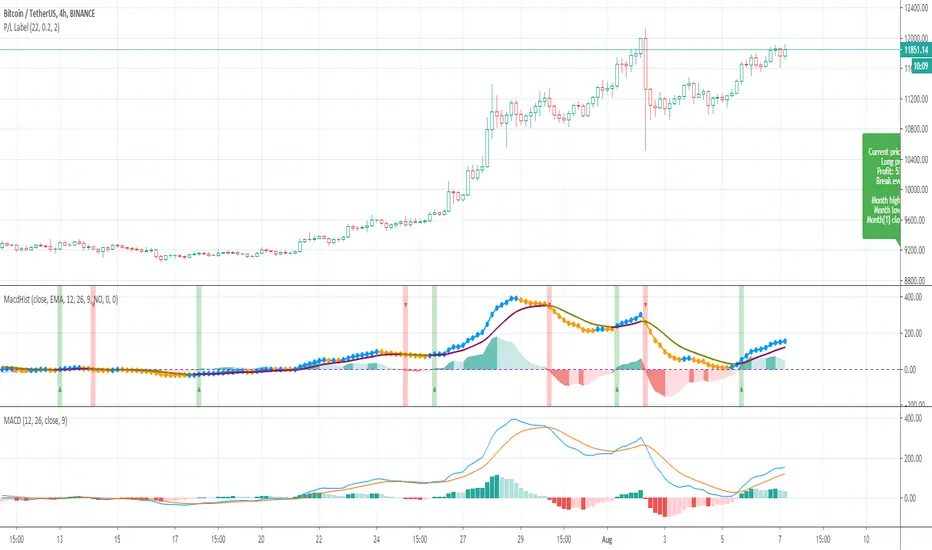
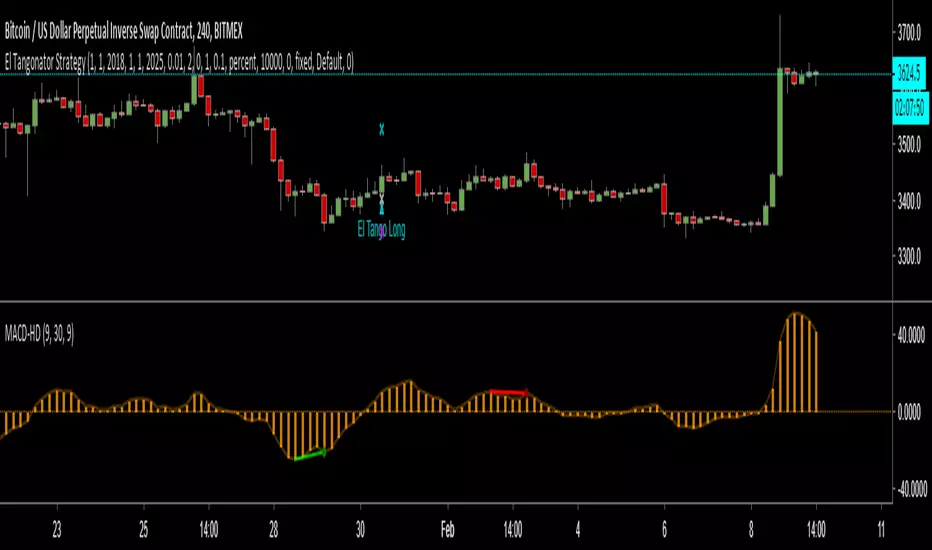
MACD Histogram BacktestTesting the trades signaled by the daily MACD histogram to see how they would have performed, compared to regular MACD Crosses. I'm going to take the 'List of trades' and analyse it seperately as some of the profit percentages seem a little off in the tradingview calculation, though it could just be my bad math!
Hi CryptoLove :) Hope this helps your investigation RE:
www.youtube.com
Presets Selector - FRIDAY NIGHT CHALLENGEBonjour/Salut ça va?
Ok enough for the french :) You guys should really stop challenging me on things on Pinescript and asking me if it's possible or not because... that's the second time in a row I'm about to reveal a nice trick
Please take this example as a proof of concept/feasability. This follower said "I'm tired of manually filling the fields of my indicator, my fingers are dead.... every time I change something in the code, I lose the configuration by default"
Say no more sir.... challenge accep..... wait for it ....ted (that's his real name actually) !!!!
Mesdames et messieurs (damn... my french accent is back), let's unveil the curtain on... the PRESETS SELECTOR (please try to imagine someone super famous shouting it and everyone standing and clapping their hands...)
What I mean by presets is THIS
I inspired myself from this script MacD-Custom-Indicator-Multiple-Time-Frame-All-Available-Options/ (this guy has more likes in a single indicator than me and my friends and my family in all social media channels combined over the past 15 years or so....#humbled)
Anywoo.... the concept is that you can define presets in your script .... which is not possible by TradingView at the moment. If you always have the same set of parameters for a given indicator, please think about your fingers too and give them some rest by implementing a preset in the code directly
I also added a few features :
- You can choose the resolution of the indicator (from 1 minute to 1 month)
- You can choose also between displaying a MACD or a MACD ZERO LAG
Imagine now you have a super complex backtest with hundreds of fields... and unfortunately ... you'll have to fill some of them for each of your tests. Might change in the future if TradingView will add the feature though :)
PS
I'm writing the Algorithm Builder documentation this weekend and the website should open in 3 weeks maximum. I think it's one of the most beautiful trading websites I've seen ever (I didn't do it, my friend did but who cares... it's mine :p)
PS2
I didn't post yesterday the script of the day so I'll post it tomorrow. What is due is due and I won't fail my challenge even ONCE !!!! ("But you just did yesterday bro...")
Have a great weekend
Dave
____________________________________________________________
Be sure to hit the thumbs up
- If you want to suggest some indicators that I can develop and share with the community, please use my personal TRELLO board
- I'm an officially approved PineEditor/LUA/MT4 approved mentor on codementor. You can request a coaching with me if you want and I'll teach you how to build kick-ass indicators and strategies
Jump on a 1 to 1 coaching with me
- You can also hire for a custom dev of your indicator/strategy/bot/chrome extension/python

MACD HistogramShort MACD histogram to deal with crypto trade.
Added ability to simulate a test price too.
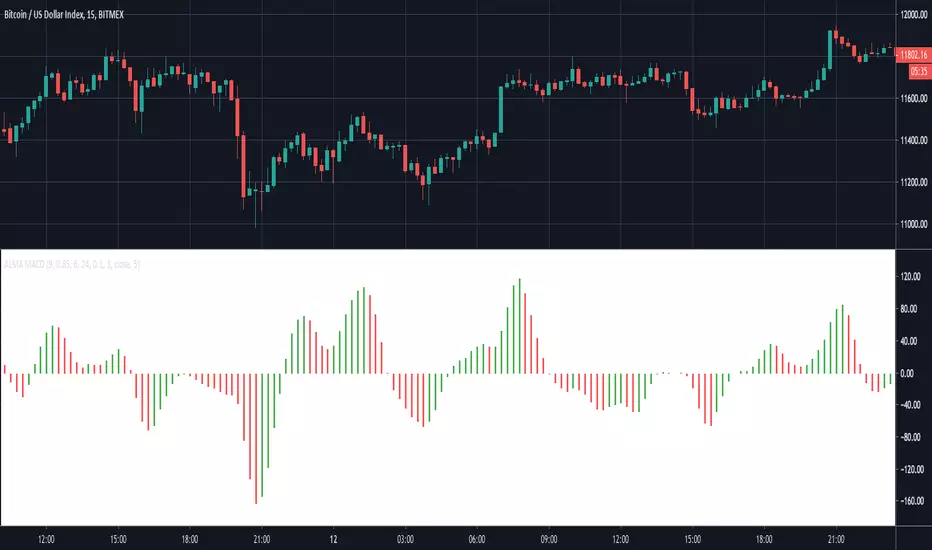
ALMA MACDThis indicator creates a MACD based on Arnaud Legoux Moving Averages (ALMA). I prefer this implementation over the standard MACD based on exponential moving averages as it filters out most of the minor price fluctuations that lead to false signals.
To learn more check out our other posts about the Arnaud Legoux Moving Average:
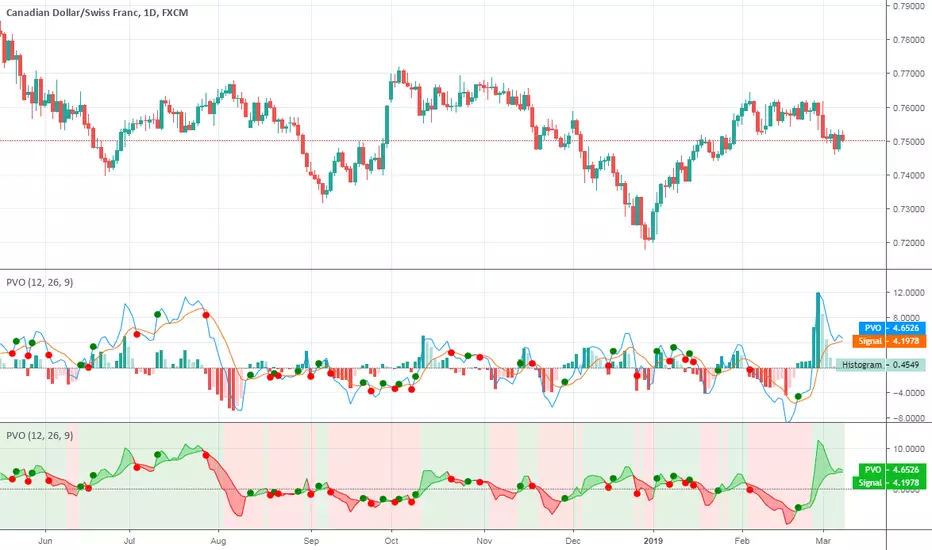
Percentage Volume OscillatorThis indicator is based on Percentage Price Oscillator and volume as a source.
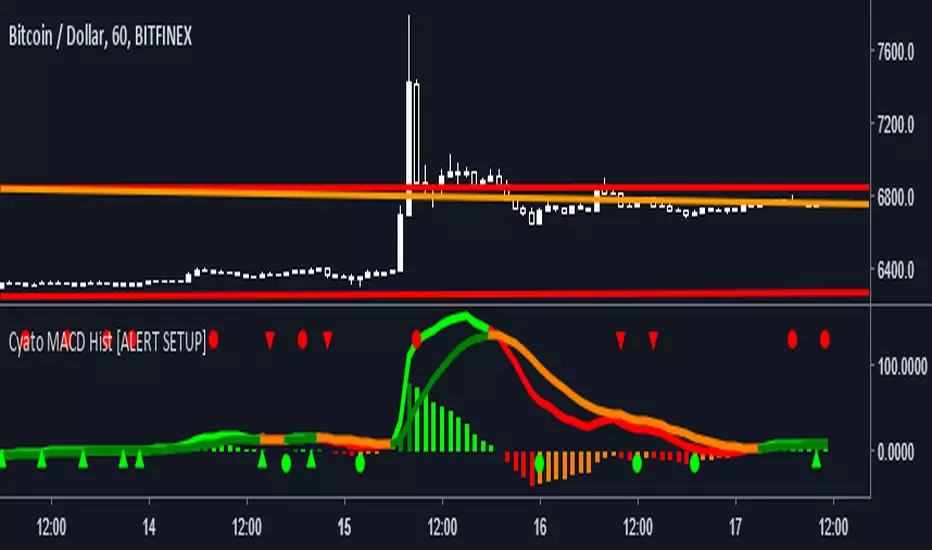
Cyatophilum MACD Hist [ALERT SETUP]Hello, I made a classic MACD Histogram indicator, with custom alerts and parameters though.
Shapes
Green circles : The MACD histogram is reversing, this is a buy (or Long) signal.
Red circles : The MACD histogram is reversing, this is a sell (or Short) signal.
Green Arrow up : The MACD histogram is enduring a bear fakeout. This is a buy signal.
Red Arrow up : The MACD histogram is enduring a bullfakeout. This is a sell signal.
Parameters ( INPUTS )
Classic MACD parameters.
Sensitivity : (1 = really sensitive to reverals and fakeouts - 5 = much less sensitive)
Activate Fakeouts : default is true. Uncheck to deactivate fakeout on chart /!\ will also deactivate fakeout alerts
Alerts (Automated trading alerts : SMS, email, etc.) that you can create :
Buy : a buy signal that will trigger on a bull reversal or a bear fakeout. No more than one buy/sell signal in a row (You will not get multiple buy signals or multiple sell signals in a row)
Sell : a sell signal that will trigger on a bearreversal or a bullfakeout. No more than one buy/sell signal in a row (You will not get multiple buy signals or multiple sell signals in a row)
Buy (Bull Reversal) : a buy signal that will trigger on each bull reversal.
Buy (Bear Fakeout) : a buy signal that will trigger on each bear fakeout.
Sell (Bear Reversal) : a sell signal that will trigger on each bear reversal.
Sell (Bull Fakeout) : a sell signal that will trigger on each bull fakeout.
If you like, leave a comment, thanks! If you find any bug, thanks for telling me!
-----------------------------------------------------------------------------------------------------------------
I am selling access to private scripts and backtests that can be found on my website .
I am also open to commissions : TradingView's PineScript development, reverse engineering.
Thanks.
Moving Average Convergence/Divergence LineMACD Line instead of MACD histogram or area. This gives more opportunities to catch divergences.
I showed regular MACD Histogram on top and then this indicator on bottom and showed with the red and green lines where you could catch multiple bearish and bullish divergences using this indicator vs a regular MACD histogram.
Send me a private message to join my trading group.
Thank you.


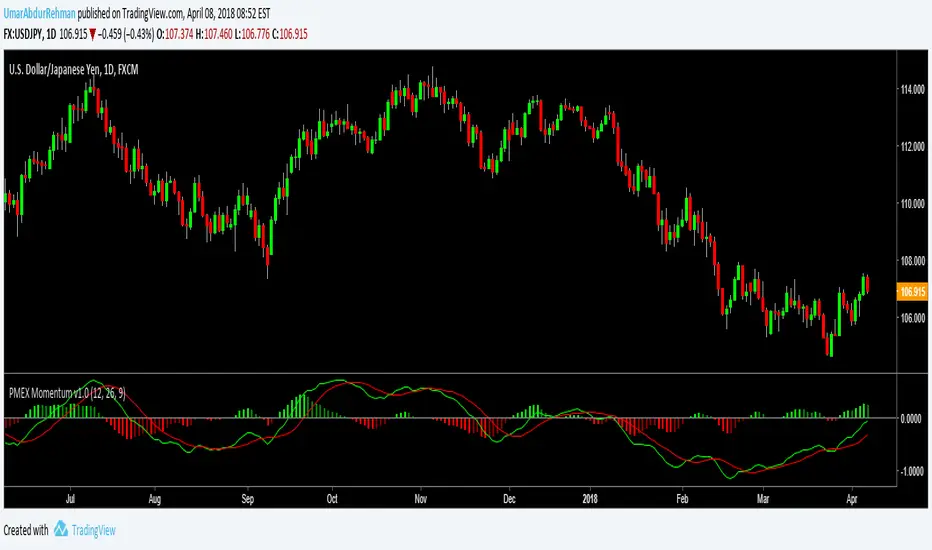
PMEX Momentum v1.0Newer version of Momentum indicator introducing 4 colors so easy to spot momentum bars ticking up or down. User can customize the colors etc and turning the MACD/Signal lines on/off.
This script is open to public so anyone can use it.