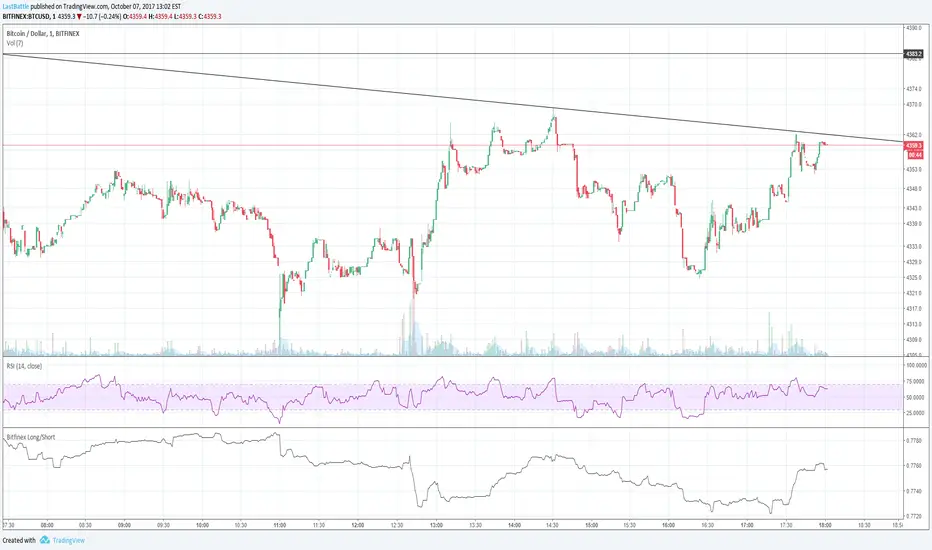
Bitfinex BTC longs vs Short ratioSelf explanatory...
Shows the long / short ratio of trader's positioning in bitfinex exchange.
The higher the ratio, it means there are more longs. The lower the ratio, the more shorts are currently being opened,.
롱
BFXLS - Compare styleDisplays BitFinex longs and shorts on your chart in the same was as if you add them by using TradingView's "compare" function - major advantage is that this works for all pairs that BitFinex supports without having to manually set up your chart each time.

[naoligo] Pivot Points (Daily)Suporte/Resistência do Pivot diário para gráficos intraday
Marcação do S/R tradicional e S/R Fibonacci
Daily Pivot Point Support/Resistances on intraday charts
Both Traditional and Fibonacci methods plotted

LONG TERM INVESTMENT TECHNICAL STRATEGY SCRIPT200 - WEEKLY MOVING AVERAGE
GREEN LINE IS 200 WEEKS MOVING AVERAGE OF CLOSE
BLUE LINE IS 200 WEEKS MOVING AVERAGE OF LOW MULTIPLIED BY 0.90
RED LINE IS 100 WEEKS MOVING AVERAGE OF CLOSE
CONDITION: GREEN LINE SHOULD BE ABOVE RED LINE AND PRICE SHOULD BE ABOVE GREEN LINE
BUY ONCE THE PRICE IS ABOVE GREEN LINE AND FULFILLS THE CONDITION.
TARGET 1 FOR TIME FRAME 1 YEAR= 2 X GREEN LINE VALUE WHEN PRICE CROSSED IT
TARGET 2 FOR TIME FRAME 3 YEARS= 3 X GREEN LINE VALUE WHEN PRICE CROSSED IT
TARGET 3 FOR TIME FRAME 5 YEARS= 5 X GREEN LINE VALUE WHEN PRICE CROSSED IT
TARGET 4 FOR TIME FRAME 10 YEARS= 10 X GREEN LINE VALUE WHEN PRICE CROSSED IT
STOP LOSS IS TRAILING TO BLUE LINE

Revistochmanic StrategyRevistochmanic Wave is a stock tracking trends indicator & strategy for medium & long term investing.
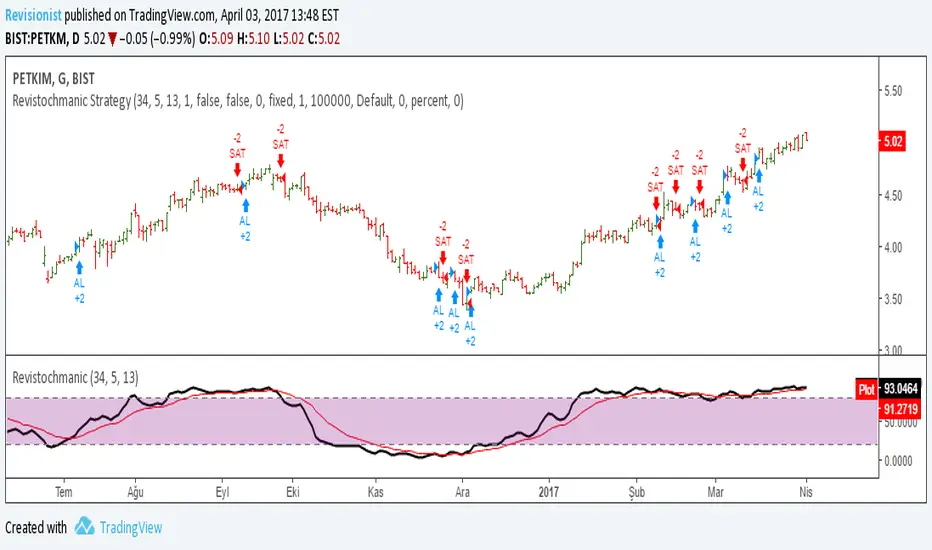
Revistochmanic Wave İndicator Revistochmanic Wave is a stock tracking trends indicator & strategy for medium & long term investing.
Stochastic 34 period
smoothK 5 period (ema/red line)
smoothD 13 period (stochastic/black line)

daily wickedness dha betabeta of an idea to catch tops and exit before drops on BTC using a custom wickedness factor.
strategy is only going long.
The strategy starts with 2014 and ends 2017.
Its main purpose is to survive a bear market like 2014 only trading longpositions without taking too much damage.


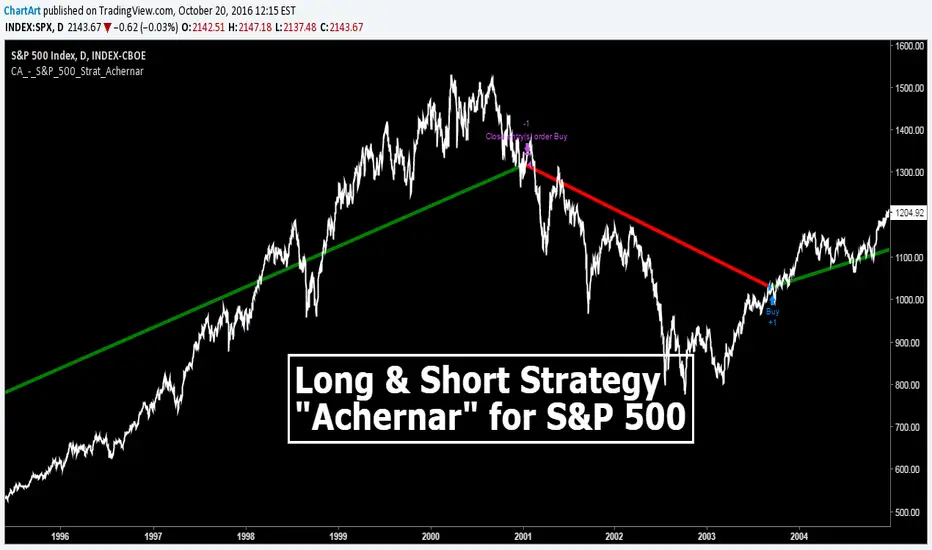
S&P 500 Long Only Investment Strategy, Achernar (by ChartArt)Here is my strategy with the working title "Achernar", which works best with the published default setting on the 'CBOE' 'S&P 500' daily chart. The strategy is intended for investments in long-term time-frames (the current average of the trades is a holding period of over 1000 days). The setting allows to use the 'CBOE' as price source (default) or the Tradingview TVC index, which uses a 'CFD' of the 'S&P 500' as price source. Please beware that there is a typo: This strategy does not go short, it closes the long trades and goes into cash instead, therefore this is a long only strategy.
If you don't want to lose all your money due to some random strategy you found on the Internet, here is a warning:
All trading involves high risk; past performance is not necessarily indicative of future results. Hypothetical or simulated performance results have certain inherent limitations. Unlike an actual performance record, simulated results do not represent actual trading. Also, since the trades have not actually been executed, the results may have under- or over-compensated for the impact, if any, of certain market factors, such as lack of liquidity. Simulated trading programs in general are also subject to the fact that they are designed with the benefit of hindsight. No representation is being made that any account will or is likely to achieve profits or losses similar to those shown.
P.S. The published script does not show the other trade entries on the screenshot above. Here is how the strategy looks like on the chart:
Narrow Range + Inside Day, Long Only Strategy (by ChartArt)This long only strategy determines when there is both a NR7 (narrow range 7, a trading day in which the range is narrower than any of the previous six days), plus a inside day (high of the current day is lower than the high of the previous day and the low of the current day is higher than the low of the previous day) both on the same trading day and enters a long trade when the close is larger than the open and the slope of the simple moving average is upwards, too.
The strategy closes the long trade next time the daily close is larger than the open in any of the next trading days. In addition the NR7ID can be colored (the color is green when the close is larger that day than the open, else the color is red) and the SMA can be drawn with a color based on the direction of the SMA slope. To fine-tune the strategy it is highly recommended to change the period length of the SMA, which determines if the measured SMA slope is upwards or not.
Inspiration:
How to trade NR7 and Inside Day Pattern
paststat.com
Code credit:
NR7 indicator script from Tradingview user Lazybear:
pastebin.com

Long Only Investment Strategy, Alpha (by ChartArt)Here is my strategy with the working title "alpha" which works best with the published default setting on the 'S&P 500' monthly chart. The strategy is intended for investments in long-term time-frames (the current average of the default setting is a holding period of long positions of 40 months).
If you don't want to lose all your money due to some random strategy you found on the Internet, here is a warning:
All trading involves high risk; past performance is not necessarily indicative of future results. Hypothetical or simulated performance results have certain inherent limitations. Unlike an actual performance record, simulated results do not represent actual trading. Also, since the trades have not actually been executed, the results may have under- or over-compensated for the impact, if any, of certain market factors, such as lack of liquidity. Simulated trading programs in general are also subject to the fact that they are designed with the benefit of hindsight. No representation is being made that any account will or is likely to achieve profits or losses similar to those shown.

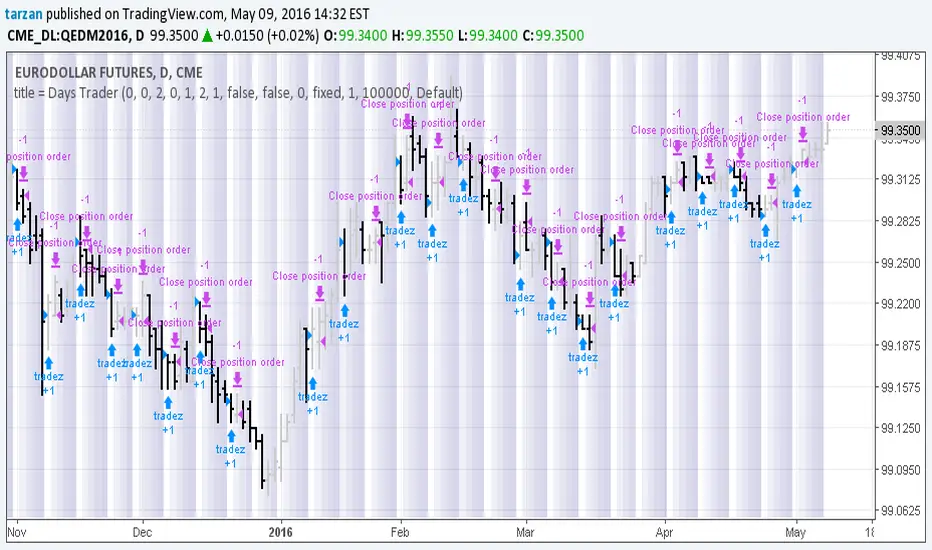
Days Trader 1.0Simple program to look for day of week or day of month patterns in chart data.
All original work by Boffin Hollow Lab
Author: Tarzan
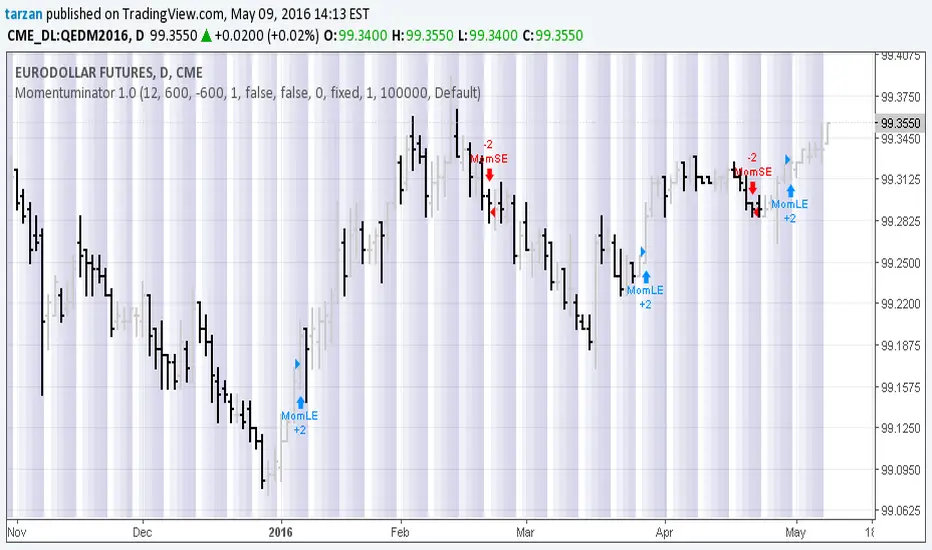
Momentuminator 1.0Here we have a general purpose momentum based long and short flip flop with optional profit target and maximum loss.
Program development: Boffin Hollow Lab
Author: Tarzan at tradingview.com
Release: Version 1.0 May 2016
Please Note: Past Performance is not necessarily indicative of future results
MACDouble + RSI (rec. 15min-2hr intrv) Uses two sets of MACD plus an RSI to either long or short. All three indicators trigger buy/sell as one (ie it's not 'IF MACD1 OR MACD2 OR RSI > 1 = buy", its more like "IF 1 AND 2 AND RSI=buy", all 3 match required for trigger)
The MACD inputs should be tweaked depending on timeframe and what you are trading. If you are doing 1, 3, 5 min or real frequent trading then 21/44/20 and 32/66/29 or other high value MACDs should be considered. If you are doing longer intervals like 2, 3, 4hr then consider 9/19/9 and 21/44/20 for MACDs (experiment! I picked these example #s randomly).
Ideal usage for the MACD sets is to have MACD2 inputs at around 1.5x, 2x, or 3x MACD1's inputs.
Other settings to consider: try having fastlength1=macdlength1 and then (fastlength2 = macdlength2 - 2). Like 10/26/10 and 23/48/20. This seems to increase net profit since it is more likely to trigger before major price moves, but may decrease profitable trade %. Conversely, consider FL1=MCDL1 and FL2 = MCDL2 + (FL2 * 0.5). Example: 10/26/10 and 22/48/30 this can increase profitable trade %, though may cost some net profit.
Feel free to message me with suggestions or questions.

Fisher Transform with Up/Down colours - squattterCredit to HPotter - colour code borrowed from his AO script.

Simple RSI-MA Algo Beats DOW By Huge Margin Over Past 100 Years!This simple RSI-MA long/short algorithm beats the Dow by a FREAKING HUGE margin over the past century (excluding dividends and trading costs).
The algorithm uses a fast SMA of the RSI as a buy/cover signal and a slow SMA of the RSI as a sell/short signal.
Backtest period = 09/17/1916 - 11/02/2015
Dow = 98 --> 17,830 = +18,094% = 5.38% CAGR
Algorithm = net profit + open P/L = +43,349% = 6.31% CAGR
Notice how the algorithm dodged both the 30s' Great Depression and the 2008 Crisis. Pretty cool huh? :)
ALGORITHM'S FORMULA (use weekly chart):
Buy/Cover = MA10(RSI10) cross> 50
Sell/Short = MA50(RSI10) cross< 50
STRATEGY TESTER'S SETTINGS:
- Initial cash = $10,000
- Pyramiding disabled
- Re-investment enabled (order size = 100% of equity )
- Trade re-calculations disabled
DISCLAIMER: None of my ideas and posts are investment advice. Past performance is not an indication of future results. This strategy was constructed with the benefit of hindsight and its future performance cannot be guaranteed.

