Intraday BUY/SELLBUY & SELL Scalp Signals for Crude Oil Future Contracts (Or it can be used with any scrip with good amount of Volume) based on Sma & RSI overbought/oversold alert (!) for possible reversal indication.
Take Buy position only if candle breaks the high of alert candle & for Sell positions, take position if candle breaks low of the alert candle.
Best to perform with 3 min timeframe on Crude Oil Futures
Intraday

Daily Moving Averages on Intraday ChartShows the Daily Simple Moving Averages on the Intraday Chart
This will include the 200 day SMA, 50 day SMA and 20 day SMA automatically on the intraday chart.
Daily SMA time periods can be adjusted in the settings.
Based on the following script:
Naleen's Entry IndicatorHi
This indicator uses a combination of moving averages and RSI to trigger entry and exit signals.
Use alongwith my VWAP Indicator to enter positions

{INDYAN} Dual Supertrend#Always follow MAJOR trend, find MINOR trend as per Major trend and choose entry/exit accordingly .
Suppose major trend is blue so only go long while inside minor trend is green, when it turns RED exit from long but dont short in BLUE i.e. major uptrend and vice versa for downtrend i.e. major should be pink and minor should be red for short and when it turn green under pink just exit the sort.
By default major trend is set to 15 Minutes which is generally good for index, and 1 hour should be for stocks. You can change it through settings.
My recommendation for index is major should be 15 minutes and minor 5 and for stocks major should be 1 hour and minor 15 minutes.
It can be used with index,stocks and commodties.
Hope it will help my trader friends.
Happy Trading...
Love INDYAN

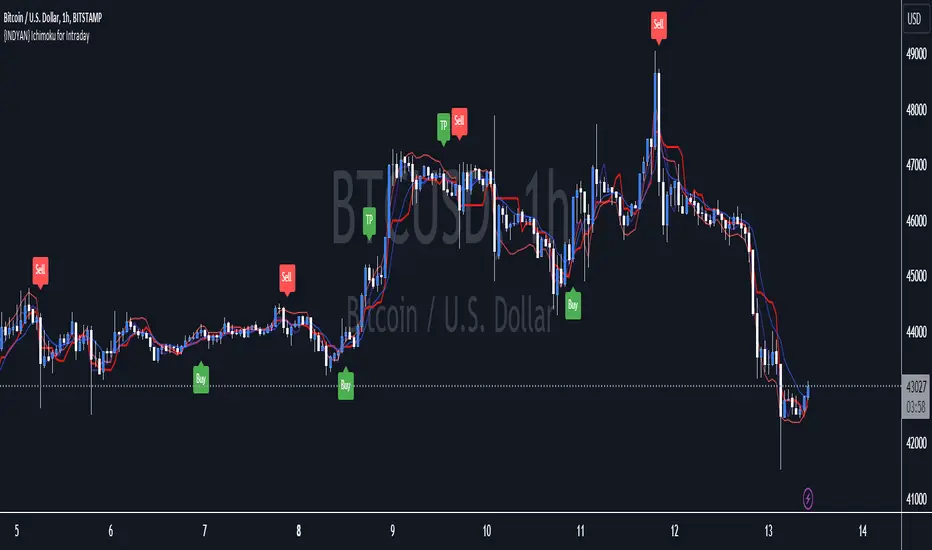
{INDYAN} Ichimoku for IntradayIts based on ichimoku, i removed cloud and mod some changes for better use in intraday trading. It can be used in stocks and index as well.Not tested on MCX and Forex.
Just watch at crossover of tenkan and kijun that RSI macd is above 60 and zero or not? If all three parameters meet go for long... exit when again another cross happen or rsi go below 40.for sell side watch for rsi below 40 and macd below zero line while crossover of kijun tenkan.
Better to use it with RSI+Macd Fast to get more accurate results.
#for better confirmation look value of VWAP and decide accordingly
Do back test before using it.
Happy Trading
Love INDyAN
#change line color as per ur wish but value should be same as it was default entered.
TradeSense Breakout Strategy v1TradeSense is a Renko brick breakout trading system for short-term or intraday trade. It is also a trend following strategy using a confluence of multiple MA's to spot the underlying trend. Exit and Stop Loss is based on dynamic ATR to predict possible target based on ticker's real time volatility.
So far this has been back-tested on major cyrptos, and the same concept is applicable to other asset types. It is more suitable for lower timeframes (such as the 30m, 15m, and 5m) though you may try adjusting the parameters for higher timeframes.
Feel free to backtest it and comment below!
Optimum parameters:
BTCUSD-15m
- Noise Filter: 1
- ATRLength : 15
- SL coefficient : 2.0
- TP coefficient : 1.5
ETHUSD-15m
- Noise Filter: 7
- ATRLength : 16
- SL coefficient : 2.0
- TP coefficient : 1.5

{INDYAN} RSI + MACDModded RSI and MACD for intraday use. If rsi above 60 and macd is above zero line then go for buy and if rsi is below 40 and macd below zero line then go for sell side. use it in small timeframe i.e. 3 minute or less.
better for scalp trading
Happy Trading
Love INDYAN
#It can be used best with INDYAN Go With Trend

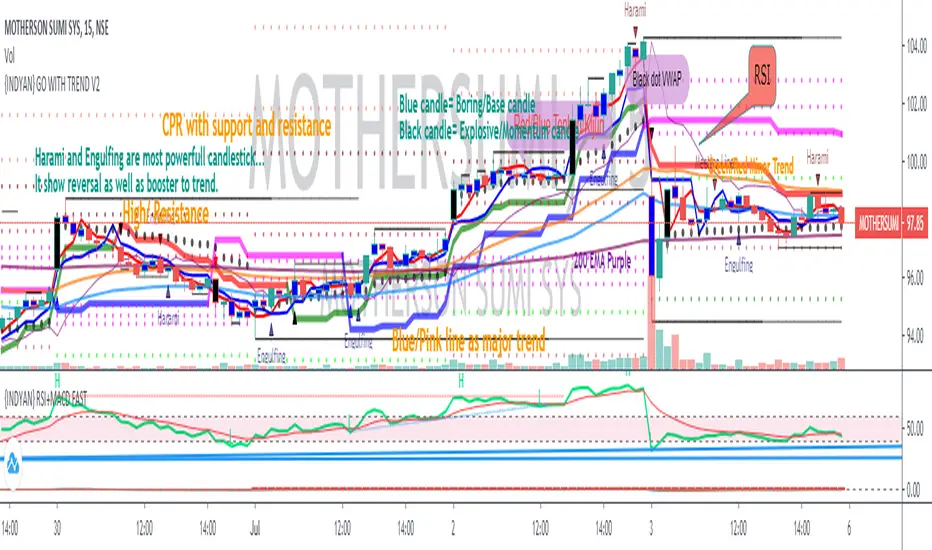
{INDYAN} GO WITH TREND V2This indicator has almost everything for intraday trading . There are two supertrends one with higher time frame and one at lower time frame, Due to which we can recognize reversal. If higher time frame supertrend is showing uptrend and minor is showing downtrend then better to avoid taking any trade in between. Both trend should be in same direction.
Tenkan and kijun is there to verify the trend authencity, check where the tenkan and kijun crossover is there or not at the time of reversal signal given by supertrends. It will boost trading chances.
Also VWAP is placed to know the current situation, If price is below VWAP go for sort if all other things match as above said.
HEMA LEMA is a EMA band and i found that it act as support and resistance, If price breaks channel with volume and sustain above/below for 2 candle close (TIMEFRAME AS SYMBOL).
Also placed FAST EMA to recognize the fast moving trend.
Pivot with CPR is there to trade on basis of CPR and Pivot.
For demand and supply traders, they can use blue and black candle for marking up zones. Blue is boring/base candle and Black is explosive candle.
I hope it will help my trader friends to recognize the trend and reversal.
Let me know if anything more we need to include or remove to make it better for everyone.
Happy Trading... Love INDYAN
#intraday
#hema-lema
#pivot
#cpr
#supertrend_reversal
#demandzone
#supplyzone
#tenkansen
#kijunsen
MACD Bull Crossover and RSI Oversold 5 Candles Ago-Long StrategyHello everyone, I've been having a great time perfecting this strategy for a few weeks now. I finally feel like it's time to release it to the public and share what I have been working on.
This strategy only enters a long trade when the MACD crosses over the signal line and the RSI was oversold looking back 5 candles ago. The logic behind this is to wait for RSI to enter the oversold territory, and then when the market starts to recovery the MACD will crossover telling us the sell off is over.
This strategy will close once these 2 conditions are met.
1. MACD Histogram is above 0 and MACD crosses under the signal line.
2. RSI was overbought 5 previous candles ago.
In the strategies settings, you'll be able to enable visual stop-loss and profit levels and change those levels to what you like, enable up to 5 EMA'S,
ADDONS That Affect Strategy:
* Enable visual stop-loss and profit levels as soon as a buy signal is triggered.
* Modify stop-loss and profit levels.
* Modify RSI oversold and RSI overbought levels.
* Modify MACD Fast and Slow moving average.
ADDONS That Do Not Affect Strategy:
* Enable up to 5 EMA's. (This will not affect strategy, and is the only purpose is for people who like following EMA's.)
Thank you for taking the time to try my strategy. I hope you have the best success. I will be making a short strategy, and alerts for this strategy soon. Follow me for updates!

Daily Moving Averages on Intraday ChartsPrints exponential 8, 21, 50, 100 and 200-day moving averages on intraday charts. For example, if you are on a 5 minute chart, you will see a magenta "X" making the current value of the 8-day EMA with an "8" label above it.
This is NOT a Strat script and it follows more closely the way Scott Redler from T3Live looks at charts. If you acknowledge that the vast majority of the time, price does have some sort of reaction to these daily EMAs (whether just a short relative pause or the beginning of a reversal), this script may be helpful.
The Strat and Rob Smith DO NOT support the use of moving averages. This adds more data to your chart which you may or may not find extraneous.

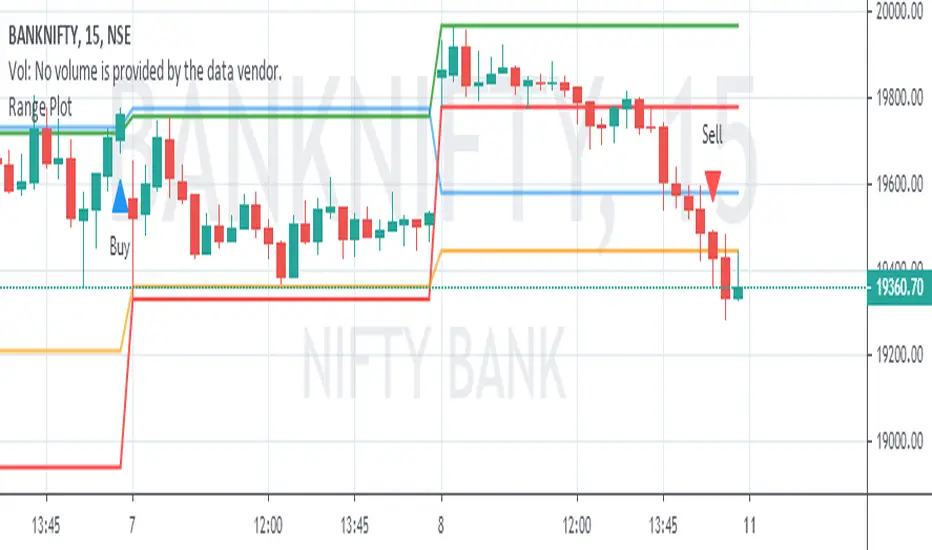
Range PlotToday's first 75 minutes candle high in darker blue color and today's first 75 minutes candle low in darker red color.
Previous trading session last 75 minutes candle high in green color and previous trading session last 75 minutes candle low in orange color.
Today's marking are in blue n red little darker and previous day's last candle marking are in orange and red.
You are likely to familiar with the opening range of 5 min, 15 min, or even of 60 min also. In the opening range, we use today's' candle only. In the range plot, we have made a little addition of previous trading session last candle also. And we got very good results.
Price doesn't know what we have plotted. we just try to make our trading decisions around this area.
Range plot give very good signal in trending scripts and it helps to keep us out from ranging stock.
Badshai Trading ToolsBadshai Trading Tools is the tool where Buy and sell signals generates automatically according to the candles behavior.
It uses WD Gann Levels to calculate entry point with the help of VWAP .
Pivot points determines the recent support and resistance levels.
Trading rule for this indicator
This indicator is designed for Indian equity stocks
Best performance is expected on 10 minutes chart basic user can use 5 minutes chart for stock value less than 500 rupees, else 15 minutes chart
Plotted line shows the market sentiment, green for buy, red for sell and black for neutral market.
Order thumb rule
For buy signals there is a up triangle in green color
For sell signal there is a down triangle in red color
1. avoid any trade signal before 9:35 AM Indian time
2. signal and related stop loss candle must be formed in the same day
3. if order placed in 5 minutes chart then don't go for a target of 15 minutes chart
4. if order placed in 15 minutes time frame and target is too far then check the target in 5 minutes time frame
5. if signal candle touches the target then avoid the signal.
6. Money management is most important for this indicator.
7. Take trade only if it satisfy risk reward ratio.
8. It has long target but need patience.
Signal
using vwap calculates gann square of 9 levels and if any smart money activity on that level then checks the confirmation of the trend by higherhigh or lowerlow formation
Buy Entry : entry price should be on the high of the candle before signal for buy and sl on bottom of flagged candle just before signal
SellEntry : entry price should be on the low of the candle before signal for sell and sl on top of flagged candle just before signal
Please add some extra value to the Stop Loss for safe trading
Warning : Don't place any order without stop loss, This tool is made for educational and learning purpose only, take any trade at your own risk.

FTSMA - Trend is your frendThis my new solid strategy: if you belive that "TREND IS YOUR FRIEND" this is for you!
I have tested with many pairs and at many timeframes and have profit with just minor changes in settings.
I suggest to use it for intraday trading .
VERY IMPORTANT NOTE: this is a trend following strategy, so the target is to stay in the trade as much as possible. If your trading style is more focused on scalping and/or pullbaks, this strategy is not for you.
This strategy uses moving averages applied to Fourier waves for forecasting trend direction.
How strategy works:
- Buy when fast MA is above mid MA and price is above slow MA, which acts as a trend indicator.
- Sell when fast MA is below mid MA and price is below slow MA, which acts as a trend indicator.
Strategy uses a lot of pyramiding orders because when you are in a flat market phase it will close 1 or 2 orders with a loss, but when a big trend starts, it will have profit in a lot of orders.
So, if you analize carefully the strategy results, you will note that "Percent Profitable" is very low (30% in this case) because strategy opened a lot of orders also in flat markets with small losses, BUT "Avg # bars in winning trades" is very high and overall Profit is very high: when a big trend starts, orders are kept open for long time generating big profits.
Thanks to all pinescripters mentioned in the code for their snippets.
I have also a study with alerts. Next improvement (only to whom is interested to this script and follows me): study with alerts on multiple tickers all at one. Leave a comment if you want to have access to study.
HOW TO USE STRATEGY AND STUDY TOGHETER:
1- Add to chart the strategy first, so your workspace will be as clean as possible.
2- Open the Strategy Tester tab at footer of the page.
3- Modify settings to get best results (Profit, Profit Factor, Drawdown).
4- Add study with alerts to your chart with same setting of strategy.
I WILL PROVIDE A DETAILED QUICK INSTALLATION GUIDE WITH THE STUDY!
Please use comment section for any feedback or contact me if you need support.

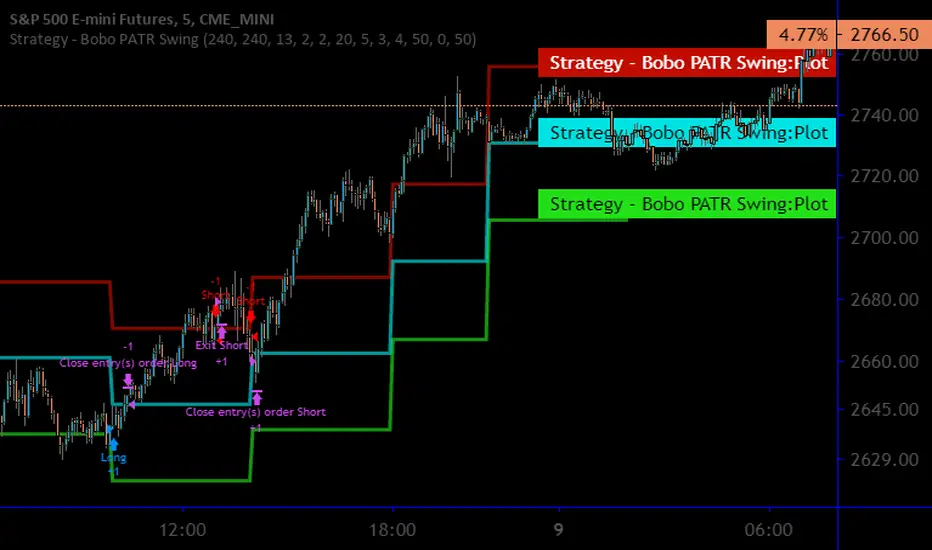
Strategy - Bobo PAPATRHi I've revamped this bot mentioned in the linked idea to make it work with v4 of pine. In doing so there are some very significant changes to how it works. The main one is that it no longer uses traditional daily pivot calculations to calculate the bands. It creates a more dynamic intraday set of pivot points based on recent price action rather than yesterday's ohlc. As published, the bot is tuned for a 15 min time frame. But it actually works well on lower time frames you just need to adjust the lookback periods in settings a bit to re tune it. It's also tuned to ES really but will need tweaking for a different instrument at the very least.
The basic concept is recent price action is used to calculate a 'middle' around which red and green bands are located. Their position or width is largely determined by recent volatility. The middle line is again calculated from recent price action. The three lines from that form a tradeable range with green at the top and red at the bottom. The strategy is simple enough, it shorts as it sinks from outside red, and longs when rising above green. The basic principle being that once you enter that range you have a high probability of hitting the middle before you hit your stop loss. So the basic principle is you are trying to capture the inherent ranginess of liquid indices like S&P 500. That back and forth movement that happens. The bot is capturing this by fading extremes of a recent range but the problem with that is you'dd get murdered in a strong trend. To mitigate that there is a trend calculation running in the background the will prevent trading against firm trends mostly. So the bot should trade mostly in rangy conditions because that is what it is trying to do.
Bot will close issue close signals automatically upon crossing the middle, it also will close automatically at predefined stops or limits. These values are denominated in market mintick values. For example the CFD SPX500 has a mintick of 0.1. Therefore a stop value of 100 will equate to 10 points on the index. If trading the same market via ES1! the mintick value is different - 0.25. So in this case a value of 40 is required to set the stop at 10 points.
Anyway shout if you have questions. Hope it's useful.
TVC:SPX OANDA:SPX500USD

Strategy - Bobo Intraday Swing Bot with filtersThis is an adapted version of my swing bot with additional filters that mean it works quite well on lower timeframes like 1min, 5 mins as long as you adjust the setting accordingly (reduce pivot timescale, band width)
Entry conditions are filtered by an invisible trend calculation running in the background so the bot doesn't repeatedly try and fail to fade a strong trend. It has just about everything you should need for basic use, stop losses and targets, automatically close trade at pivot.
I get good results on rangey instruments like major indices such as SPX / ES that kind of thing. Make sure you understand the minmum tick value of an index so the stop setting on the bot work properly
Hope it's useful!
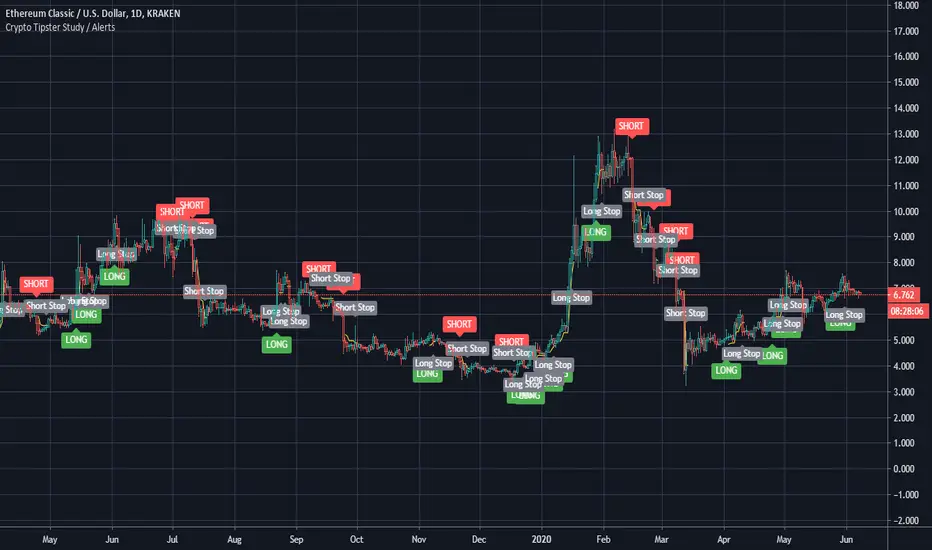
Crypto Tipster Study / Alerts -theCrypster===========
Crypto Tipster Study with Alerts
===========
Our Crypto Tipster Study with Alerts Script is a carbon copy of our tried and tested Crypto Tipster Pro Strategy , but now with the option of setting TradingView Alerts for your chosen trading plan. Making missing trades a thing of the past, and helping you to automate your own trading strategy.
-----------
Crypto Tipster Pro is a trading strategy with indicators based on Technical Analysis, Price Action and Momentum Swings for TradingView's charting platform.
We've compiled and continue to update a trading strategy that adapts to changes in the market; with custom indicator settings, fixed SL/TP, Trailing Stop, Safe Mode, Heikin Ashi Confirmation and more!
Our efforts have been focused towards the 1D time frame - using a larger time frame benefits most part-time or evening traders in multiple ways, catching bigger swings and earning a higher percentage per trade, the ability to reduce or remove any leverage associated with the trade, and only having to place a trade or move a stop loss ONCE per day ~ Meaning you are still able to go to work, tidy the house, play with the kids AND be a successful trader.
-----------
What's Included within Crypto Tipster Pro?
Crypto Tipster Pro comes with a host of features and is being continually updated, these features include (but are not limited to):
- Date Range Settings
Setting custom Start/End dates can help hone your strategy to suit the current times, or get a general overview of the market over the years.
- Heikin Ashi Confirmation
We added HA confirmation for both Entry & Exit of trades. This started as a form of "Safe Mode", we have since adapted this mode beyond Heikin Ashi; but kept this confirmation as an added extra.
- Variable Indicator Settings
As well as our Fixed Indicators and Price Action analysis going on in the background of the strategy, we've also included some Variable Indicators that you have access to edit.
Trend Detection Length for detecting trend! Higher numbers detect longer trends, but will inevitably make fewer trades and possibly miss the start of a new trend; a lower length will create more opportunities to trade but may get confused when ranging in choppy markets.
Range Short/Long Lengths are used for detecting percentage price movements over a given number of bars back. This enables you to effectively "zoom in" on market data and catch trends within trends.
- Safe Mode
Enabling Safe Mode will add a couple more confirmation indicators to the strategy - the aim of Safe Mode is, in essence, to remove any trading signals that would end of being false/bad moves. Usually resulting in less Overall Trades, a higher Net Profit, higher % Profitable, higher Profit Factor AND a lower Drawdown.
- Stop Loss/Take Profit Settings
This is where Crypto Tipster Pro really proves itself, Money Management. We have an editable Fixed SL/TP, as well as Trailing Stops for Long or Short orders, all of which you can use on their own, or combined with each other. Playing with these settings can turn an un-profitable system into a very-profitable system!
- Custom Stop Loss Indicator
This is a little extra indicator that we have found very useful over the years of trading markets, a custom Stop Loss Indicator. Simply turn it on, enter the price you want to calculate from, tick Long or Short, enter a % movement and watch as your new stop loss level is plotted on the chart. This is especially useful for when the strategy doesn't marry up with the prices you've actually obtained (for better or for worse!)
-----------
What's Included within Crypto Tipster Study / Alerts Script?
Our Study script will find Entry and Exit points exactly as our Pro Strategy would find them. The same indicators, methods and chart reading techniques are used, there are 2 big differences however...
The first difference is that our Pro Strategy has the ability to manage your money, Fixed Stops, Take Profit and Trailing Stops to name just a few. Our Study does not (and cannot) have these functions added due to the way TradingView's charting platform operates.
That's the bad news, the good news for our Crypto Tipster Study Script is that you can add Alerts to your trading plan! This is super handy if you decide to implement our methods into various time frames other than 1D and are looking for Intra-day alerts, or if you're looking to Automate your trading strategy using external software.
Help and Advice for setting up Alerts or to Automate your Strategy can be found on our website.
----------
For more information on the Crypto Tipster Pro Strategy visit the link in our signature.
Good Luck and Happy Trading!
Intraday Smart Money ExpertIntraday Masters Analogy is the tool where Buy and sell signals generates automatically according to the candles behavior.
It uses WD Gann Levels to calculate entry point with the help of VWAP .
Pivot points determines the recent support and resistance levels.
Trading rule for this indicator
This indicator is designed for Indian equity stocks
Best performance is expected on 5 minutes chart or 15 minutes chart
Order thumb rule
1. avoid any trade signal before 9:35 AM Indian time
2. signal and and related stop loss candle must be formed in the same day
3. if order placed in 5 minutes chart then don't go for a target of 15 minutes chart
4. if order placed in 15 minutes time frame and target is too far then check the target in 5 minutes time frame
5. if signal candle touches the target then avoid the signal.
6. Money management is most important for this indicator.
7. Take trade only if it satisfy risk reward ratio.
8. It has long target but need patience.
Signal
using vwap calculates gann square of 9 levels and if any smart money activity on that level then checks the confirmation of the trend by higherhigh or lowerlow formation
Buy Entry : entry price should be on the high of the candle before signal for buy and sl on bottom of flagged candle just before signal
SellEntry : entry price should be on the low of the candle before signal for sell and sl on top of flagged candle just before signal
Warning : Don't place any order without stop loss

Intraday Masters AnalogyIntraday Masters Analogy is the tool where Buy and sell signals generates automatically according to the candles behavior.
It uses WD Gann Levels to calculate entry point with the help of VWAP.
Zigzag trend lines shows the momentum behavior for last few days and shows whether it following current trend or building new trend.
Pivot points determines the recent support and resistance levels.
Trading rule for this indicator
This indicator is designed for Indian equity stocks
Best performance is expected on 5 minutes chart or 15 minutes chart
Order thumb rule
1. avoid any trade signal before 9:35 AM Indian time
2. signal and and related stop loss candle must be formed in the same day
3. if order placed in 5 minutes chart then don't go for a target of 15 minutes chart
4. if order placed in 15 minutes time frame and target is too far then check the target in 5 minutes time frame
5. if signal candle touches the target then avoid the signal.
6. Money management is most important for this indicator.
7. Take trade only if it satisfy risk reward ratio
Signal
using vwap calculates gann square of 9 levels and if any smart money activity on that level then checks the confirmation of the trend by higherhigh or lowerlow formation
Buy Entry : entry price should be on the high of the candle before signal for buy and sl on bottom of flagged candle just before signal
SellEntry : entry price should be on the lowof the candle before signal for sell and sl on top of flagged candle just before signal
Warning : Don't place any order without stop loss

gannsquareof9chart2This Indicator works on W.D.Gann Square of 9 chart
gann works on SQUARES: ODD and EVEN
HIGH and LOW of this chart will be the " SQUARES "
this chart provides 7 major and 8 minor levels in between the ODD or EVEN Squares .
major levels are colored in blue and white respectively.
minor levels are colored in olive .
better visibility in dark background
change the color of the levels according to your requirement.
Once the HIGH or LOW (or SQUARES) breaks The next ODD or EVEN SQUARES open up ,
As the breakout of Squares happens the chart expands and acquire the new HIGH or LOW.
I have given Three different resolution option user can switch between:
DAILY ; WEEKLY ; MONTHLY .
thankyou

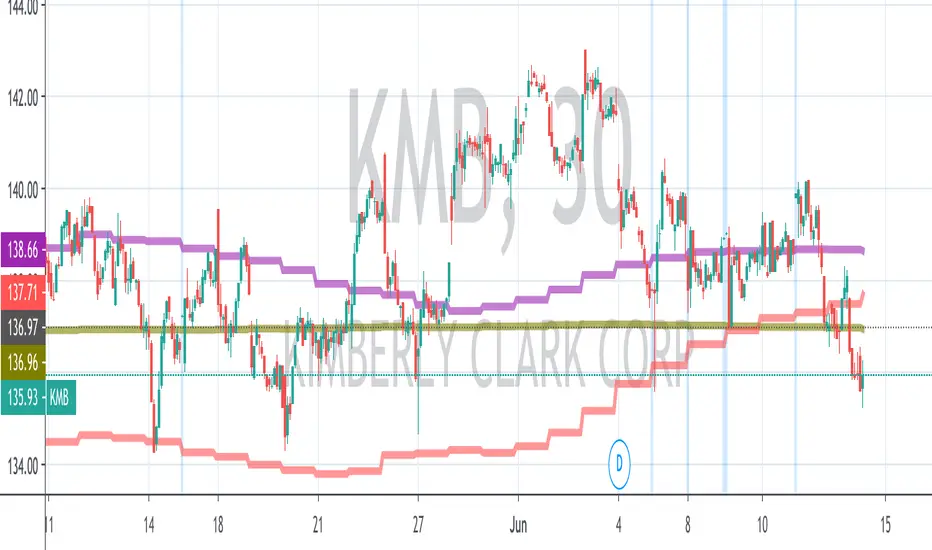
Oasis Group - VWAP / OHLC (Daily / Weekly / Monthly)
5min with the Daily overlay
4hour with the Weekly overly
This Script was influenced be Chris Moody's OHLC Script.
I have created my version of the script and used it to Overlay Daily/Weekly/Monthly Candles over any chosen Intraday Time Frame.
**Important**
The "Stepline" Line style function in pine script is defective so anyone who wants to use this must change all line
styles to "Stepline" manually except for the VWAP Line.
This gives traders a great overall candle experience and also insight into the noise of the intraday.
Intraday traders can keep watch of the highs and Lows along with open and close levels for the larger time frames chosen.
Give us a Follow and Like. This can be used on any Asset class.
I personally use this on Intraday Trading.
Helps me Identify the Prior day Highs and Lows, Closing price compared to the next mornings Opening Price, and daily, weekly, or monthly ranges.
Also included is the powerful VWAP indicator for identifying bullish or bearish pysche.

[HM] VWAP Envelope dinamic intraday v1- VWAP, volume weighted average price;
- Plus Envelope bands:
1) Dinamic, adjusted by volatility:
- - - daily ATR or
- - - daily Standard Deviation
2) or simple fixed % increments bands, defined by user.
# Intraday timeframe only.
# If volume data is absent, the indicator will not work at all.
Hope this could help the community.

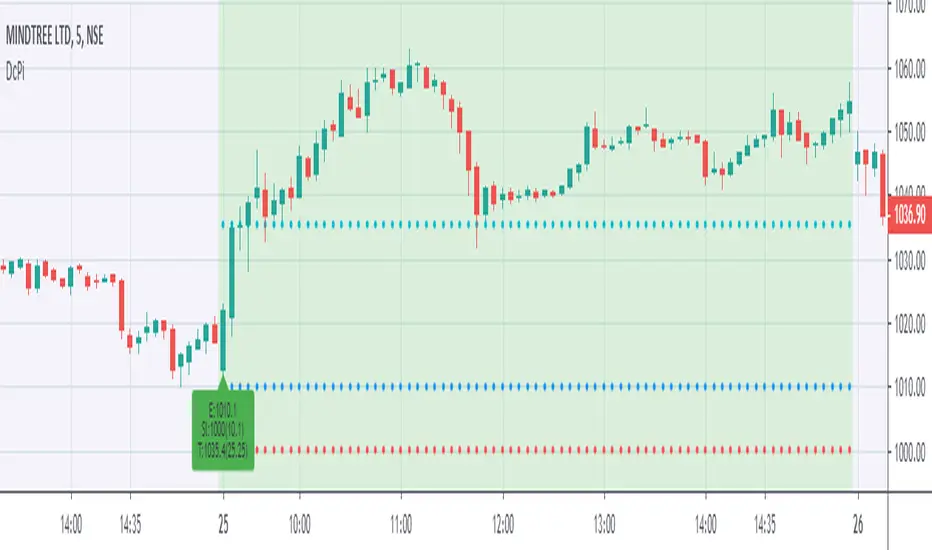
DcPi for intraday tradesDcPi stands for dark cloud and piercing , This is a very reliable pattern for intraday trades.
Precondition-
Whenever a big move is followed by gap(up/down) open next day.
Trade Setup-
Wait for price to enter in previous day range.
Aggressive traders can enter trade as soon as price enters previous day range, safe traders can wait for 1st 5 minute candle close, target can be mid of previous day range.
Trailing stoploss is a good way to secure your profits.
How this indicator helps?
Whenever intraday range will be more than 5% move, chart background will turn light blue, one might add stock to watchlist for next day.
if next day is gap open, chart background will be light green, and a textbox will be displayed with entry, stoploss and targets. One might take trades as explained in trade setup.
How it is dark cloud and piercing pattern?
Green candle followed by gap up open next day and closing in previous day range is Dark cloud on daily timeframe.
Red candle followed by gap down open next day and closing in previous day range is piercing pattern on daily timeframe.
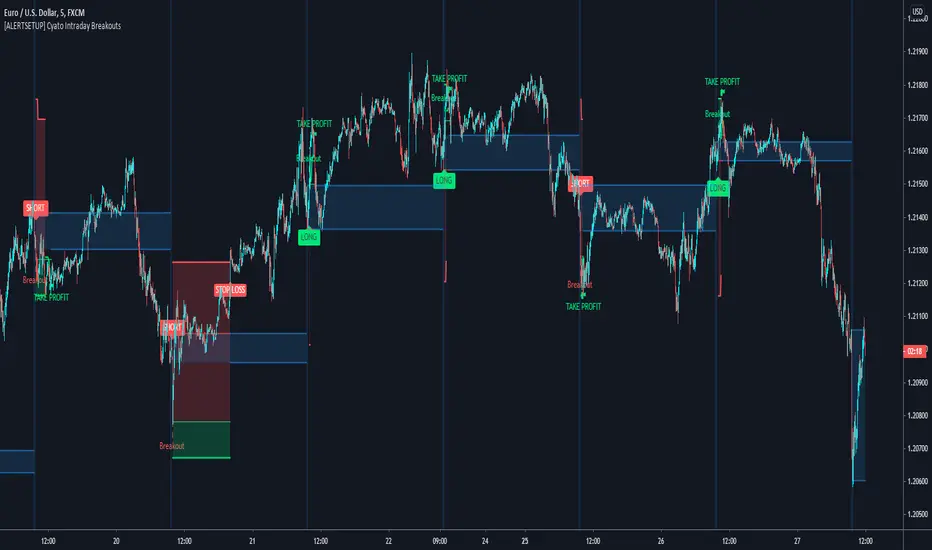
Cyatophilum Intraday Breakouts [ALERT SETUP]Private indicator.
Here is the alert version of the Triple Screen Strategy
Recap of the strategy:
The goal of this indicator is to be able to automate and backtest the strategy, all while staying on a single chart and without repainting.
Features:
Market Tide MACD configuration
Market Wave choice between 3 oscillator: Elder Force Index, Stochastic and William Percent Range
Automated Long and Short entries alerts
Integrated Trailing Stop Loss system fully configurable with automated exit alerts
Integrated Trailing Take profit system fully configurable with automated exit alerts
Indicator samples
Backtest version:
Alerts
Entry Long: Triggers on green long labels.
Take Profit Long: Triggers on the "TAKE PROFIT" green flag if the long target is reached.
Stop Loss Long: Triggers on the "STOP LOSS" or "TSSL" label if the stop loss line has been crossed.
Exit Long: Triggers on either of Take Profit Long or Stop loss long.
Entry Short: Triggers on red short labels.
Take Profit Short: Triggers on the "TAKE PROFIT" green flag if the short target is reached.
Stop Loss Short: Triggers on the "STOP LOSS" or "TSSL" label if the stop loss line has been crossed.
Exit Short: Triggers on either of Take Profit Short or Stop Loss Short.
To get access to this indicator use the link below
Thanks for reading!