Multi Timeframe Silent IchimokuMulti Timeframe Silent Ichimoku
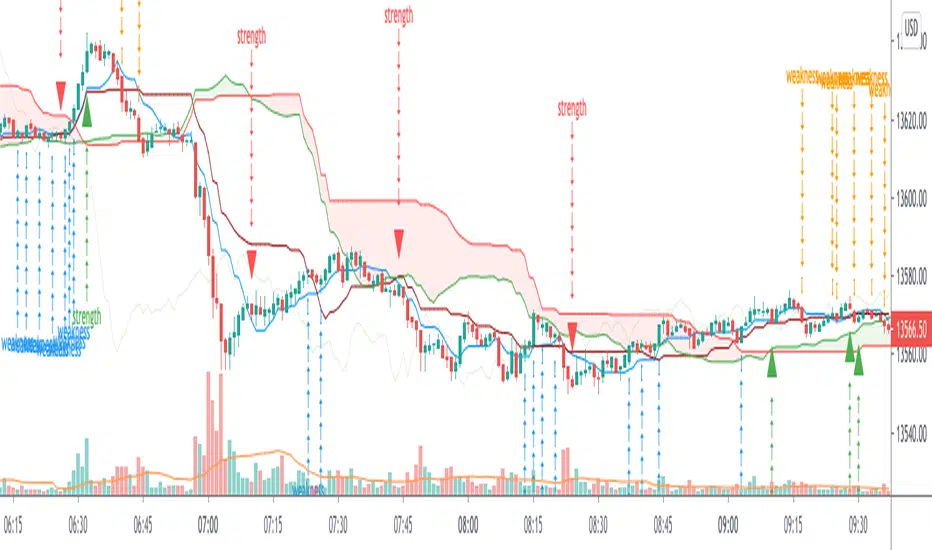
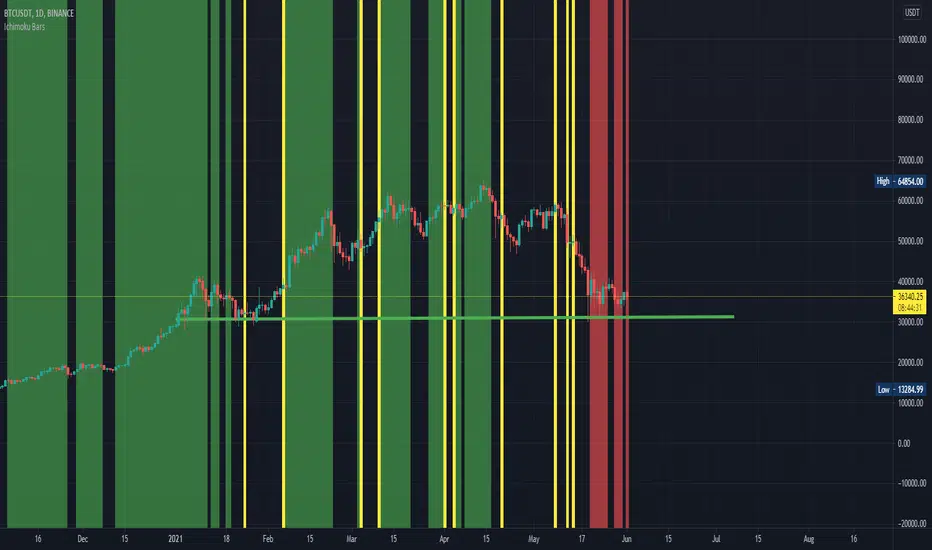
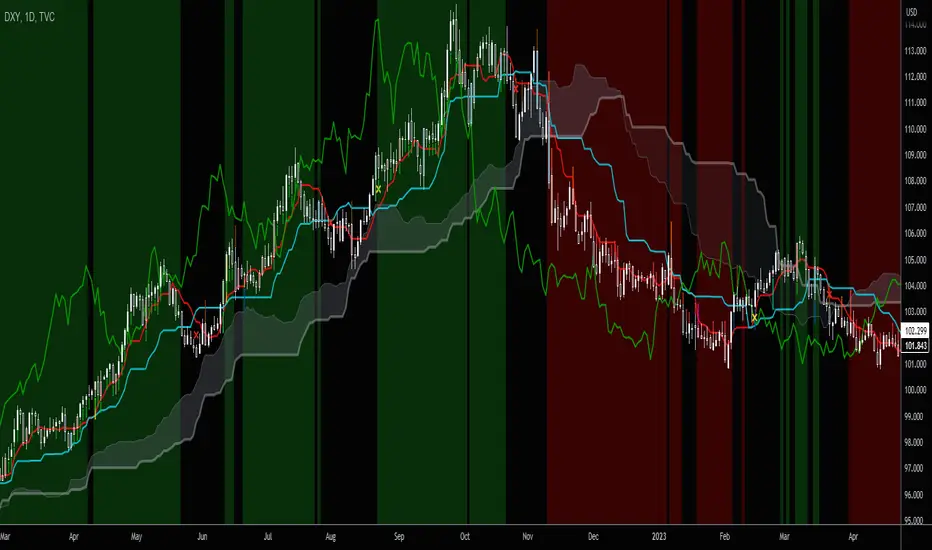
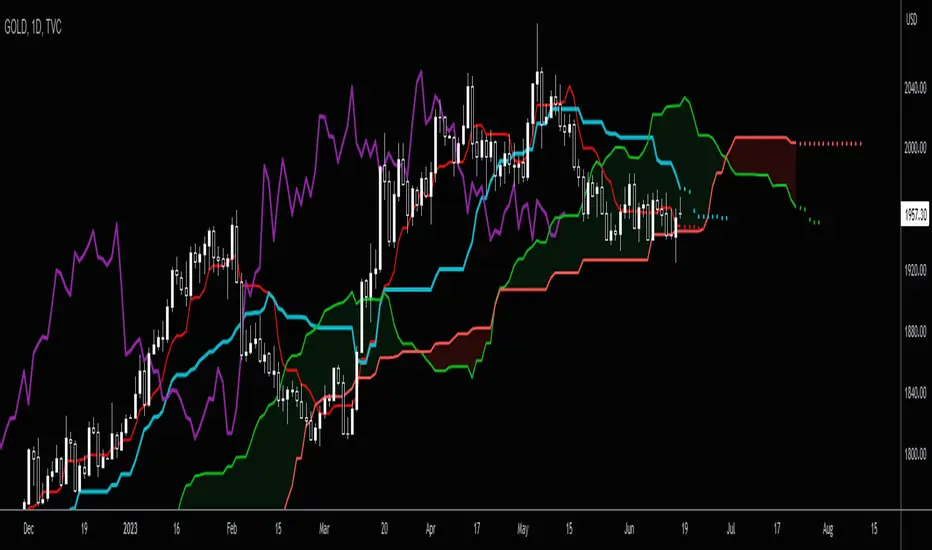
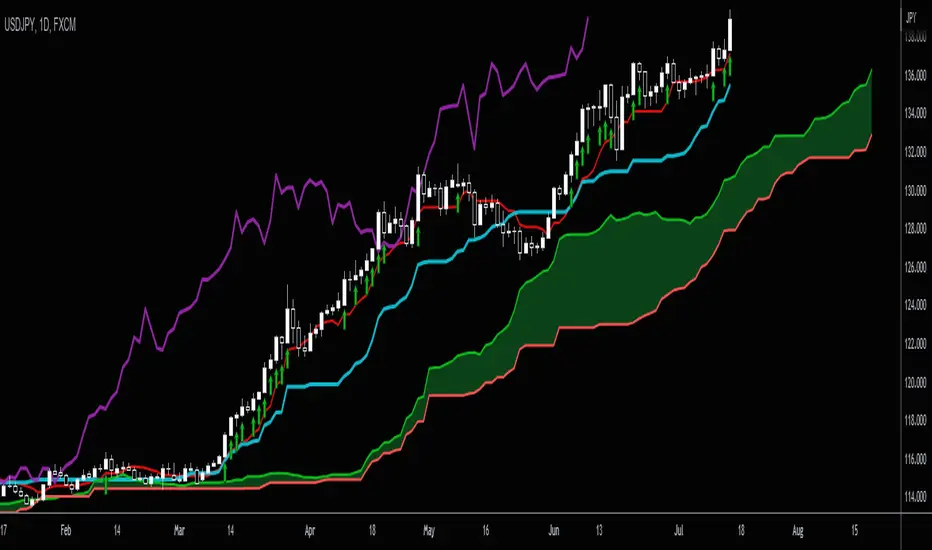
Is an upgrade on my previous Silent Ichimoku indicator witch attempts to filter out the noise from the Ichimoku indicator By only coloring the bars
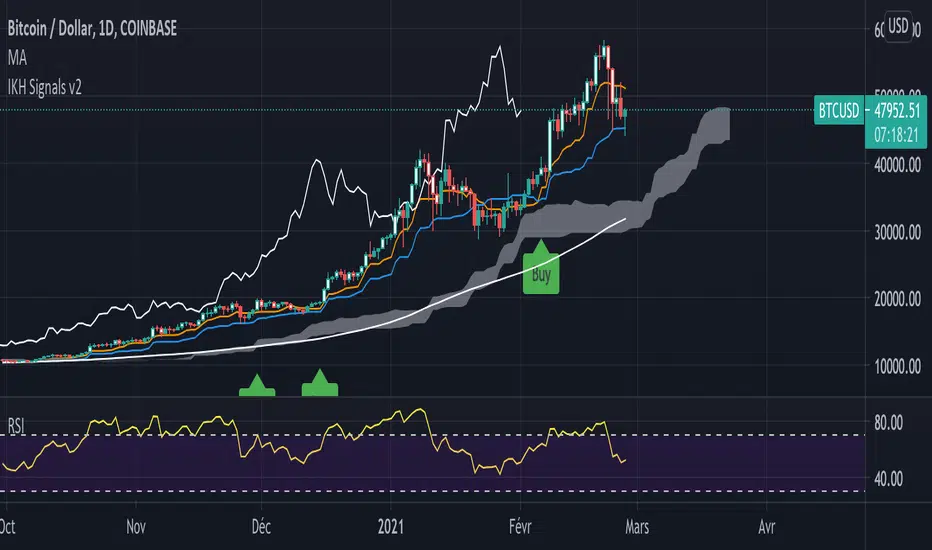
Green if the Ichimoku spots an uptrend
Red if Ichimoku spots a downtrend
And Gray if Ichimoku spots consolidation
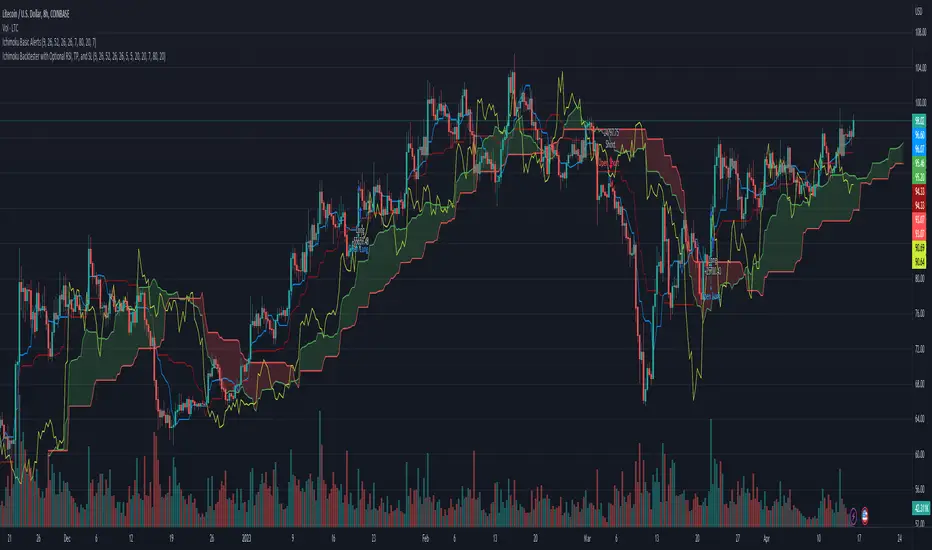
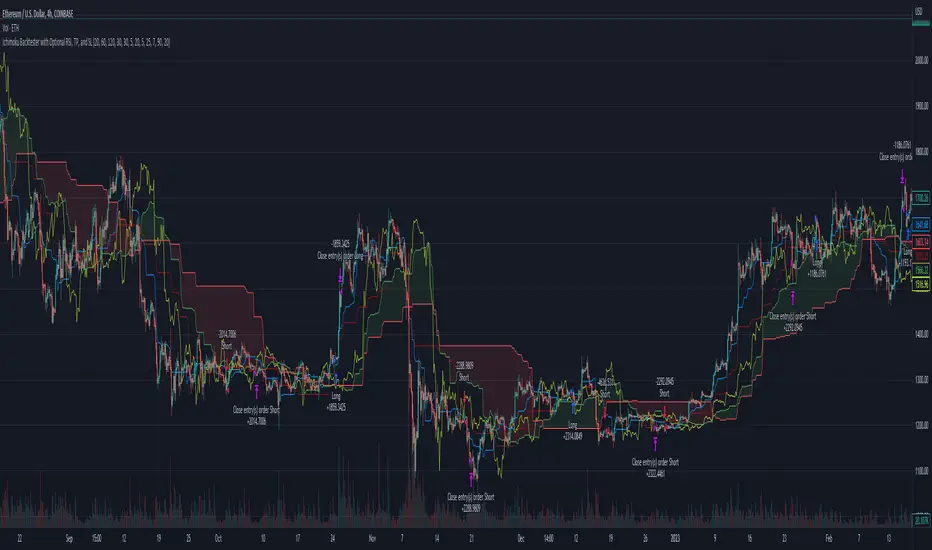
This Indicator adds the ability to filter out some bad signals by taking the Ichimoku from the higher time frame into consideration and providing a visual back test
Huge shout out to fareidzulkifli for the Quick Backtest Framework Awesome tool to add to your framework
Pine Script® 인디케이터