Triangular Hull Moving Average [BigBeluga X PineIndicators]This strategy is based on the original Triangular Hull Moving Average (THMA) + Volatility indicator by BigBeluga. Full credit for the concept and design goes to BigBeluga.
The strategy blends smoothed trend-following logic using a Triangular Hull Moving Average with dynamic volatility overlays, providing actionable trade signals with responsive visual feedback. It's designed for traders who want a non-lagging trend filter while also monitoring market volatility in real time.
How the Strategy Works
1. Triangular Hull Moving Average (THMA) Core
At its core, the strategy uses a Triangular Hull Moving Average (THMA) — a variation of the traditional Hull Moving Average with triple-smoothing logic:
It combines multiple weighted moving averages (WMAs) to create a faster and smoother trend line.
This reduces lag without compromising trend accuracy.
The THMA reacts more responsively to price movements than classic MAs.
THMA Formula:
thma(_src, _length) =>
ta.wma(ta.wma(_src,_length / 3) * 3 - ta.wma(_src, _length / 2) - ta.wma(_src, _length), _length)
This logic filters out short-term noise while still being sensitive to genuine trend shifts.
2. Volatility-Enhanced Candle Plotting
An optional volatility mode overlays the chart with custom candles that incorporate volatility bands:
Wicks expand and contract dynamically based on market volatility.
The volatility value is computed using a HMA of high-low range over a user-defined length.
The candle bodies reflect THMA values, while the wicks reflect the current volatility spread.
This feature allows traders to visually gauge the strength of price moves and anticipate possible breakouts or slowdowns.
3. Trend Reversal Signal Detection
The strategy identifies trend reversals when the THMA line crosses over/under its own past value:
A bullish signal is triggered when THMA crosses above its value from two bars ago.
A bearish signal is triggered when THMA crosses below its value from two bars ago.
These shifts are marked on the chart with triangle-shaped signals for clear visibility.
This logic helps detect momentum shifts early and enables reactive trade entries.
Trade Entry & Exit Logic
Trade Modes Supported
Users can choose between:
Only Long – Enters long trades only.
Only Short – Enters short trades only.
Long & Short – Enables both directions.
Entry Conditions
Long Entry:
Triggered when a bullish crossover is detected.
Active only if the strategy mode allows long trades.
Short Entry:
Triggered when a bearish crossover is detected.
Active only if the strategy mode allows short trades.
Exit Conditions
In Only Long mode, the strategy closes long positions when a bearish signal appears.
In Only Short mode, the strategy closes short positions when a bullish signal appears.
In Long & Short mode, the strategy does not auto-close positions — instead, it opens new positions on each confirmed signal.
Dashboard Visualization
In the bottom-right corner of the chart, a live dashboard displays:
The current trend direction (🢁 for bullish, 🢃 for bearish).
The current volatility level as a percentage.
This helps traders quickly assess market status and adjust their decisions accordingly.
Customization Options
THMA Length: Adjust how smooth or reactive the trend detection should be.
Volatility Toggle & Length: Enable or disable volatility visualization and set sensitivity.
Color Settings: Choose colors for up/down trend visualization.
Trade Direction Mode: Limit the strategy to long, short, or both types of trades.
Use Cases & Strategy Strengths
1. Trend Following
Use the THMA-based candles and triangle signals to enter with momentum. The indicator adapts quickly, reducing lag and improving trade timing.
2. Volatility Monitoring
Visualize the strength of the trend with volatility wicks. Use expanding bands to confirm breakouts and contracting ones to detect weakening moves.
3. Signal Confirmation
Combine this tool with other indicators or use the trend shift triangles as confirmations for manual entries.
Conclusion
The THMA + Volatility Strategy is a non-repainting trend-following system that integrates:
Triangular Hull MA for advanced trend detection.
Real-time volatility visualization.
Clear entry signals based on trend reversals.
Configurable trade direction settings.
It is ideal for traders who:
Prefer smoothed price analysis.
Want to follow trends with precision.
Value visual volatility feedback for breakout detection.
Full credit for the original concept and indicator goes to BigBeluga.
헐 이동 평균 (HMA)

SMIIOLThis indicator generates long signals.
The operation of the indicator is as follows;
First, true strength index is calculated with closing prices. We call this the "ergodic" curve.
Then the average of the ergodic (ema) is calculated to obtain the "signal" curve.
To calculate the "oscillator", the signal is subtracted from ergodic (oscillator = ergodic - signal).
The last variable to be used in the calculation is the average volume, calculated with sma.
Calculation for long signal;
- If the ergodic curve cross up the lower band and,
- If the hma slope is positive,
If all the above conditions are fullfilled, the long input signal is issued with "Buy" label.

Hull Moving Average Adaptive RSI (Ehlers)Hull Moving Average Adaptive RSI (Ehlers)
The Hull Moving Average Adaptive RSI (Ehlers) is an enhanced trend-following indicator designed to provide a smooth and responsive view of price movement while incorporating an additional momentum-based analysis using the Adaptive RSI.
Principle and Advantages of the Hull Moving Average:
- The Hull Moving Average (HMA) is known for its ability to track price action with minimal lag while maintaining a smooth curve.
- Unlike traditional moving averages, the HMA significantly reduces noise and responds faster to market trends, making it highly effective for detecting trend direction and changes.
- It achieves this by applying a weighted moving average calculation that emphasizes recent price movements while smoothing out fluctuations.
Why the Adaptive RSI Was Added:
- The core HMA line remains the foundation of the indicator, but an additional analysis using the Adaptive RSI has been integrated to provide more meaningful insights into momentum shifts.
- The Adaptive RSI is a modified version of the traditional Relative Strength Index that dynamically adjusts its sensitivity based on market volatility.
- By incorporating the Adaptive RSI, the HMA visually represents whether momentum is strengthening or weakening, offering a complementary layer of analysis.
How the Adaptive RSI Influences the Indicator:
- High Adaptive RSI (above 65): The market may be overbought, or bullish momentum could be fading. The HMA turns shades of red, signaling a possible exhaustion phase or potential reversals.
- Neutral Adaptive RSI (around 50): The market is in a balanced state, meaning neither buyers nor sellers are in clear control. The HMA takes on grayish tones to indicate this consolidation.
- Low Adaptive RSI (below 35): The market may be oversold, or bearish momentum could be weakening. The HMA shifts to shades of blue, highlighting potential recovery zones or trend slowdowns.
Why This Combination is Powerful:
- While the HMA excels in tracking trends and reducing lag, it does not provide information about momentum strength on its own.
- The Adaptive RSI bridges this gap by adding a clear visual layer that helps traders assess whether a trend is likely to continue, consolidate, or reverse.
- This makes the indicator particularly useful for spotting trend exhaustion and confirming momentum shifts in real-time.
Best Use Cases:
- Works effectively on timeframes from 1 hour (1H) to 1 day (1D), making it suitable for swing trading and position trading.
- Particularly useful for trading indices (SPY), stocks, forex, and cryptocurrencies, where momentum shifts are frequent.
- Helps identify not just trend direction but also whether that trend is gaining or losing strength.
Recommended Complementary Indicators:
- Adaptive Trend Finder: Helps identify the dominant long-term trend.
- Williams Fractals Ultimate: Provides key reversal points to validate trend shifts.
- RVOL (Relative Volume): Confirms significant moves based on volume strength.
This enhanced HMA with Adaptive RSI provides a powerful, intuitive visual tool that makes trend analysis and momentum interpretation more effective and efficient.
This indicator is for educational and informational purposes only. It should not be considered financial advice or a guarantee of performance. Always conduct your own research and use proper risk management when trading. Past performance does not guarantee future results.

Triple HMA Colored [Chichomax]Triple HMA Colored Indicator Description
The Triple HMA Colored indicator is a sophisticated technical analysis tool designed to enhance trend identification by displaying three Hull Moving Averages (HMAs) on your chart, each with fully customizable periods and dynamic color settings. This indicator is built on the refined HMA calculation method, which leverages weighted moving averages (WMAs) to generate smooth and responsive trend lines with minimal lag.
Key Features:
- Triple HMA Setup:
Displays three HMAs, each computed with different, user-configurable periods, enabling multi-timeframe analysis in a single indicator.
- Dynamic Color Coding:
Each HMA line is color-coded based on its directional movement. When the current HMA value exceeds the previous value, the line is drawn in the designated "up" color, and when it falls below, it switches to the "down" color. This provides immediate visual cues for trend shifts.
- Customizable Inputs:
Users can adjust the period lengths for each of the three HMAs and select from six different color options (two for each HMA) directly from the indicator’s settings panel, ensuring that the tool can be tailored to match various trading strategies and visual preferences.
- Efficient Trend Detection:
By combining the speed of WMAs with the smoothness of the Hull Moving Average, this indicator offers a reliable method to detect market momentum changes, making it a valuable asset for both trend-following and counter-trend strategies.
Ideal for traders who demand flexibility and clarity in their chart analysis, the Triple HMA Colored indicator simplifies the process of tracking market trends across multiple timeframes while providing clear, visual signals for potential entry and exit points.

Btc and Eth 5 min winnerWhat the Strategy Does
Finding the Trend (Like Watching the Bus Move): The strategy uses special tools called Hull Moving Averages (HMAs) to figure out if Bitcoin (BTC) Ethereum (ETH) prices are generally going up or down. It looks at short-term (5 minutes) and long-term (10 minutes) price movements to make sure the “bus” (the market) is moving strongly in one direction—up for buying, down for selling.
Spotting Good Times to Jump On (Buy or Sell Signals): It looks for two types of opportunities:
Pullbacks: When the price dips a little while still moving up (like the bus slowing down but not stopping), it’s a chance to buy.
Breakouts: When the price suddenly jumps higher after being stuck (like the bus speeding up), it’s another chance to buy. It does the opposite for selling when prices are dropping.
It also checks if there’s enough “passenger activity” (volume) and momentum (speed of price change) to make sure it’s a good move.
Avoiding Traffic Jams (Filters): The strategy uses tools like RSI (to check if the market’s too fast or too slow), volume (to see if enough people are trading), and ATR (to measure how wild the price swings are). It skips trades if things look too chaotic or if the trend isn’t strong enough.
Setting Safety Stops and Profit Targets: Once you’re on the “bus,” it sets rules to protect you:
Stop-Loss: If the price moves against you by a small amount (0.5% of the typical price swing), you jump off to avoid losing too much—think of it as getting off before the bus crashes.
Take-Profit: If the price moves in your favor by a small amount (1.0% of the typical swing), you cash out—imagine getting off at your stop with a profit.
Trailing Stop: If the price keeps moving your way, it adjusts your exit point to lock in more profit, like moving your stop closer as the bus keeps going.
Using Leverage (10x Boost): This strategy uses 10x leverage on Binance futures, meaning for every $1 you have, you trade like you have $10. This can make profits (or losses) 10 times bigger, so it’s risky but can be rewarding if you’re careful.
Why 5 Minutes and Bitcoin and Ethereum?
5-Minute Chart: This is like checking the bus every 5 minutes to make quick, small trades—perfect for fast, short profits.
Bitcoin Ethereum (BTC/USD)(ETH/USD): It’s the most popular and liquid crypto, so there’s lots of activity, making it easier to jump on and off without getting stuck.
Why It Aims for 90% Wins (But Be Realistic)
The goal is to win 9 out of 10 trades by being super picky about when to trade—only jumping on when the trend, momentum, and volume are all perfect. But in real trading, markets can be unpredictable, so 90% is very hard to achieve. Still, this strategy tries to be as accurate as possible by avoiding bad moves and focusing on strong trends.
Risks for a New Trader
Leverage: Trading with 10x leverage means small price moves can lead to big losses if you’re not careful. Start with a demo account (pretend money) on TradingView or Binance to practice.
Learning Curve: This strategy uses technical terms (like HMAs, RSI) and tools you’ll need to learn over time. Don’t rush—just practice and ask questions!
How to Use It
Go to TradingView, load this strategy on a 5-minute BTC/USD futures chart on Binance.
Watch the green triangles (buy signals) and red triangles (sell signals) on the chart—they tell you when to trade.
Use the stops and targets to manage your trades—don’t guess, let the strategy guide you.
Start small, learn from each trade, and don’t risk money you can’t afford to lose.
This is like learning to ride a bike—start slow, practice, and you’ll get better. If you have more questions or want simpler tips, feel free to ask! Trading can be fun and rewarding, but it takes patience and practice.

Uptrick Signal Density Cloud🟪 Introduction
The Uptrick Signal Density Cloud is designed to track market direction and highlight potential reversals or shifts in momentum. It plots two smoothed lines on the chart and fills the space between them (often called a “cloud”). The bars on the chart change color depending on bullish or bearish conditions, and small triangles appear when certain reversal criteria are met. A metrics table displays real-time values for easy reference.
🟩 Why These Features Have Been Linked Together
1) Dual-Line Structure
Two separate lines represent shorter- and longer-term market tendencies. Linking them in one tool allows traders to view both near-term changes and the broader directional bias in a single glance.
2) Smoothed Averages
The script offers multiple smoothing methods—exponential, simple, hull, and an optimized approach—to reduce noise. Using more than one type of moving average can help balance responsiveness with stability.
3) Density Cloud Concept
Shading the region between the two lines highlights the gap or “thickness.” A wider gap typically signals stronger momentum, while a narrower gap could indicate a weakening trend or potential market indecision. When the cloud is too wide and crosses a certain threshold defined by the user, it indicates a possible reversal. When the cloud is too narrow it may indicate a potential breakout.
🟪 Why Use This Indicator
• Trend Visibility: The color-coded lines and bars make it easier to distinguish bullish from bearish conditions.
• Momentum Tracking: Thicker cloud regions suggest stronger separation between the faster and slower lines, potentially indicating robust momentum.
• Possible Reversal Alerts: Small triangles appear within thick zones when the indicator detects a crossover, drawing attention to key moments of potential trend change.
• Quick Reference Table: A metrics table shows line values, bullish or bearish status, and cloud thickness without needing to hover over chart elements.
🟩 Inputs
1) First Smoothing Length (length1)
Default: 14
Defines the lookback period for the faster line. Lower values make the line respond more quickly to price changes.
2) Second Smoothing Length (length2)
Default: 28
Defines the lookback period for the slower line or one of the moving averages in optimized mode. It generally responds more slowly than the faster line.
3) Extra Smoothing Length (extraLength)
Default: 50
A medium-term period commonly seen in technical analysis. In optimized mode, it helps add broader perspective to the combined lines.
4) Source (source)
Default: close
Specifies the price data (for example, open, high, low, or a custom source) used in the calculations.
5) Cloud Type (cloudType)
Options: Optimized, EMA, SMA, HMA
Determines the smoothing method used for the lines. “Optimized” blends multiple exponential averages at different lengths.
6) Cloud Thickness Threshold (thicknessThreshold)
Default: 0.5
Sets the minimum separation between the two lines to qualify as a “thick” zone, indicating potentially stronger momentum.
🟪 Core Components
1) Faster and Slower Lines
Each line is smoothed according to user preferences or the optimized technique. The faster line typically reacts more quickly, while the slower line provides a broader overview.
2) Filled Density Cloud
The space between the two lines is filled to visualize in which direction the market is trending.
3) Color-Coded Bars
Price bars adopt bullish or bearish colors based on which line is on top, providing an immediate sense of trend direction.
4) Reversal Triangles
When the cloud is thick (exceeding the threshold) and the lines cross in the opposite direction, small triangles appear, signaling a possible market shift.
5) Metrics Table
A compact table shows the current values of both lines, their bullish/bearish statuses, the cloud thickness, and whether the cloud is in a “reversal zone.”
🟩 Calculation Process
1) Raw Averages
Depending on the mode, standard exponential, simple, hull, or “optimized” exponential blends are calculated.
2) Optimized Averages (if selected)
The faster line is the average of three exponential moving averages using length1, length2, and extraLength.
The slower line similarly uses those same lengths multiplied by 1.5, then averages them together for broader smoothing.
3) Difference and Threshold
The absolute gap between the two lines is measured. When it exceeds thicknessThreshold, the cloud is considered thick.
4) Bullish or Bearish Determination
If sma1 (the faster line) is above sma2 (the slower line), conditions are deemed bullish; otherwise, they are bearish. This distinction is reflected in both bar colors and cloud shading.
5) Reversal Markers
In thick zones, a crossover triggers a triangle at the point of potential reversal, alerting traders to a possible trend change.
🟪 Smoothing Methods
1) Exponential (EMA)
Prioritizes recent data for quicker responsiveness.
2) Simple (SMA)
Takes a straightforward average of the chosen period, smoothing price action but often lagging more in volatile markets.
3) Hull (HMA)
Employs a specialized formula to reduce lag while maintaining smoothness.
4) Optimized (Blended Exponential)
Combines multiple EMA calculations to strike a balance between responsiveness and noise reduction.
🟩 Cloud Logic and Reversal Zones
Cloud thickness above the defined threshold typically signals exceeding momentum and can lead to a quick reversal. During these thick periods, if the width exceeds the defined threshold, small triangles mark potential reversal points. In order for the reversal shape to show, the color of the cloud has to be the opposite. So, for example, if the cloud is bearish, and exceeds momentum, defined by the user, a bullish signal appears. The opposite conditions for a bullish signal. This approach can help traders focus on notable changes rather than minor oscillations.
🟪 Bar Coloring and Layered Lines
Bars take on bullish or bearish tints, matching the faster line’s position relative to the slower line. The lines themselves are plotted multiple times with varying opacities, creating a layered, glowing look that enhances visibility without affecting calculations.
🟩 The Metrics Table
Located in the top-right corner of the chart, this table displays:
• SMA1 and SMA2 current values.
• Bullish or bearish alignment for each line.
• Cloud thickness.
• Reversal zone status (in or out of zone).
This numeric readout allows for a quick data check without hovering over the chart.
🟪 Why These Specific Moving Average Lengths Are Used
Default lengths of 14, 28, and 50 are common in technical analysis. Fourteen captures near-term price movement without overreacting. Twenty-eight, roughly double 14, provides a moderate smoothing level. Fifty is widely regarded as a medium-term benchmark. Multiplying each length by 1.5 for the slower line enhances separation when combined with the faster line.
🟩 Originality and Usefulness
• Multi-Layered Smoothing. The user can select from several moving average modes, including a unique “optimized” blend, possibly reducing random fluctuations in the market data.
• Combined Visual and Numeric Clarity. Bars, clouds, and a real-time table merge into a single interface, enabling efficient trend analysis.
• Focus on Significant Shifts. Thick cloud zones and triangles draw attention to potentially stronger momentum changes and plausible reversals.
• Flexible Across Markets. The adjustable lengths and threshold can be tuned to different asset classes (stocks, forex, commodities, crypto) and timeframes.
By integrating multiple technical concepts—cloud-based trend detection, color coding, reversal markers, and an immediate reference table—the Uptrick Signal Density Cloud aims to streamline chart reading and decision-making.
🟪 Additional Considerations
• Timeframes. Intraday, daily, and weekly charts each yield different signals. Adjust the smoothing lengths and threshold to suit specific trading horizons.
• Market Types. Though applicable across asset classes, parameters might need tweaking to address the volatility of commodities, forex pairs, or cryptocurrencies.
• Confirmation Tools. Pairing this indicator with volume studies or support/resistance analysis can improve the reliability of signals.
• Potential Limitations. No indicator is foolproof; sudden market shifts or choppy conditions may reduce accuracy. Cautious position sizing and risk management remain essential.
🟩 Disclaimers
The Uptrick Signal Density Cloud relies on historical price data and may lag sudden moves or provide false positives in ranging conditions. Always combine it with other analytical techniques and sound risk management. This script is offered for educational purposes only and should not be considered financial advice.
🟪 Conclusion
The Uptrick Signal Density Cloud blends trend identification, momentum assessment, and potential reversal alerts in a single, user-friendly tool. With customizable smoothing methods and a focus on cloud thickness, it visually highlights important market conditions. While it cannot guarantee predictive accuracy, it can serve as a comprehensive reference for traders seeking both a quick snapshot of the current trend and deeper insights into market dynamics.

Uptrick: Zero Lag HMA Trend Suite1. Name and Purpose
Uptrick: Zero Lag HMA Trend Suite is a Pine Version 6 script that builds upon the Hull Moving Average (HMA) to offer an advanced trend analysis tool. Its purpose is to help traders identify trend direction, potential reversals, and overall market momentum with reduced lag compared to traditional moving averages. By combining the HMA with Average True Range (ATR) thresholds, slope-dependent coloring, Volume Weighted Average Price (VWAP) ribbons, and optional reversal signals, the script aims to give a detailed view of price activity in various market environments.
2. Overview
This script begins with the calculation of a Hull Moving Average, a method that blends Weighted Moving Averages in a way designed to cut down on lag while still smoothing out price fluctuations. Next, several enhancements are applied. The script compares current HMA values to previous ones for slope-based coloring, which highlights uptrends and downtrends at a glance. It also plots buy and sell signals when price moves beyond or below thresholds determined by the ATR and the user’s chosen signal multiplier. An optional VWAP ribbon can be shown to confirm bullish or bearish conditions relative to a volume-weighted benchmark. Additionally, the script can plot reversal signals (labeled with B) at points where price crosses back toward the HMA from above or below. Taken together, these elements allow traders to visualize both the short-term momentum and the broader context of how price interacts with volatility and overall market direction.
3. Why These Indicators Have Been Linked Together
The reason the Hull Moving Average, the Average True Range, and the VWAP have been integrated into one script is to tackle multiple facets of market analysis in a single tool. The Zero Lag Hull Moving Average provides a responsive trend line, the ATR offers a measure of volatility that helps distinguish significant price shifts from typical fluctuations, and the VWAP acts as a reference for fair value based on traded volume. By layering all three, the script helps traders avoid the need to juggle multiple separate indicators and offers a holistic perspective. The slope-based coloring focuses on trend direction, the ATR-based thresholds refine possible buy and sell zones, and the VWAP ribbons provide insight into how price stands relative to an important volume-weighted level. The inclusion of up and down signals and reversal B labels further refines entries and exits.
4. Why Use Uptrick: Zero Lag HMA Trend Suite
The Hull Moving Average is already known for reacting more quickly to price changes compared to other moving averages while retaining a degree of smoothness. This suite enhances the basic HMA by showing colored gradients that make it easy to spot trend direction changes, highlighting potential entry or exit points based on volatility-driven thresholds, and optionally layering a volume-based measure of bullish or bearish market sentiment. By relying on a zero lag approach and additional data points, the script caters to those wanting a more responsive method of identifying shifts in market dynamics. The added reversal signals and up or down alerts give traders extra confirmation for potential turning points.
5. How This Extension Improves on the Basic HMA
This extension not only plots the Hull Moving Average but also includes data-driven alerts and visual cues that traditional HMA lines do not provide. First, it offers multi-layered slope coloring, making up or down trends quickly apparent. Second, it uses ATR-based thresholds to pinpoint moments when price may be extending beyond normal volatility, thus generating buy or sell signals. Third, the script introduces an optional VWAP ribbon to indicate whether the market is trading above or below this pivotal volume-weighted benchmark, adding a further confirmation step for bullish or bearish conditions. Finally, it incorporates optional reversal signals labeled with B, indicating points where price might swing back toward the main HMA line.
6. Core Components
The script can be broken down into several primary functions and features.
a. Zero Lag HMA Calculation
Uses two Weighted Moving Averages (half-length and full-length) combined through a smoothing step based on the square root of the chosen length. This approach is designed to reduce lag significantly compared to other moving averages.
b. Slope Detection
Compares current and prior HMA values to determine if the trend is up or down. The slope-based coloring changes between turquoise shades for upward movement and magenta shades for downward movement, making trend direction immediately visible.
c. ATR-Based Thresholding for Up and Down Signals
The script calculates an Average True Range over a user-defined period, then multiplies it by a signal factor to form two bands around the HMA. When price crosses below the lower band, an up (buy) signal appears; when it crosses above the upper band, a down (sell) signal is shown.
d. Reversal Signals (B Labels)
Tracks when price transitions back toward the main HMA from an extreme zone. When enabled, these reversal points are labeled with a B and can help traders see potential turning points or mean-reversion setups.
e. VWAP Bands
An optional Volume Weighted Average Price ribbon that plots above or below the HMA, indicating bullish or bearish conditions relative to a volume-weighted price benchmark. This can also act as a kind of support/ resistance.
7. User Inputs
a. HMA Length
Controls how quickly the moving average responds to price changes. Shorter lengths react faster but can lead to more frequent signals, whereas longer lengths produce smoother lines.
b. Source
Specifies the price input, such as close or an alternative source, for the calculation. This can help align the HMA with specific trading strategies.
c. ATR Length and Signal Multiplier
Defines how the script calculates average volatility and sets thresholds for buy or sell alerts. Adjusting these values can help filter out noise or highlight more aggressive signals.
d. Slope Index
Determines how many bars to look back for detecting slope direction, influencing how sensitive the slope coloring is to small fluctuations.
e. Show Buy and Sell Signals, Reversal Signals, and VWAP
Lets users toggle the display of these features. Turning off certain elements can reduce chart clutter if traders prefer a simpler layout.
8. Calculation Process
The script’s calculation follows a step-by-step approach. It first computes two Weighted Moving Averages of the selected price source, one over half the specified length and one over the full length. It then combines these using 2*wma1 minus wma2 to reduce lag, followed by applying another weighted average using the square root of the length. Simultaneously, it computes the ATR for a user-defined period. By multiplying ATR by the signal multiplier, it establishes upper and lower bands around the HMA, where crossovers generate buy (up) or sell (down) signals. The script can also plot reversal signals (B labels) when price crosses back from these bands in the opposite direction. For the optional VWAP feature, Pine Script’s ta.vwap function is used, and differences between the HMA and VWAP levels determine the color and opacity of the ribbon.
9. Signal Generation and Filtering
The ATR-based thresholds reduce the influence of small, inconsequential price swings. When price falls below the lower band, the script issues an up (buy) signal. If price breaks above the upper band, a down (sell) signal appears. These signals are visible through labels placed near the bars. Reversal signals, labeled with B, can be turned on to help detect when price retraces from an extended area back toward the main HMA line. Traders can disable or enable these signals to match their preferred level of chart detail or risk tolerance.
10. Visualization on the Chart
The Zero HMA Lag Trend Suite aims for visual clarity. The HMA line is plotted multiple times with increasing transparency to create a gradient effect. Turquoise gradients indicate upward slopes, and magenta gradients signify downward slopes. Bar coloring can be configured to align with the slope direction, providing quick insight into current momentum. When enabled, buy or sell labels are placed under or above the bars as price crosses the ATR-defined boundaries. If the reversal option is active, B labels appear around areas where price changes direction. The optional VWAP ribbons form background bands, using distinct coloration to signal whether price is above or below the volume-weighted metric.
11. Market Adaptability
Because the script’s parameters (HMA length, ATR length, signal multiplier, and slope index) are user-configurable, it can adapt to a wide range of markets and timeframes. Intraday traders may prefer a shorter HMA length for quick signals, while swing or position traders might use a longer HMA length to filter out short-lived price changes. The source setting can also be adjusted, allowing for specialized data inputs beyond just close or open values.
12. Risk Management Considerations
The script’s signals and labels are based on past price data and volatility readings, and they do not guarantee profitable outcomes. Sharp market reversals or unforeseen fundamental events can produce false signals. Traders should combine this tool with broader risk management strategies, including stop-loss placement, position sizing, and independent market analyses. The Zero HMA Lag Trend Suite can help highlight potential opportunities, but it should not be relied upon as the sole basis for trade decisions.
13. Combining with Other Tools
Many traders choose to verify signals from the Zero HMA Lag Trend Suite using popular indicators like the Relative Strength Index (RSI), Moving Average Convergence Divergence (MACD), or even simple volume-based metrics to confirm whether a price movement has sufficient momentum. Conventional techniques such as support and resistance levels, chart patterns, or candlestick analysis can also supplement signals generated by the script’s up, down, or reversal B labels.
14. Parameter Customization and Examples
a. Short-Term Day Trading
Using a shorter HMA length (for instance, 9 or 14) and a slightly higher ATR multiplier might provide timely buy and sell signals, though it may also produce more whipsaws in choppy markets.
b. Swing or Position Trading
Selecting a longer HMA length (such as 50 or 100) with a moderate ATR multiplier can help users track more significant and sustained market moves, potentially reducing the effect of minor fluctuations.
c. Multiple Timeframe Blends
Some traders load two versions of the indicator on the same chart, one for short-term signals (with frequent B label reversals) and another for the broader trend direction, aligning entry and exit decisions with the bigger picture.
15. Realistic Expectations
Even though the Hull Moving Average helps minimize lag and the script incorporates volatility-based filters and optional VWAP overlays, it cannot predict future market behavior with complete accuracy. Periods of low liquidity or sudden market shocks can still lead to signals that do not reflect longer-term trends. Frequent parameter review and manual confirmation are advised before executing trades based solely on the script’s outputs.
16. Theoretical Background
The Hull Moving Average formula aims to balance smoothness with reactivity, accomplished by combining Weighted Moving Averages at varying lengths. By subtracting a slower average from a faster one and then applying another smoothing step with the square root of the original length, the HMA is designed to respond more promptly to price changes than typical exponential or simple moving averages. The ATR component, introduced by J. Welles Wilder, calculates the average range of price movement over a user-defined period, allowing the script to assess volatility and adapt signals accordingly. VWAP provides a volume-weighted benchmark that many institutional traders track to gauge fair intraday value.
17. Originality and Uniqueness
Although multiple HMA-based indicators can be found, Uptrick: Zero Lag HMA Trend Suite sets itself apart by merging slope-based coloring, ATR thresholds, VWAP ribbons, up or down labels, and optional reversal signals all in one cohesive platform. This synergy aims to reduce chart clutter while still giving traders a comprehensive look at trend direction, volatility, and volume-based sentiment.
18. Summary
Uptrick: Zero Lag HMA Trend Suite is a specialized trading script designed to highlight potential market trends and reversals with minimal delay. It leverages the Hull Moving Average for an adaptive yet smooth price line, pairs ATR-based thresholds for detecting possible breakouts or dips, and provides VWAP-based ribbons for added volume-weighted context. Traders can further refine their entries and exits by enabling up or down signals and reversal labels (B) where price may revert toward the HMA. Suitable for a wide range of timeframes and instrument types, the script encourages a disciplined approach to trade management and risk control.
19. Disclaimer
This script is provided for informational and educational purposes only. Trading and investing involve significant financial risk, and no indicator can guarantee success under all conditions. Users should practice robust risk management, including the placement of stop losses and position sizing, and should confirm signals with additional analysis tools. The developer of this script assumes no liability for any trading decisions or outcomes resulting from its use.

Hull Suite by MRS**Hull Suite by MRS Strategy Indicator**
The Hull Suite by MRS Strategy is a technical analysis tool designed to provide insights into market trends using variations of the Hull Moving Average (HMA). This strategy aims to help traders identify optimal entry points for both long and short positions by utilizing multiple types of Hull-based indicators.
### Key Features:
1. **Hull Moving Average Variations**: The indicator offers three different Hull Moving Average variants:
- **HMA (Hull Moving Average)**: A fast-moving average that minimizes lag and reacts quickly to price changes.
- **EHMA (Enhanced Hull Moving Average)**: A smoother version of HMA with reduced noise, offering a clearer view of market trends.
- **THMA (Triple Hull Moving Average)**: A more complex Hull average that aims to provide a stronger confirmation of trend direction.
2. **Customizable Parameters**:
- **Source Selection**: Allows traders to choose the source for calculation (e.g., closing prices).
- **Length**: A configurable parameter to adjust the period over which the moving average is calculated (e.g., 55-period for swing entries).
- **Trend Coloring**: Users can enable automatic color-coding of the Hull moving average to reflect whether the market is in an uptrend (green) or downtrend (red).
- **Candle Color**: Option to color candles based on Hull's trend, further improving the visual clarity of trend direction.
3. **Entry and Exit Signals**:
- **Buy Signal**: Generated when the Hull moving average crosses above its historical value, indicating a potential upward price movement.
- **Sell Signal**: Triggered when the Hull moving average crosses below its historical value, signaling a potential downward price movement.
- The strategy can be customized to work with long, short, or both directions, making it adaptable for various market conditions.
4. **Visual Representation**:
- **Hull Bands**: The indicator can plot the Hull moving average as bands, with customizable transparency to suit individual preferences.
- **Band Filler**: The area between the two Hull moving averages is filled, making it easier to identify trends at a glance.
5. **Backtesting and Strategy Execution**: This strategy can be tested on historical data with adjustable backtest start and stop dates, providing traders with a better understanding of its performance before live trading.
### Purpose:
The Hull Suite by MRS Strategy is designed to assist traders in determining the optimal time to enter and exit the market based on robust Hull moving averages. With its flexibility, it can be used for trend-following, swing trading, or other strategic applications.

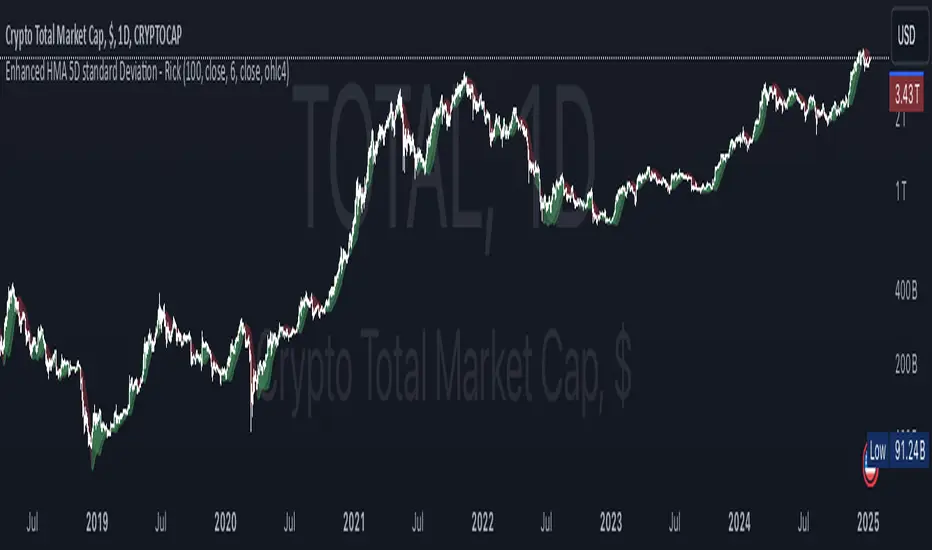
Enhanced HMA 5D standard Deviation - RickSimple hull moving average enhanced with standard deviation bands calculated over a 5 day period to account for volatility in ranging periods.
Possibility to choose the source of the hull calculation, as well as the source to use as threshold for long and short signal.
Two different types of visualization: candle coloring or moving average.
HMA Buy Sell Signals - Profit ManagerNote : Settings should be adjusted according to the selected time frame. Try to find the best setting according to the profitability rate
Overall Functionality
This script combines several trading tools to create a comprehensive system for trend analysis, trade execution, and performance tracking. Users can identify market trends using specific moving averages and RSI indicators while managing profit and loss levels automatically.
Trend Detection and Trade Signals
Hull Moving Averages (HMA):
Two HMAs (a faster one and a slower one) are used to determine the market trend.
A buy signal is generated when the faster HMA crosses above the slower HMA.
Conversely, a sell signal is triggered when the faster HMA crosses below the slower one.
Visual Feedback:
Trend lines on the chart change color to reflect the trend direction (e.g., green for upward trends and red for downward trends).
Trade Levels and Management
Entry, Take-Profit, and Stop-Loss Levels:
When the trend shifts upwards, the script calculates entry, take-profit, and stop-loss levels based on the opening price.
Similarly, for downward trends, these levels are determined for short trades.
Commission Tracking:
Each trade includes a commission cost, which is factored into net profit and loss calculations.
Dynamic Labels:
Entry, take-profit, and stop-loss levels are visually marked on the chart for easier tracking.
Performance Tracking
Profit and Loss Tracking:
The script keeps a running total of profits, losses, and commissions for both long and short trades.
It also calculates the net profit after all costs are considered.
Performance Table:
A table is displayed on the chart summarizing:
The number of trades.
Total profit and loss for long and short positions.
Commission costs.
Net profit.
Fractal Support and Resistance
Dynamic Lines:
The script identifies the most recent significant highs and lows using fractals.
It draws support and resistance lines that automatically update as new fractals form.
Simplified Visuals:
The chart always shows the last two support and resistance lines, keeping the visualization clean and focused.
RSI-Based Signals
Overbought and Oversold Levels:
RSI is used to identify overbought (above 80) and oversold (below 20) conditions.
The script generates buy signals at oversold levels and sell signals at overbought levels.
Chart Indicators:
Arrows and labels appear on the chart to highlight these RSI-based opportunities.
Customization
The script allows users to customize key parameters such as:
Moving average lengths for trend detection.
Take-profit and stop-loss percentages.
Timeframes for backtesting.
Starting capital and commission rates.
Conclusion
This script is a versatile tool for traders, combining trend detection, automated trade management, and visual feedback. It simplifies decision-making by providing clear signals and tracking performance metrics, making it suitable for both beginners and experienced traders.
* The most recently drawn fractals represent potential support and resistance levels. If the price aligns with these levels at the time of entering a trade, it may indicate a likelihood of reversal. In such cases, it’s advisable to either avoid entering the trade altogether or proceed with increased caution.

Advanced Trend Navigator Suite [QuantAlgo]Elevate your investing and trading with Advanced Trend Navigator Suite by QuantAlgo! 💫📈
The Advanced Trend Navigator Suite is a versatile technical indicator designed to empower investors and traders across all experience levels with clear, actionable market insights. Built on the proven Hull Moving Average framework and enhanced with proprietary trend scoring technology, this premium tool offers flexible integration with existing strategies while maintaining effectiveness as a standalone system. By combining reduced-lag HMA mechanics with dynamic state management, it provides investors and traders the ability to identify and capitalize on trending opportunities while maintaining robust protection against market noise. Whether your focus is on position trading, swing trading, or long term investing, the Advanced Trend Navigator Suite adapts to various market conditions and asset classes through its customizable parameters and intuitive visual feedback system.
🏛️ Indicator Architecture
The Advanced Trend Navigator Suite provides a sophisticated framework for assessing market trends through a harmonious blend of HMA dynamics and state-based calculations. Unlike traditional moving average systems that use fixed parameters, this indicator incorporates smart trend scoring measurements to automatically adjust its sensitivity to market conditions. The core algorithm employs an optimized HMA system combined with multi-window trend evaluation, creating a self-adjusting mechanism that adapts based on market momentum. This adaptive approach allows the indicator to maintain its effectiveness across different market phases - from ranging to trending conditions. The trend scoring system acts as dynamic confirmation levels, while the gradient fills between HMA and price provide instant visual feedback on trend direction and strength.
📊 Technical Composition and Calculation
The Advanced Trend Navigator Suite is composed of several technical components that create a dynamic trending system:
Hull Moving Average System: Utilizes weighted calculations for primary trend detection
Trend Score Integration: Computes and evaluates momentum across multiple time windows
Dynamic State Management: Creates adaptive boundaries for trend validation
Gradient Visualization: Provides progressive visual feedback on trend strength
📈 Key Indicators and Features
The Advanced Trend Navigator Suite utilizes customizable length parameters for both HMA and trend calculations to adapt to different investing and trading styles. The trend detection component evaluates price action relative to the dynamic state system to validate signals and identify potential reversals.
The indicator incorporates multi-layered visualization with:
Color-coded HMA lines adapting to trend direction
Dynamic gradient fills between HMA and price
State-based candle coloring system
Clear trend reversal signals (▲/▼)
Precise entry/exit point markers
Programmable alerts for trend changes
⚡️ Practical Applications and Examples
✅ Add the Indicator: Add the indicator to your TradingView chart by clicking on the star icon to add it to your favorites ⭐️
👀 Monitor Trends: Watch the HMA line and gradient fills to identify trend direction and strength. The dynamic color transitions and candle coloring provide immediate visual feedback on market conditions.
🎯 Track Signals: Pay attention to the trend reversal markers that appear on the chart:
→ Long signals (▲) appear when price action confirms a bullish trend reversal
→ Short signals (▼) indicate validated bearish trend reversals
🔔 Set Alerts: Configure alerts for trend changes in both bullish and bearish directions, ensuring you never miss significant technical developments.
🌟 Summary and Tips
The Advanced Trend Navigator Suite by QuantAlgo is a sophisticated technical tool designed to support trend-following strategies across different market environments and asset classes. By combining HMA analysis with dynamic trend scoring, it helps traders and investors identify significant trend changes while filtering out market noise, providing validated signals. The tool's adaptability through customizable HMA lengths, trend scoring, and threshold settings makes it suitable for various trading/investing timeframes and styles, allowing users to capture trending opportunities while maintaining protection against false signals.
Key parameters to optimize for your investing and/or trading style:
HMA Length: Adjust for more or less sensitivity to trend changes
Analysis Period: Fine-tune trend calculations for signal stability
Window Range: Balance between quick signals and stability
Threshold Values: Customize trend validation levels
Visual Settings: Customize appearance with color and display options
The Advanced Trend Navigator Suite by QuantAlgo is particularly effective for:
Identifying sustained market trends
Detecting trend reversals with confirmation
Measuring trend strength and duration
Filtering out market noise and false signals
Remember to:
Allow the indicator to validate trend changes before taking action
Combine with volume and other form of analysis and/or system for additional confirmation
Consider multiple timeframes for a complete market view
Adjust thresholds based on market volatility conditions

Golden & Death Cross with Re-Activation [By Oberlunar]🎄 Merry Christmas to All Traders! 🎄
Let me introduce you to a practical and customizable classic tool: the Golden & Death Cross with Re-Activation. This script is designed to help you navigate the markets with precision and adaptability.
Why Is This Script Important?
1. Customizable Moving Averages
You can choose from SMA, EMA, WMA, HMA, or RMA for both moving averages. This flexibility allows you to tailor the strategy to fit different markets and trading styles.
2. Smart Signal Handling
The script generates Golden Cross (LONG) and Death Cross (SHORT) signals while deactivating them automatically when the moving averages start to converge, avoiding unnecessary noise.
3. Reactivation Based on Distance Threshold
With the treshold parameter, signals are reactivated only when the moving averages move apart sufficiently, ensuring that the signals remain meaningful and not just random market noise.
What Are These Moving Averages?
SMA (Simple Moving Average),
EMA (Exponential Moving Average),
WMA (Weighted Moving Average),
HMA (Hull Moving Average),
RMA (Relative Moving Average)
Community Input
We invite you to test this script on various markets (forex, stocks, crypto) and share your insights:
Which moving average combination works best for EUR/USD?
How about BTC/USD?
Does the treshold make a noticeable difference?
Let us know in the comments!
Example Settings
MA 1 Type: HMA, Length: 21
MA 2 Type: HMA, Length: 200
Reactivation Threshold: 0.5
Experiment with it, and let us know your findings.
Wishing you a calm holiday season and a profitable new year ahead! 🎁
🎄 Merry Christmas and Happy Trading! 🎄

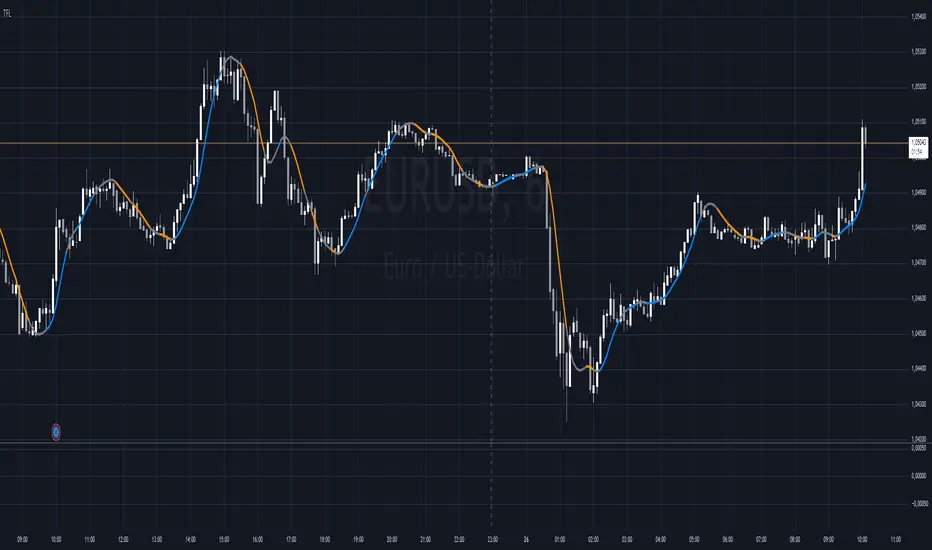
Trend Flow Line (TFL)The Trend Flow Line (TFL) is a versatile moving average indicator that dynamically adjusts to trends using a combination of Hull and Weighted Moving Averages, with optional color coding for bullish and bearish trends.
Introduction
The Trend Flow Line (TFL) is a powerful indicator designed to help traders identify and follow market trends with precision. It combines multiple moving average techniques to create a responsive yet smooth trendline. Whether you're a beginner or an experienced trader, the TFL can enhance your chart analysis by highlighting key price movements and trends.
Detailed Description
The Trend Flow Line (TFL) goes beyond traditional moving averages by leveraging a hybrid approach to calculate trends.
Here's how it works:
.........
Combination of Hull and Weighted Moving Averages
The TFL integrates the Hull Moving Average (HMA), known for its fast responsiveness, and the Double Weighted Moving Average (DWMA), which offers smooth transitions.
The HMA is adjusted dynamically based on the user-defined length, ensuring adaptability to various trading styles and timeframes.
.....
Dynamic Smoothing
The TFL calculates its value by averaging the HMA and DWMA, creating a balanced line that responds to market fluctuations without excessive noise.
This balance makes it ideal for identifying both short-term reversals and long-term trends.
.....
Customizable Features
Timeframe: Analyze the indicator on custom timeframes, independent of the chart's current timeframe.
Color Coding: Optional color settings visually differentiate bullish (uptrend) and bearish (downtrend) phases.
Line Width: Adjust the line thickness to suit your chart preferences.
Color Smoothness: Fine-tune how quickly the color changes to reflect trend shifts, providing a visual cue for potential reversals.
The TFL's algorithm ensures a blend of precision and adaptability, making it suitable for any market or trading strategy.
.........
The Trend Flow Line (TFL) is an essential tool for traders looking to stay ahead of market trends while maintaining a clear and visually intuitive charting experience. It combines HMA and DWMA for trend sensitivity and smoothness.
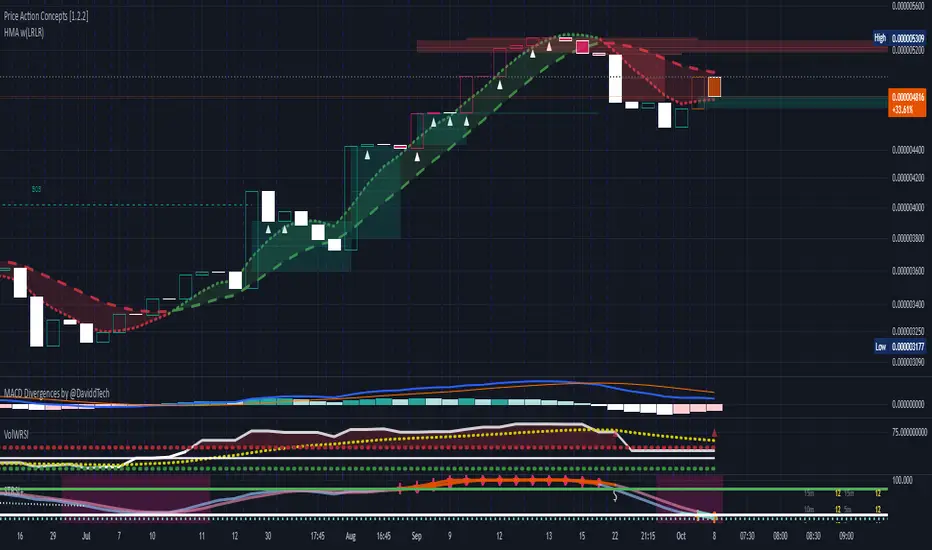
HMA w(LRLR)Description: This script combines a customizable Hull Moving Average (HMA) with a Low Resistance Liquidity Run (LRLR) detection system, ideal for identifying trend direction and potential breakout points in a single overlay.
Features:
Hull Moving Average (HMA):
Select separate calculation sources (open, high, low, close) for short and long periods.
Choose from SMA, EMA, and VWMA for length type on both short and long periods, offering flexible moving average calculations to suit different trading strategies.
Color-coded HMA line that visually changes based on crossover direction, providing an intuitive view of market trends.
Customizable options for line thickness, color transparency, and band fill between HMA short and long lines.
Low Resistance Liquidity Run (LRLR):
Detects breakout signals based on price and volume conditions, identifying potential liquidity run levels.
User-defined length and breakout multiplier control breakout sensitivity and adjust standard deviation-based thresholds.
Color-coded visual markers for bullish and bearish LRLR signals, customizable for user preference.
Alerts for both bullish and bearish LRLR events, keeping users informed of potential trading opportunities.
This script allows traders to visually track the HMA trend direction while also spotting low-resistance liquidity opportunities, all on one chart overlay.
Disclaimer: This tool is intended for educational purposes only and should not be used solely to make trading decisions. Adjust parameters as needed, and consider additional analysis for comprehensive decision-making.
Rolling Reversion BandsRolling Reversion Bands: A Technical Trading Indicator
This indicator helps traders spot potential reversal opportunities by showing where price might be overextended and likely to return to average levels. It combines two powerful technical tools - Volume Weighted Average Price (VWAP) and Hull Moving Average (HMA) smoothing - to create a more reliable signal.
Key Features:
Golden centerline: A smoothed VWAP that filters out market noise
Uses volume-weighted pricing for better accuracy than simple averages
HMA smoothing reduces false signals while staying responsive to real moves
Works like a "fair value" level that price tends to return to
Colored bands:
Turquoise bands (#32f0dd): Show shorter-term price ranges (100 periods)
Pink/red bands (#c2024f): Show longer-term price ranges (200 periods)
Two levels for each color (inner and outer bands)
How to Use It:
When price moves outside the bands, it might be overextended
The golden HMA-smoothed VWAP centerline acts as a target level where price often returns to
Wider bands show higher volatility, narrower bands show lower volatility
You can toggle different bands on/off to keep your chart clean
Customization:
Adjust HMA smoothing to make the centerline more or less responsive
Change how wide you want the bands to be
Turn different bands on or off as needed
The indicator combines advanced technical concepts (VWAP, HMA, volatility bands) in a visually clean way, using smoothing techniques to reduce noise and help identify clearer trading opportunities.

Hma Swing Points | viResearchHma Swing Points | viResearch
Conceptual Foundation and Innovation
The "Hma Swing Points" script introduces a simple yet effective method for identifying key swing points in the market using Hull Moving Averages (HMA). The Hull Moving Average is a faster and smoother alternative to traditional moving averages, making it ideal for detecting significant price swings. By applying HMA to both high and low prices, the script identifies swing highs and lows, providing traders with visual cues for potential trend reversals or continuations. This approach helps traders recognize turning points in the market with minimal lag, allowing for more precise entries and exits.
Technical Composition and Calculation
This script uses two Hull Moving Averages—one for the high prices and another for the low prices. These HMAs offer smoother trend detection while filtering out market noise. The script identifies the highest and lowest HMA values over a user-defined lookback period to determine the swing high and swing low points. Long signals are generated when the current HMA of the highs matches the highest value within the lookback period, while short signals are generated when the HMA of the lows matches the lowest value. These signals are plotted on the chart, and alerts can be set to notify the trader of possible entry or exit points.
Features and User Inputs
The script offers several customizable inputs to adjust its sensitivity and behavior according to the trader’s preferences. The lookback period defines the number of bars used to calculate the highest and lowest HMA values, allowing traders to control how responsive the script is to price changes. The length of the Hull Moving Average can also be modified, giving traders flexibility in smoothing the indicator. Additionally, optional bar color settings provide visual cues, with bullish and bearish trends highlighted. Alerts are included to notify traders when long or short swing points are detected, ensuring they are informed even when not actively monitoring the chart.
Practical Applications
The "Hma Swing Points" script is useful for traders who aim to identify critical market turning points and potential reversals. It is especially effective in trending markets where price swings present trading opportunities. Traders can use the script to detect reversals by spotting swing points that indicate a possible shift from bullish to bearish trends, or vice versa. The script also helps confirm ongoing trends by showing the strength of swings, allowing traders to make informed decisions about entering or exiting trades. Its ability to mark precise swing points enhances trade timing, helping traders optimize their entries and exits.
Advantages and Strategic Value
The script offers a streamlined approach to detecting swing points with the speed and smoothness of the Hull Moving Average. This makes it easier to filter out false signals and noise, improving the accuracy of trend identification. The customizable inputs allow traders to tailor the script for different assets and market conditions, making it versatile for various trading styles. By highlighting key swing points, the script provides traders with clear visual signals for potential reversals and trend confirmations, enhancing their ability to follow and act on market movements.
Summary and Usage Tips
Incorporating the "Hma Swing Points" script into a trading strategy helps traders identify market reversals and continuation points more effectively. Adjusting the lookback period and HMA length ensures the script adapts to different assets and market conditions. The alert system ensures traders don’t miss key swing points. As always, backtesting is important to evaluate the script’s performance under various market conditions, and past results may not guarantee future outcomes.

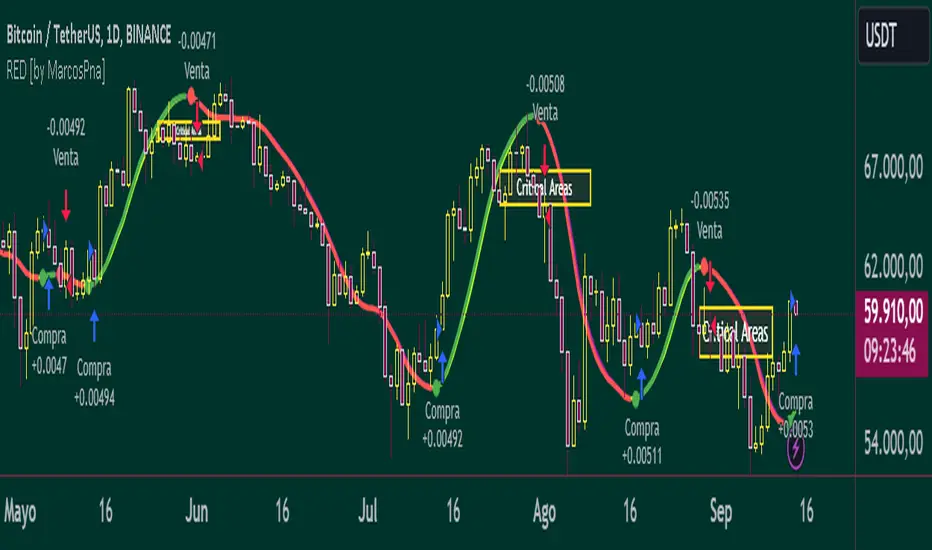
Reflected ema Difference (RED) This script, titled "Reflected EMA Difference (RED)," is based on the logic of evaluating the percentage of convergence and divergence between two moving averages, specifically the Hull Moving Averages (HMA), to make price-related decisions. The Hull Moving Average, created by Alan Hull, is used as the foundation of this strategy, offering a faster and more accurate way to analyze market trends. In this script, the concept is employed to measure and reflect price variations.
Script Functionality Overview:
Hull Moving Averages (HMA): The script utilizes two HMAs, one short-term and one long-term. The main idea is to compute the Delta Difference between these two moving averages, which represents how much they are converging or diverging from each other. This difference is key to identifying potential market trend changes.
Reflected HMA Value: Using the Delta Difference between the HMAs, the value of the short-term HMA is reflected, creating a visual reference point that helps traders see the relationship between price and HMAs on the chart.
Percentage Change Index: The second key parameter is the percentage change index. This determines when a trend is reversing, allowing buy or sell orders to be established based on significant changes in the relationship between the HMAs and the price.
Delta Multiplier: The script comes with a default Delta multiplier of 2 for calculating the difference between HMAs, allowing traders to adjust the sensitivity of the analysis based on the time frame being analyzed.
Trend Reversal Signals: When the price crosses the thresholds defined by the percentage change index, buy or sell signals are triggered, based on the detection of a potential trend reversal.
Visual Cues with Boxes: Boxes are drawn on the chart when the HullMA crosses the reflected HMA value, providing a visual aid to identify critical moments where risk should be evaluated.
Alerts for Receiving Signals:
This script allows you to set up buy and sell alerts via TradingView's alert system. These alerts are triggered when trend changes are detected based on the conditions coded in the script. Traders can receive instant notifications, allowing them to make decisions without needing to constantly monitor the chart.
Additional Considerations:
The percentage change parameter is adjustable and should be configured based on the time frame you are trading on. For longer time frames, it's advisable to use a larger percentage change to avoid false signals.
The use of Hull Moving Averages (HMA) provides a faster and more reactive approach to trend evaluation compared to other moving averages, making it a powerful tool for traders seeking quick reversal signals.
This approach combines the power of Hull Moving Averages with an alert system to improve the trader’s response to trend changes.
Spanish
Este script, titulado "Reflected EMA Difference (RED)", está fundamentado en la lógica de evaluar el porcentaje de acercamiento y distancia entre dos medias móviles, específicamente las medias móviles de Hull (HMA), para tomar decisiones sobre el valor del precio. El creador de la media móvil de Hull, Alan Hull, diseñó este indicador para ofrecer una forma más rápida y precisa de analizar tendencias de mercado, y en este script se utiliza su concepto como base para medir y reflejar las variaciones de precio.
Descripción del funcionamiento:
Medias Móviles de Hull (HMA): Se utilizan dos HMAs, una de corto plazo y otra de largo plazo. La idea principal es calcular la diferencia Delta entre estas dos medias móviles, que representa cuánto se están alejando o acercando entre sí. Esta diferencia es clave para identificar cambios potenciales en la tendencia del mercado.
Valor Reflejado de la HMA: Con la diferencia Delta calculada entre las HMAs, se refleja el valor de la HMA corta, creando un punto de referencia visual que ayuda a los traders a observar la relación entre el precio y las HMAs en el gráfico.
Índice de Cambio de Porcentaje: El segundo parámetro clave del script es el índice de cambio porcentual. Este define el momento en que una tendencia está revirtiendo, permitiendo establecer órdenes de compra o venta en función de un cambio significativo en la relación entre las HMAs y el precio.
Multiplicador Delta: El script tiene un multiplicador predeterminado de 2 para el cálculo de la diferencia Delta, lo que permite ajustar la sensibilidad del análisis según la temporalidad del gráfico.
Señales de Reversión de Tendencia: Cuando el precio cruza los límites definidos por el índice de cambio porcentual, se emiten señales para comprar o vender, basadas en la detección de una posible reversión de tendencia.
Visualización con Cajas: Se dibujan cajas en el gráfico cuando el indicador HullMA cruza el valor reflejado de la HMA, ayudando a identificar visualmente los momentos críticos en los que se debe evaluar el riesgo de las operaciones.
Alertas para Recibir Señales:
Este script permite configurar alertas de compra y venta desde el apartado de alertas de TradingView. Estas alertas se activan cuando se detectan cambios de tendencia en función de las condiciones establecidas en el código. El trader puede recibir notificaciones instantáneas, lo que facilita la toma de decisiones sin necesidad de estar constantemente observando el gráfico.
Consideraciones adicionales:
El porcentaje de cambio es un parámetro ajustable y debe configurarse según la temporalidad que se esté operando. En temporalidades más largas, es recomendable usar un porcentaje de cambio mayor para evitar señales falsas.
La utilización de las medias móviles de Hull (HMA) proporciona un enfoque más rápido y reactivo para evaluar tendencias en comparación con otras medias móviles, lo que lo convierte en una herramienta poderosa para traders que buscan señales rápidas de reversión.
Este enfoque combina la potencia de las medias móviles de Hull con un sistema de alertas que mejora la reactividad a cambios de tendencia.
Hull For Loop | viResearchHull For Loop | viResearch
Conceptual Foundation and Innovation
The "Hull For Loop" indicator brings together the smoothness and responsiveness of the Hull Moving Average (HMA) with a dynamic loop-based scoring system. The HMA is known for its ability to reduce lag while maintaining smooth trend representation, making it a popular choice for traders looking for a responsive and reliable moving average. By incorporating a for loop system that compares current and past HMA values over a user-defined range, the "Hull For Loop" script generates a score that allows traders to detect potential trend changes and assess the strength of ongoing trends. This combination of the HMA and a loop-based evaluation system provides traders with a powerful tool for understanding market momentum and making informed trading decisions.
Technical Composition and Calculation
The "Hull For Loop" script consists of two key elements: the Hull Moving Average (HMA) and the For Loop Scoring System. The HMA is calculated using a weighted moving average (WMA) of the price data, adjusted to reduce lag and provide a smoother trend line. The for loop compares the current HMA to past values over a customizable range, generating a score based on whether the current HMA is higher or lower than previous values.
For the Hull Moving Average, the calculation involves applying a WMA to the source price over the selected length. The result is then used in a secondary WMA calculation to further smooth the output and reduce lag. The For Loop Scoring System evaluates the HMA over a defined range (from and to) by adding or subtracting from the score depending on whether the current HMA is higher or lower than past values. This final score reflects the overall trend strength and direction.
Features and User Inputs
The "Hull For Loop" script offers several customizable inputs, allowing traders to tailor the indicator to their strategies. The Hull Length controls the period over which the HMA is calculated, affecting how quickly the indicator responds to price changes. The Loop Range (From and To) defines the range over which the for loop compares past HMA values, offering flexibility in assessing trend strength over different timeframes. Additionally, customizable thresholds allow traders to define when the score signals an uptrend or downtrend, providing control over the indicator's sensitivity to market conditions.
Practical Applications
The "Hull For Loop" indicator is designed for traders looking to capitalize on the smooth trend representation of the HMA while gaining insights into market momentum through a loop-based scoring system. This tool is particularly effective for identifying trend reversals, as the for loop scoring system provides early signals of potential trend reversals by comparing the current HMA to past values, giving traders an advantage in volatile markets. By analyzing the HMA across a range of past values, the indicator helps confirm whether trends are gaining or losing strength, improving trade entry and exit points. The customizable parameters allow traders to adjust the indicator to different market conditions, making it suitable for both short-term and long-term strategies.
Advantages and Strategic Value
The "Hull For Loop" script provides a significant advantage by combining the smoothness of the HMA with a dynamic scoring system. The HMA's ability to reduce lag while providing a clear trend signal makes it ideal for trend-following strategies, while the loop-based scoring system adds a layer of analysis that helps reduce false signals. This combination results in a reliable tool for identifying and confirming trends, allowing traders to adapt more effectively to changing market conditions.
Alerts and Visual Cues
The script includes alert conditions to notify traders of key trend changes. The "Hull For Loop Long" alert is triggered when the score crosses the upper threshold, signaling a potential upward trend. Conversely, the "Hull For Loop Short" alert signals a possible downward trend when the score crosses below the lower threshold. Visual cues, such as changes in the background color, highlight these trend shifts on the chart, helping traders quickly identify potential market reversals.
Summary and Usage Tips
The "Hull For Loop | viResearch" indicator offers traders a robust tool for trend analysis by combining the benefits of the Hull Moving Average with a dynamic loop-based scoring system. By incorporating this script into your trading strategy, you can improve your ability to detect and confirm trends with greater accuracy, reducing the impact of market noise. Whether you are focused on identifying early trend reversals or confirming ongoing trends, the "Hull For Loop" provides a reliable and customizable solution for traders of all levels.
Note: Backtests are based on past results and are not indicative of future performance.

HMA Smoothed RSI [Pinescriptlabs]This indicator uses a modified version of the RSI (Relative Strength Index) weighted by volume. This means it not only takes into account the price but also the amount of volume supporting those price movements, making the indicator more sensitive to real market fluctuations.
Hull Moving Average (HMA) Applied to RSI: To smooth the volume-weighted RSI, a Hull Moving Average (HMA) is applied. The HMA is known for its ability to reduce market "noise" and quickly react to trend changes. This process helps better identify when an asset is overbought or oversold.
Overbought and Oversold Regions: The indicator sets clear overbought and oversold levels, which are adjustable. By default, the overbought level is set at 20 and the oversold level at -20, but you can customize these values. Additionally, there are extreme overbought and oversold levels to help identify more extreme market conditions where a price reversal is more likely.
Buy and Sell Signals:
Buy Signal: This is generated when the modified RSI crosses above the oversold level. This indicates that the price has dropped enough and may be about to rise.
Sell Signal: This occurs when the RSI crosses below the overbought level. This suggests that the price has risen too much and could be about to fall.
Dynamic Visualization and Colors: The indicator is displayed with different colors based on its behavior:
When the RSI is within normal levels, the color is neutral.
If it is above the overbought level, the color turns red (sell alert).
If it is below the oversold level, the color turns green (buy alert).
Alerts: This indicator also allows you to set up alerts. You will receive automatic notifications when buy or sell signals are generated, helping you make decisions without constantly monitoring the chart.
Español:
Este indicador utiliza una versión modificada del RSI (Índice de Fuerza Relativa), ponderado por volumen. Esto significa que no solo tiene en cuenta el precio, sino también la cantidad de volumen que respalda esos movimientos de precios, haciendo que el indicador sea más sensible a las fluctuaciones reales del mercado.
Media Móvil Hull (HMA) aplicada al RSI: Para suavizar el RSI ponderado por volumen, se le aplica una Media Móvil Hull (HMA). La HMA es conocida por su capacidad para reducir el "ruido" del mercado y reaccionar rápidamente a los cambios de tendencia. Este proceso ayuda a identificar mejor cuándo un activo está sobrecomprado o sobrevendido.
Regiones de sobrecompra y sobreventa: El indicador establece niveles claros de sobrecompra y sobreventa que son ajustables. Por defecto, el nivel de sobrecompra está en 20 y el de sobreventa en -20, pero puedes personalizar estos valores. Además, hay niveles extremos de sobrecompra y sobreventa que te ayudan a identificar condiciones más extremas del mercado, donde una reversión de precio es más probable.
Señales de compra y venta:
Señal de compra: Se genera cuando el RSI modificado cruza hacia arriba el nivel de sobreventa. Esto indica que el precio ha bajado lo suficiente y puede estar a punto de subir.
Señal de venta: Se produce cuando el RSI cruza hacia abajo el nivel de sobrecompra. Esto indica que el precio ha subido demasiado y podría estar a punto de bajar.
Visualización y colores dinámicos: El indicador se muestra con diferentes colores según su comportamiento:
Cuando el RSI está dentro de los niveles normales, el color es neutro.
Si está por encima del nivel de sobrecompra, el color se vuelve rojo (señal de alerta de venta).
Si está por debajo del nivel de sobreventa, el color se vuelve verde (señal de alerta de compra).
Alertas: Este indicador también te permite configurar alertas. Así, recibirás notificaciones automáticas cuando se generen señales de compra o venta, ayudándote a tomar decisiones sin estar constantemente monitoreando el gráfico.

HMA Z-Score Probability Indicator by Erika BarkerThis indicator is a modified version of SteverSteves's original work, enhanced by Erika Barker. It visually represents asset price movements in terms of standard deviations from a Hull Moving Average (HMA), commonly known as a Z-Score.
Key Features:
Z-Score Calculation: Measures how many standard deviations the current price is from its HMA.
Hull Moving Average (HMA): This moving average provides a more responsive baseline for Z-Score calculations.
Flexible Display: Offers both area and candlestick visualization options for the Z-Score.
Probability Zones: Color-coded areas showing the statistical likelihood of prices based on their Z-Score.
Dynamic Price Level Labels: Displays actual price levels corresponding to Z-Score values.
Z-Table: An optional table showing the probability of occurrence for different Z-Score ranges.
Standard Deviation Lines: Horizontal lines at each standard deviation level for easy reference.
How It Works:
The indicator calculates the Z-Score by comparing the current price to its HMA and dividing by the standard deviation. This Z-Score is then plotted on a separate pane below the main chart.
Green areas/candles: Indicate prices above the HMA (positive Z-Score)
Red areas/candles: Indicate prices below the HMA (negative Z-Score)
Color-coded zones:
Green: Within 1 standard deviation (high probability)
Yellow: Between 1 and 2 standard deviations (medium probability)
Red: Beyond 2 standard deviations (low probability)
The HMA line (white) shows the trend of the Z-Score itself, offering insight into whether the asset is becoming more or less volatile over time.
Customization Options:
Adjust lookback periods for Z-Score and HMA calculations
Toggle between area and candlestick display
Show/hide probability fills, Z-Table, HMA line, and standard deviation bands
Customize text color and decimal rounding for price levels
Interpretation:
This indicator helps traders identify potential overbought or oversold conditions based on statistical probabilities. Extreme Z-Score values (beyond ±2 or ±3) often suggest a higher likelihood of mean reversion, while consistent Z-Scores in one direction may indicate a strong trend.
By combining the Z-Score with the HMA and probability zones, traders can gain a nuanced understanding of price movements relative to recent trends and their statistical significance.

Composite Z-Score with Linear Regression Bands [UAlgo]The Composite Z-Score with Linear Regression Bands is a technical indicator designed to provide traders with a comprehensive analysis of price momentum, volatility, and volume. By combining multiple moving averages with slope analysis, volume/volatility compression-expansion metrics, and Z-Score calculations, this indicator aims to highlight potential breakout and breakdown points with high accuracy. The inclusion of linear regression bands further enhances the analysis by providing dynamic support and resistance levels, which adapt to market conditions. This makes the indicator particularly useful in identifying overbought/oversold conditions, volume squeezes, and the overall direction of the trend.
🔶 Key Features
Multi-Length Slope Calculation: The indicator uses multiple Hull Moving Averages (HMA) across various lengths to calculate slope angles, which are then converted into Z-Scores. This helps in capturing both short-term and long-term price momentum.
Volume/Volatility Composite Analysis: By calculating a composite value derived from both volume and volatility, the indicator identifies periods of compression (squeezes) and expansion, which are crucial for detecting potential breakout opportunities.
Linear Regression Bands: The inclusion of dynamic linear regression bands provides traders with adaptive support and resistance levels. These bands are enhanced by the composite value, which adjusts the band width based on market conditions, offering a clearer view of possible price reversals.
Overbought/Oversold Detection: The indicator highlights overbought and oversold conditions by comparing Z-Scores against the upper and lower bounds of the regression bands, which can signal potential reversal points.
Customizable Inputs: Users can customize key parameters such as the lengths of the moving averages, the regression band period, and the number of deviations used for the bands, allowing for flexibility in adapting the indicator to different market environments.
🔶 Interpreting the Indicator
Z-Score Plots: The individual Z-Score plots represent the normalized slope of the Hull Moving Averages over different periods. Positive values indicate upward momentum, while negative values suggest downward momentum. The combined Z-Sum provides a broader view of the overall market momentum.
Composite Value: The composite value is a ratio of volume to volatility, which highlights periods of market compression and expansion. When the composite value rises, it suggests increasing market activity, often preceding a breakout.
Why are we calculating values for multiple lengths?
The Composite Z-Score with Linear Regression Bands indicator employs a multi-timeframe analysis by calculating Z-scores for various moving average lengths. This approach provides a more comprehensive view of market dynamics and helps to identify trends and potential reversals across different timeframes. By considering multiple lengths, we can:
Capture a broader range of market behaviors: Different moving average lengths capture different aspects of price movement. Shorter lengths are more sensitive to recent price changes, while longer lengths provide a smoother representation of the underlying trend.
Reduce the impact of noise: By combining Z-scores from multiple lengths, we can help to filter out some of the noise that can be present in shorter-term data and obtain a more robust signal.
Enhance the reliability of signals: When Z-scores from multiple lengths align, it can increase the confidence in the identified trend or potential reversal. This can help to reduce the likelihood of false signals.
In essence, calculating values for multiple lengths allows the indicator to provide a more nuanced and reliable assessment of market conditions, making it a valuable tool for traders and analysts.
Linear Regression Bands: The central line represents the linear regression of the Z-Sum, while the upper and lower bands represent the dynamic resistance and support levels, respectively. The deviation from the regression line indicates the strength of the current trend. When price moves beyond these bands, it may signal an overbought (above upper band) or oversold (below lower band) condition.
Volume/Volatility Squeeze: When the price moves between the regression bands and the volume/volatility-adjusted bands, the market is in a squeeze. Breakouts from this squeeze can lead to significant price moves, which are indicated by the filling of areas between the Z-Score plots and the bands.
Color Interpretation: The indicator uses color changes to make it easier to interpret the data. Teal colors generally indicate upward momentum or strong conditions, while red suggests downward momentum or weakening conditions. The intensity of the color reflects the strength of the signal.
Overbought/Oversold Signals: The indicator marks potential overbought and oversold conditions when Z-Scores cross above or below the upper and lower regression bands, respectively. These signals are crucial for identifying potential reversal points in the market.
🔶 Disclaimer
Use with Caution: This indicator is provided for educational and informational purposes only and should not be considered as financial advice. Users should exercise caution and perform their own analysis before making trading decisions based on the indicator's signals.
Not Financial Advice: The information provided by this indicator does not constitute financial advice, and the creator (UAlgo) shall not be held responsible for any trading losses incurred as a result of using this indicator.
Backtesting Recommended: Traders are encouraged to backtest the indicator thoroughly on historical data before using it in live trading to assess its performance and suitability for their trading strategies.
Risk Management: Trading involves inherent risks, and users should implement proper risk management strategies, including but not limited to stop-loss orders and position sizing, to mitigate potential losses.
No Guarantees: The accuracy and reliability of the indicator's signals cannot be guaranteed, as they are based on historical price data and past performance may not be indicative of future results.
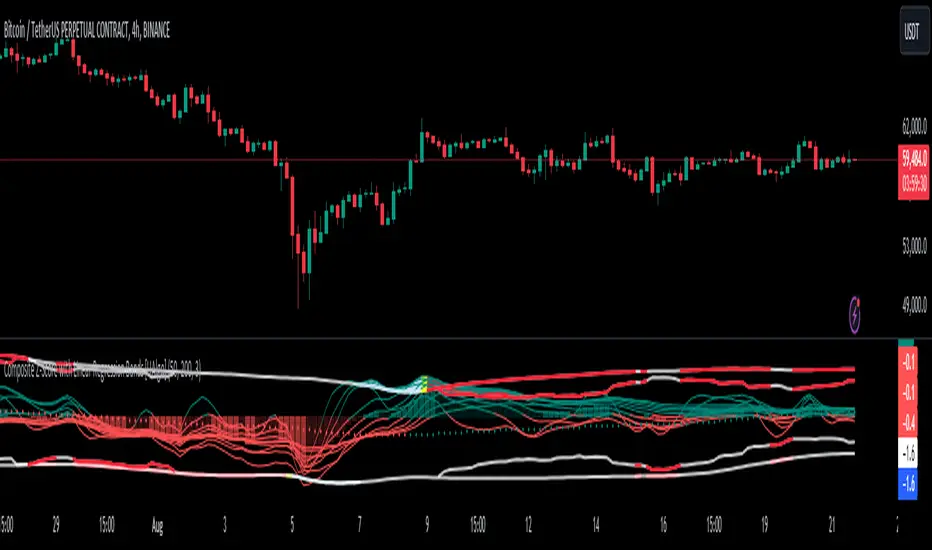
Double CCI Confirmed Hull Moving Average Reversal StrategyOverview
The Double CCI Confirmed Hull Moving Average Strategy utilizes hull moving average (HMA) in conjunction with two commodity channel index (CCI) indicators: the slow and fast to increase the probability of entering when the short and mid-term uptrend confirmed. The main idea is to wait until the price breaks the HMA while both CCI are showing that the uptrend has likely been already started. Moreover, strategy uses exponential moving average (EMA) to trail the price when it reaches the specific level. The strategy opens only long trades.
Unique Features
Dynamic stop-loss system: Instead of fixed stop-loss level strategy utilizes average true range (ATR) multiplied by user given number subtracted from the position entry price as a dynamic stop loss level.
Configurable Trading Periods: Users can tailor the strategy to specific market windows, adapting to different market conditions.
Double trade setup confirmation: Strategy utilizes two different period CCI indicators to confirm the breakouts of HMA.
Trailing take profit level: After reaching the trailing profit activation level scrip activate the trailing of long trade using EMA. More information in methodology.
Methodology
The strategy opens long trade when the following price met the conditions:
Short-term period CCI indicator shall be above 0.
Long-term period CCI indicator shall be above 0.
Price shall cross the HMA and candle close above it with the same candle
When long trade is executed, strategy set the stop-loss level at the price ATR multiplied by user-given value below the entry price. This level is recalculated on every next candle close, adjusting to the current market volatility.
At the same time strategy set up the trailing stop validation level. When the price crosses the level equals entry price plus ATR multiplied by user-given value script starts to trail the price with EMA. If price closes below EMA long trade is closed. When the trailing starts, script prints the label “Trailing Activated”.
Strategy settings
In the inputs window user can setup the following strategy settings:
ATR Stop Loss (by default = 1.75)
ATR Trailing Profit Activation Level (by default = 2.25)
CCI Fast Length (by default = 25, used for calculation short term period CCI
CCI Slow Length (by default = 50, used for calculation long term period CCI)
Hull MA Length (by default = 34, period of HMA, which shall be broken to open trade)
Trailing EMA Length (by default = 20)
User can choose the optimal parameters during backtesting on certain price chart.
Justification of Methodology
Before understanding why this particular combination of indicator has been chosen let's briefly explain what is CCI and HMA.
The Commodity Channel Index (CCI) is a momentum-based technical indicator used in trading to measure a security's price relative to its average price over a given period. Developed by Donald Lambert in 1980, the CCI is primarily used to identify cyclical trends in a security, helping traders to spot potential buying or selling opportunities.
The CCI formula is:
CCI = (Typical Price − SMA) / (0.015 × Mean Deviation)
Typical Price (TP): This is calculated as the average of the high, low, and closing prices for the period.
Simple Moving Average (SMA): This is the average of the Typical Prices over a specific number of periods.
Mean Deviation: This is the average of the absolute differences between the Typical Price and the SMA.
The result is a value that typically fluctuates between +100 and -100, though it is not bounded and can go higher or lower depending on the price movement.
The Hull Moving Average (HMA) is a type of moving average that was developed by Alan Hull to improve upon the traditional moving averages by reducing lag while maintaining smoothness. The goal of the HMA is to create an indicator that is both quick to respond to price changes and less prone to whipsaws (false signals).
How the Hull Moving Average is Calculated?
The Hull Moving Average is calculated using the following steps:
Weighted Moving Average (WMA): The HMA starts by calculating the Weighted Moving Average (WMA) of the price data over a period square root of n (sqrt(n))
Speed Adjustment: A WMA is then calculated for half of the period n/2, and this is multiplied by 2 to give more weight to recent prices.
Lag Reduction: The WMA of the full period n is subtracted from the doubled n/2 WMA.
Final Smoothing: To smooth the result and reduce noise, a WMA is calculated for the square root of the period n.
The formula can be represented as:
HMA(n) = WMA(WMA(n/2) × 2 − WMA(n), sqrt(n))
The Weighted Moving Average (WMA) is a type of moving average that gives more weight to recent data points, making it more responsive to recent price changes than a Simple Moving Average (SMA). In a WMA, each data point within the selected period is multiplied by a weight, with the most recent data receiving the highest weight. The sum of these weighted values is then divided by the sum of the weights to produce the WMA.
This strategy leverages HMA of user given period as a critical level which shall be broken to say that probability of trend change to the upside increased. HMA reacts faster than EMA or SMA to the price change, that’s why it increases chances to enter new trade earlier. Long-term period CCI helps to have an approximation of mid-term trend. If it’s above 0 the probability of uptrend increases. Short-period CCI allows to have an approximation of short-term trend reversal from down to uptrend. This approach increases chances to have a long trade setup in the direction of mid-term trend when the short-term trend starts to reverse.
ATR is used to adjust the strategy risk management to the current market volatility. If volatility is low, we don’t need the large stop loss to understand the there is a high probability that we made a mistake opening the trade. User can setup the settings ATR Stop Loss and ATR Trailing Profit Activation Level to realize his own risk to reward preferences, but the unique feature of a strategy is that after reaching trailing profit activation level strategy is trying to follow the trend until it is likely to be finished instead of using fixed risk management settings. It allows sometimes to be involved in the large movements. It’s also important to make a note, that script uses HMA to enter the trade, but for trailing it leverages EMA. It’s used because EMA has no such fast reaction to price move which increases probability not to be stopped out from any significant uptrend move.
Backtest Results
Operating window: Date range of backtests is 2022.07.01 - 2024.08.01. It is chosen to let the strategy to close all opened positions.
Commission and Slippage: Includes a standard Binance commission of 0.1% and accounts for possible slippage over 5 ticks.
Initial capital: 10000 USDT
Percent of capital used in every trade: 100%
Maximum Single Position Loss: -4.67%
Maximum Single Profit: +19.66%
Net Profit: +14897.94 USDT (+148.98%)
Total Trades: 104 (36.54% win rate)
Profit Factor: 2.312
Maximum Accumulated Loss: 1302.66 USDT (-9.58%)
Average Profit per Trade: 143.25 USDT (+0.96%)
Average Trade Duration: 34 hours
These results are obtained with realistic parameters representing trading conditions observed at major exchanges such as Binance and with realistic trading portfolio usage parameters.
How to Use
Add the script to favorites for easy access.
Apply to the desired timeframe and chart (optimal performance observed on 2h BTC/USDT).
Configure settings using the dropdown choice list in the built-in menu.
Set up alerts to automate strategy positions through web hook with the text: {{strategy.order.alert_message}}
Disclaimer:
Educational and informational tool reflecting Skyrex commitment to informed trading. Past performance does not guarantee future results. Test strategies in a simulated environment before live implementation

Normalized Hull Moving Average Oscillator w/ ConfigurationsThis indicator uniquely uses normalization techniques applied to the Hull Moving Average (HMA) and allows the user to choose between a number of different types of normalization, each with their own advantages. This indicator is one in a series of experiments I've been working on in looking at different methods of transforming data. In particular, this is a more usable example of the power of data transformation, as it takes the Hull Moving Average of Alan Hull and turns it into a powerful oscillating indicator.
The indicator offers multiple types of normalization, each with its own set of benefits and drawbacks. My personal favorites are the Mean Normalization , which turns the data series into one centered around 0, and the Quantile Transformation , which converts the data into a data set that is normally distributed.
I've also included the option of showing the mean, median, and mode of the data over the period specified by the length of normalization. Using this will allow you to gather additional insights into how these transformations affect the distribution of the data series.
Types of Normalization:
1. Z-Score
Overview: Standardizes the data by subtracting the mean and dividing by the standard deviation.
Benefits: Centers the data around 0 with a standard deviation of 1, reducing the impact of outliers.
Disadvantages: Works best on data that is normally distributed
Notes: Best used with a mid-longer length of transformation.
2. Min-Max
Overview: Scales the data to fit within a specified range, typically 0 to 1.
Benefits: Simple and fast to compute, preserves the relationships among data points.
Disadvantages: Sensitive to outliers, which can skew the normalization.
Notes: Best used with mid-longer length of transformation.
3. Mean Normalization
Overview: Subtracts the mean and divides by the range (max - min).
Benefits: Centers data around 0, making it easier to compare different datasets.
Disadvantages: Can be affected by outliers, which influence the range.
Notes: Best used with a mid-longer length of transformation.
4. Max Abs Scaler
Overview: Scales each feature by its maximum absolute value.
Benefits: Retains sparsity and is robust to large outliers.
Disadvantages: Only shifts data to the range , which might not always be desirable.
Notes: Best used with a mid-longer length of transformation.
5. Robust Scaler
Overview: Uses the median and the interquartile range for scaling.
Benefits: Robust to outliers, does not shift data as much as other methods.
Disadvantages: May not perform well with small datasets.
Notes: Best used with a longer length of transformation.
6. Feature Scaling to Unit Norm
Overview: Scales data such that the norm (magnitude) of each feature is 1.
Benefits: Useful for models that rely on the magnitude of feature vectors.
Disadvantages: Sensitive to outliers, which can disproportionately affect the norm. Not normally used in this context, though it provides some interesting transformations.
Notes: Best used with a shorter length of transformation.
7. Logistic Function
Overview: Applies the logistic function to squash data into the range .
Benefits: Smoothly compresses extreme values, handling skewed distributions well.
Disadvantages: May not preserve the relative distances between data points as effectively.
Notes: Best used with a shorter length of transformation. This feature is actually two layered, we first put it through the mean normalization to ensure that it's generally centered around 0.
8. Quantile Transformation
Overview: Maps data to a uniform or normal distribution using quantiles.
Benefits: Makes data follow a specified distribution, useful for non-linear scaling.
Disadvantages: Can distort relationships between features, computationally expensive.
Notes: Best used with a very long length of transformation.
Conclusion
This indicator is a powerful example into how normalization can alter and improve the usability of a data series. Each method offers unique insights and benefits, making this indicator a useful tool for any trader. Try it out, and don't hesitate to reach out if you notice any glaring flaws in the script, room for improvement, or if you just have questions.
