Trend Slope Meter - KaspricciTrend Slope Meter
This indicator measures the slope of the trend defined by a moving average or an external source. The slope is calculated by the change of price in ticks for a defined number of bars divided by the number of bars.
Settings
Source - Default: close price. Used to calculate the moving average as basis for slope measurement. Can be an external source of a different indicator as well. In case you select an external source, you can disable the moving average calculation.
Moving Average Settings
Type - Default: EMA. Type of moving average calculation. All provided out of the box by TradingView.
Length - Default: 50. Length used to calculate moving average.
Slope Settings
Length - Default: 50. Length used to calculate slope.
HMA

HMA Slope OscillatorA Hull Moving Average (HMA) slope oscillator. It uses a HMA slope to identify up/down trends. Usage is simple: adjust the HMA and signal length according to your needs. Long orders start when the bar changes from under (the zero line) to over the zero line. You can also spot "early" long entries when the bar moves close to the zero line. Short orders should be placed when a red bar appears after blue bars (top of the mountain).
"Play" with the length to find the best settings for your trading strategy.
** I have not added alerts. If you need alerts just let me know and I will be happy to update this indicator.

SUPER MULTI MOVING AVERAGE [Gabbo]📈 Moving Average Indicator Update - Version 2
🔹 New Features and Improvements:
1️⃣ Enhanced MA Selection for Table Lines:
Previously, the indicator did not allow users to choose a different Moving Average type for the table lines. Now, you can select the MA type for the table.
2️⃣ New Table Text Customization Inputs:
Added inputs to choose the table text color and size for a more personalized display.
3️⃣ Improved Input Visibility and Organization:
We’ve reorganized the inputs so that the most commonly used options are now placed at the beginning for quicker and more convenient configuration.
4️⃣ Bug Fixes and Code Improvements:
Minor bugs have been fixed, and the code has been optimized for improved stability and performance. The code is now cleaner and fully functional in version 6.
5️⃣ Cometreon Public Library Integration:
To lighten the code and improve modularity, we’ve integrated the Cometreon public library. This makes the code more efficient and reduces the need to duplicate common functions.
☄️ With this update, the Moving Average indicator becomes even more versatile and user-friendly, offering a refined table interface and enhanced customization options!

Hull Butterfly Oscillator [LuxAlgo]The Hull Butterfly Oscillator (HBO) is an oscillator constructed from the difference between a regular Hull Moving Average (HMA) and another with coefficients flipped horizontally.
Levels are obtained from cumulative means of the absolute value of the oscillator. These are used to return dots indicating potential reversal points.
Settings
Length: Number of past price inputs processed by the oscillator.
Levels Multiplier: Determine how far the levels are from 0.
Src: Input source of the indicator.
Usage
The oscillator can be used like most available oscillators. The sign of the HBO allows determining the current trend direction, while divergences with price might indicate potential reversals.
The displayed levels can additionally indicate whether the market is overbought or oversold. When the direction of the oscillator changes while being above the upper or lower level a red dot (if above upper level) or green dot (if under lower level) will be displayed, indicating a potential reversal.
Details
The name of the indicator is directly derived behind the coefficients used for its calculation. Displaying regular Hull coefficients alongside those flipped horizontally slightly resemble a butterfly, the difference between these sets of coefficients allows obtaining the HBO.
This operation allows to obtain a more structured impulse response, potentially giving less undesired performances on the frequency domain compared to simpler operation involving subtracting the HMA to a SMA, EMA or WMA.

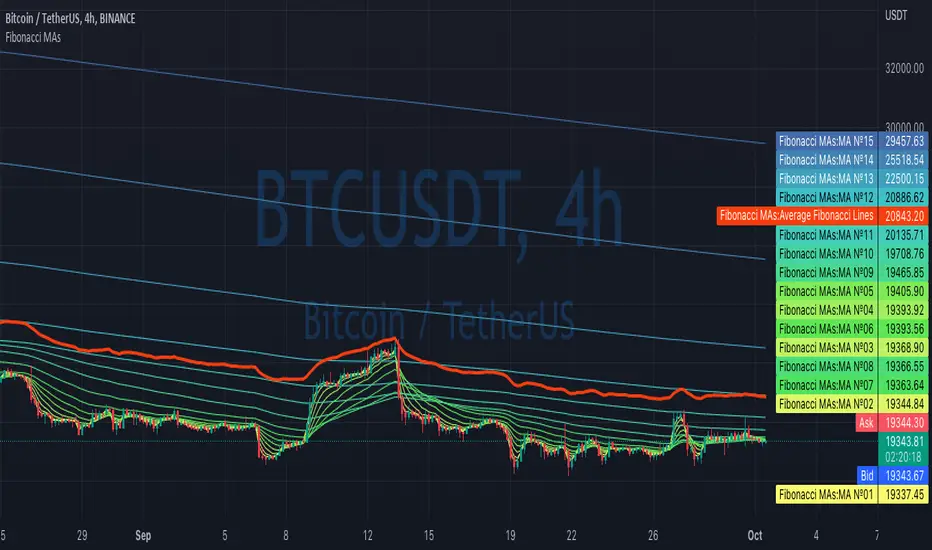
Fibonacci MAsIt's a pretty simple script. Idea is to compute MAs with the length of Fibonacci numbers and then compute an average of them all.
In the script, you can choose the type of MAs and how many Fibonacci numbers to use for it.
You can also adjust the length of these MAs manually and choose the color of every one of them.
Thanks to @MUQWISHI for helping me code it.
Disclaimer
Please remember that past performance may not be indicative of future results.
Due to various factors, including changing market conditions, the strategy may no longer perform as well as in historical backtesting.
This post and the script don’t provide any financial advice.
NSDT MA+ADXThis script combines Moving Averages with ADX Strength, but with an added bonus. Rather than having the Moving Average line always plot on the chart, it will reference the ADX strength based on the settings by the trader.
This way, the Moving Average will not show on the chart unless there is also a strong direction in the trend. This may potentially be used to help with entries when trend trading due to adding the ADX for trend strength.
In the examples below, the ADX settings in the MA+ADX indicator are matched with the settings of a standalone ADX indicator at the bottom of the chart (not included, just for reference).
MA+ADX
prnt.sc
ADX Only
prnt.sc
You will see how the MA only plots when the ADX is over the threshold, currently set at 25. (arrows drawn to indicate confluence)

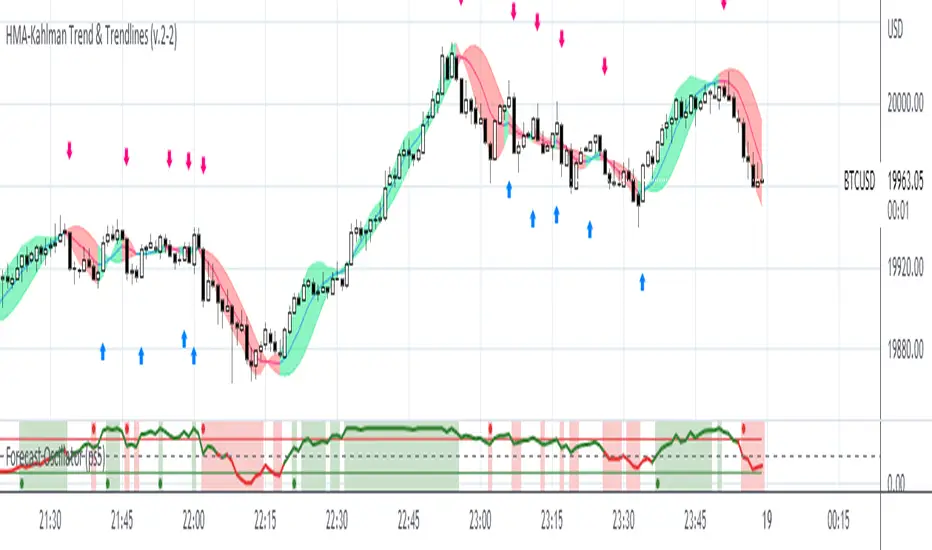
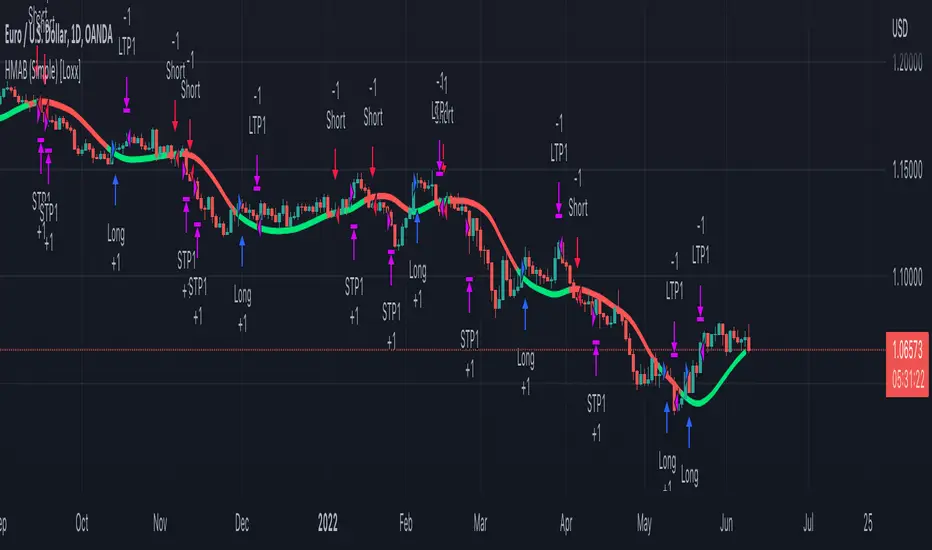
HMA-Kahlman Trend & Trendlines (v.2)This is an upgrade to the HMA-Kahlman Trend & Trendlines script ().
This version gives more flexibility because you can play around with 2 parameters to Kalman function (Sharpness and K (aka. step size)).
HMA Slope Variation [Loxx]HMA Slope Variation is an indicator that uses HMA moving average to calculate a slope that is then weighted to derive a signal.
The center line
The center line changes color depending on the value of the:
Slope
Signal line
Threshold
If the value is above a signal line (it is not visible on the chart) and the threshold is greater than the required, then the main trend becomes up. And reversed for the trend down.
Colors and style of the histogram
The colors and style of the histogram will be drawn if the value is at the right side, if the above described trend "agrees" with the value (above is green or below zero is red) and if the High is higher than the previous High or Low is lower than the previous low, then the according type of histogram is drawn.
What is the Hull Moving Average?
The Hull Moving Average ( HMA ) attempts to minimize the lag of a traditional moving average while retaining the smoothness of the moving average line. Developed by Alan Hull in 2005, this indicator makes use of weighted moving averages to prioritize more recent values and greatly reduce lag.
Included
Alets
Signals
Bar coloring
Loxx's Expanded Source Types

Multi HMA Slopes [Loxx]Multi HMA Slopes is an indicator that checks slopes of 5 (different period) Hull Moving Averages and adds them up to show overall trend. To us this, check for color changes from red to green where there is no red if green is larger than red and there is no red when red is larger than green. When red and green both show up, its a sign of chop.
What is the Hull Moving Average?
The Hull Moving Average (HMA) attempts to minimize the lag of a traditional moving average while retaining the smoothness of the moving average line. Developed by Alan Hull in 2005, this indicator makes use of weighted moving averages to prioritize more recent values and greatly reduce lag.
Included
Signals: long, short, continuation long, continuation short.
Alerts
Bar coloring
Loxx's expanded source types
RSI TrendRSI Hull Trend is a hybrid indicator with RSI of HULL Signal. The Hull MA is combined with RSI to see if the Hull MA Buy/Sell Signal is in overbought or oversold condition. Buy Sell Signals are plotted based on settings of OB/OS or RSI. This indicator is very useful to see if the Trend is in Exhaustion or Beginning of a Trend. Entry and Exit conditions can be more precise based on OB/OS condition of price action. In addition normal RSI trend is plotted with trend color from Hull MA. Best Performance with Heiken Ashi Candles.
OB/OS Settings provided
Hull Buy/Sell Signals plotted
Double RSI FAST and DEFAULT signal with crossover
Bar Color applied based on Hull RSI Trend
Hull Trend + RSI + Price Action

MTF EMA Ribbon & Bands + BBMulti Timeframe Exponential Moving Average Ribbon & Bands + Boillinger Bands
I used the script "EMA Ribbon - low clutter, configurable " by adam24x, I made some color change and I added a few indicators (Boillinger Bands, EMA on multi timeframe and EMA bands from "34 EMA Bands " by VishvaP).
The script can display various EMA from the chart's timeframe but also EMA from other timeframes.
Bollinger Bands and EMA bands can also be added to the chart.

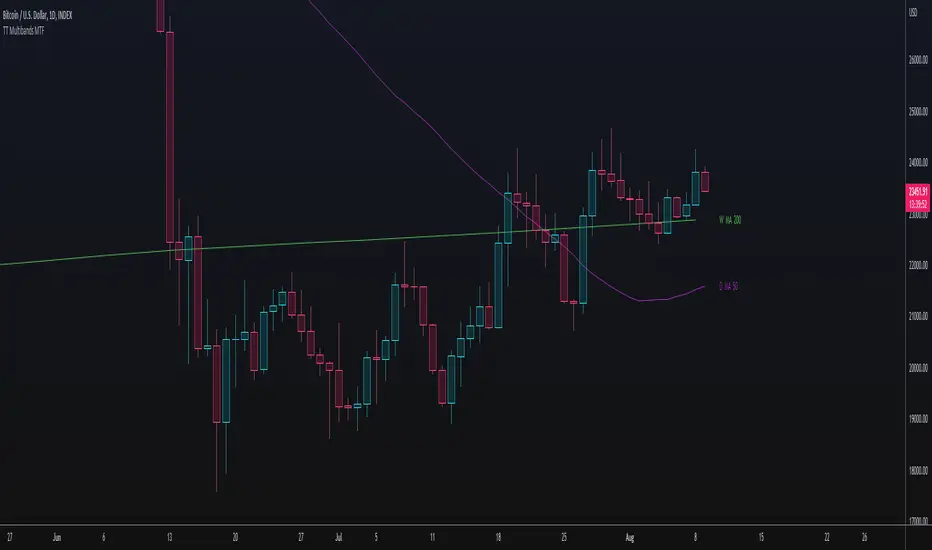
TT Multibands MTFThis Multi Moving Average Indicator is for a long list of Moving Averages:
- Simple Moving Average (SMA)
- Exponential Moving Average (EMA)
- Weighted Moving Average (WMA)
- Hull Moving Average (HMA)
- Double Exponential Moving Average (DEMA)
- Triple Exponential Moving Average (TEMA)
- Volume Weighted Moving Average (VWMA)
- Kaufman's Adaptive Moving Average (KAMA)
- Relative Moving Average (RMA)
- Arnaud Legoux’s Moving Average (ALMA)
Advantages:
- Auto Plotting the Lable: < TIMEFRAME + BAND TYPE + LENGTH >
- Multi TimeFrame (MTF)
- Usable with Custom Time Frames: You can choose any Time Frame out of your Custom Time Frame List
- "No Repainting"
- "No Gaps" on lower Chart Time Frames (HD, no "Stairs")
"No Repainting" and "No Gaps" TRUE
"No Gaps" FALSE
Day Trade Indicator [by KN Lo]Design for LONG and Day Trade only
=============================
features (this indicator is able to):
- show EMA 9, 50, 200 & VWAP
- show Candle Pattern (e.g. Engulfing, Shooting Star)
- show HMA fast(10) / slow(50) lines
- show Breakout Signal (Blue triangle)
- show RSI Divergence
- find Volitility Decreasing
- find Consolidation stage
- change Background color (green) when positive figures
- show indicator table
=============================
indicator table:
- Price over VWAP
- Price over EMA200
- EMA9 > EMA50 > EMA200
- RSI < 80
- EMA9 > VWAP
- MACD fast > slow
- HMA fast > slow
- RSI Divergence (compare with previous higher high)
- Breakout Signal when the price is higher than previous high
- Volitility: the difference between previous high (9 periods) and previous low (9 periods), average by SMA, if lower than -30, show in green color.
- Consolidation: consider previous 7 periods to find consolidation stage.

Hull Weighted Exponential Moving AverageBINANCE:BTCUSDT
Open source version of the Hull Weighted Exponential Moving Average as described by Vincent Charles in [ Hull-WEMA: A Novel Zero-Lag Approach in the Moving Average Family ]
█ OVERVIEW
The study takes into considerations two variants of MA.
Namely:
Weighted Exponential Moving Average (WEMA)
Hull Moving Average (HMA)
WEMA, which was introduced in 2013, has been widely used in different scenarios but still suffers from lags.
To address this shortcoming, a novel zero-lag Hull-WEMA method is proposed that combines HMA and WEMA.
Results show that the new approach achieves a better accuracy level than both HMA and WEMA.
█ SIGNALS
The indicator generates:
a LONG signal when switching color from RED to GREEN
a SHORT signal when switching color from GREEN to RED
Additionally is available an option to color the candles on your chart to confirm the signals and filter ranges.

pickle financialversion 1.0
A multi-use indicator
FEATURES:
1) Robust VWAP with up to 3 deviations that can be adjusted for Session, Week, Month, Quarter, Year, Decade, Century, Earnings , Dividend, & Split intervals
2) 20 customizable Moving Averages that can be changed to EMAs, SMAs , WMAs, SMMAs, and VWMAs; can also be adjusted to Candle Closes, Highs, Lows, Opens, HLC3, HL2 , OHLC4, & HLCC4
-Praise be lady VWAP

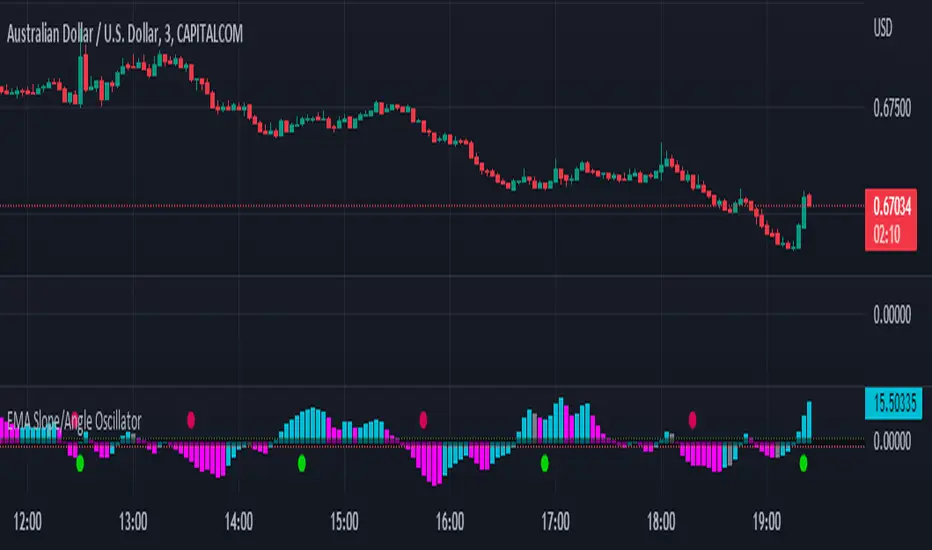
EMA Slope/Angle OscillatorEMA Slope/Angle Oscillator, Multiple Moving Average Oscillator, Multiple type
Moving Averages HMA,EMA,WMA,SMA, VWMA,VWAP provided.
The angle is calculated between the Slow MA and Fast MA and the difference between the angle is plotted as Histogram.
Additionally Buy Sell Signals are plotted as green and red Dots.
its very easy to judge the movement of price Bearish/Bullish.
Bearish if price below 0 line
Bullish if price above 0 line
Zero crossing is Moving Average Crossover.
Trend Filter is provided to filter opposite signals.
Angle Threshold is provided to filter low angle false signals.
Dead zone is plotted around Zero Line. Trades can be taken after Threshold angle or Dead zone is crossed
Its interesting to see how different Moving Averages move along with price Action.
Super Sniper - Screener - MTF- Multi Asset -Multi IndicatorSuper Sniper Screener with Multi Indicator EMA Crossover, Trend, ADX, MACD, SSL, CCI, STOCHASTIC, RSI, HMA, QQE, WAE. Trade Entry/Exit with multiple Indicator for Multiple Assets and Multiple Timeframe. if you are on a Higher / Lower Time frame and are looking for Entry/Exit based on a lower timeframe then this indicator is the best. The all in one screener for EMA Crossover, Trend, ADX, MACD, SSL, CCI, STOCHASTIC, RSI, HMA, QQE, WAE
What is Sniper Entry?
if you are on a Higher / Lower Time frame and are looking for Entry/Exit based on a lower timeframe then this indicator is the best.
About this indicator.
horizontal Lines are in pink (down) and blue(up) color grey (neutral)
10 horizontal lines are plotted each for a timeframe + Asset / Currency / Stock
Back ground represents UP/DOWN Trend based on EMA 200 with the current time frame.
RED-Dot and GREEN-Dot are buy sell signals of SSL Channel for current Time Frame.
You can choose only one type of indicator (EMA Crossover, Trend, ADX, MACD, SSL, CCI, STOCHASTIC, RSI, HMA, QQE, WAE) for all the 10-lines
Select Asset and Timeframe for Each Line on the Graph.
Based on the color of the line and changes on Multi Timeframe you can ENTER/EXIT a Trade on current Timeframe.
Hence a Sniper Entry with multiple Indicator Screener

HMA (Hull Moving Averge) Backtest (Simple) [Loxx]Simple backtest for HMA (Hull Moving Average) found here:
What this indicator includes:
- Various average modes to fine-tune the signal
- Shift to offset chart (purely visual, has no bearing on actual calculation or backtest)
What this backtest includes:
-Longs and shorts
-Customization of inputs for HMA calculation
-Take profit 1 (TP1), and Stop-loss (SL), calculated using standard RMA-smoothed true range
-Activation of TP1 after entry candle closes
Happy trading!
HMA (Hull Moving Averge) [Loxx]The Hull Moving Average (HMA), developed by Alan Hull, is an extremely fast and smooth moving average. In fact, the HMA almost eliminates lag altogether and manages to improve smoothing at the same time.
Included:
- Various average modes to fine-tune the signal
- Shift to offset chart (purely visual, has no bearing on actual calculation)
This is an exact clone of the HMA (Hull Moving Averge) MT4 indicator
Multi Timeframe Moving Average (ema, sma, rma, wma and hma)I use multi timeframe moving averages so that the entries on my trades are in line with the trends of all timeframes. With this script I can plot moving averages for three timeframes in one screen.
Moving averages that have been available include ema, sma, rma, wma and hma.

Mother of All Moving Averages, MAMA [orion35]This indicator contains the huge number of 53 MA tools . So, with the Mother of All Moving Averages (MAMA) , you can draw any two of these MA tools (that is, almost all the "Moving Average" tools used in the market) in the length and thickness you want.
These MA tools include traditional averages such as SMA , EMA , DEMA, as well as innovative averaging tools such as LFS (Laguerre Filter Smoother), LSMA (Least Square Moving Average), ZLSMA (Zerolag LSMA ) developed by @veryfid and SSMA (Super Smoothed Moving Average ) by John F. Ehlers .
Another great feature of this indicator is that signals can be filtered according to the instant ADX (Average Directional Movement indeX) value of the market. By using this filter, false signals in horizontal markets can be reduced. Also, with the threshold value setting in the ADX filter, calibration can be made for different assets and time frames when desired. In addition, you can color the price bars according to the ADX threshold value you set.
You can also automatically color these drawings in conditional formats as you wish.
If desired, the intersections of the plotted curves can be showed as signals. You can also set alarms for these intersections.
This indicator contains almost twice as many MA tools as the previous Super Moving Average Tools, SMAT indicator. For this reason, they are gathered in two main groups as " Traditional " and " New Generation " MA tools.
These MA tools are listed as follows:
--------- Mostly Traditional MA Tool s ---------
LFS : Laguerre Filter Smoother
SMA : Simple Moving Average
EMA : Exponential MA
DEMA : Double EMA
TEMA : Triple EMA
QEMA : Quadrupole EMA @everget
ZLEMA : Zerolag EMA
KZLEMA : Kalman ZLEMA
LRSMA : Linear Regression SMA
LREMA : Linear Regression EMA
TMA : Triangular MA (slow)
TMA v2 : Triangular MA (normal)
TMA v3 : Triangular MA (fast) @Daveatt
SMMA : SMoothed MA
SSMA : Super Smoother MA © 2013 John F. Ehlers
SSF : Super Smoother Filter @DonovanWall
SSeMA : Smoothed SEnsitive MA @BakwaasTrading
WMA : Weighted MA
VWMA : Volume Weighted MA
VWAP : Volume Weighted Average Price
AMA : Adaptive MA @everget
KAMA : Kaufman's Adaptive MA
FrAMA : Fractal Adaptive MA @Shizaru
ALMA : Arnaud Legoux MA
--------- New Generation MA Tools ---------
HMA : Hull MA
EHMA : Exponential HMA @DonovanWall
JMA : Jurik MA @everget
RMA : Relative MA aka Rolling MA
LWMA : Linearly Weighted MA @io72signals
LSMA : Least Square MA
ZLSMA : Zerolag LSMA @veryfid
ARSI : Adaptive Relative Strength Index @everget
WWMA : Welles Wilder's MA @KivancOzbilgic
VMA : Variable MA by Tushar S. Chande,
VIDYA : Variable Index Dynamic Average @KivancOzbilgic
VIDYA v2 : @Mohamed3nan
TSF : True Strength Force @KivancOzbilgic
TILL : Tillson T3 MA @KivancOzbilgic
DAF : Dynamically Adjustable Filter @alexgrover
KFS : Kalman Filter Smoother @alexgrover
PKF : Parametric Kalman Filter @alexgrover
VAMA : Volatility Adjusted MA @Duyck
CTI : Correlation Trend Indicator by John Ehlers
BF : Blackman Filter @alexgrover
MAMA : MESA Adaptive MA aka: Mother of AMA @KivancOzbilgic
FAMA : Following Adaptive MA @KivancOzbilgic
ARMA : Autonomous Recursive MA @alexgrover
ZARMA : Zerolag ARMA @alexgrover
A2RMA : Adaptive ARMA @alexgrover
EDMA : Exponentially Deviating MA @MightyZinger
BLP : Butterworth Low Pass Filter @DonovanWall
GLP : Gaussian Low Pass Filter @DonovanWall
SWMA : Sine Weighted MA @blackcat1402
Stop Loss With Average True Range (ATR)Stop Loss With Average True Range (ATR)
It simplifies the calculation of stop loss price for stop loss method using the average true range (ATR).
For example;
You want to stop loss below 3 ATR. Let's assume the price is 100, the average true range is 5. You will multiply the average true range by 3 and subtract from the price and enter a stop loss order at the 85 price you have reached. Instead of doing this calculation every time, you just need to use this script and set the multiplier to 3. A stop loss line will be drawn below the price candles.
You can set the method to be used when averaging the true range. Methods you can use to average: EMA (exponentially moving average), HMA (hull moving average), RMA (moving average used in RSI), SMA (simple moving average), SWMA (symmetrically weighted moving average), VWMA (volume-weighted moving average), WMA (weighted moving average).
You can set the length to be used when averaging the true range.
You can set the multiplier to be used when determining the stop loss price.
Turkish
Ortalama Gerçek Aralıkla (ATR) Zarar Durdurma
Gerçek aralığın ortalamasını kullanarak zarar durdurma yöntemi için zarar durdurma fiyatının hesaplanmasını kolaylaştırır.
Örneğin;
3 ATR kadar aşağıda zarar durdurmak istiyorsunuz. Fiyatın 100, ortalama gerçek aralığın 5 olduğunu varsayalım. Ortalama gerçek aralığı 3 ile çarparak fiyattan çıkaracaksınız ve ulaştığınız 85 fiyatına zarar durdurma emri gireceksiniz. Bu hesabı her seferinde yapmak yerine bu betiği kullanmanız ve çarpanı 3 olarak ayarlamanız yeterli. Bu sayede fiyat mumlarının altına zarar durdurma çizgisi çizilecektir.
Gerçek aralığın ortalaması alınırken kullanılacak yöntemi ayarlayabilirsiniz. Ortalama almak için seçebileceğiniz yöntemler: EMA (üstel hareketli ortalama), HMA (gövde hareketli ortalama), RMA (göreceli hareketli ortalama), SMA (basit hareketli ortalama), SWMA (simetrik ağırlıklı hareketli ortalama), VWMA (hacim ağırıklı hareketli ortalama), WMA (ağırlıklı hareketli ortalama).
Gerçek aralığın ortalaması alınırken kullanılacak periyot uzunluğunu ayarlayabilirsiniz.
Zarar durdurma fiyatını belirlerken kullanılacak çarpanı ayarlayabilirsiniz.

Hull Suite + Stoch RSI Strategy v1.1 This strategy uses Hull Suite with Stoch RSI
Uses Hull Suite as trend and only trades with the direction of the trend.
Entry conditions:
Hull Suite as a trend
Stoch RSI overbought for short entries & oversold for long entries
Current parameters works best on BINANCE:BNBBUSDPERP pair.
