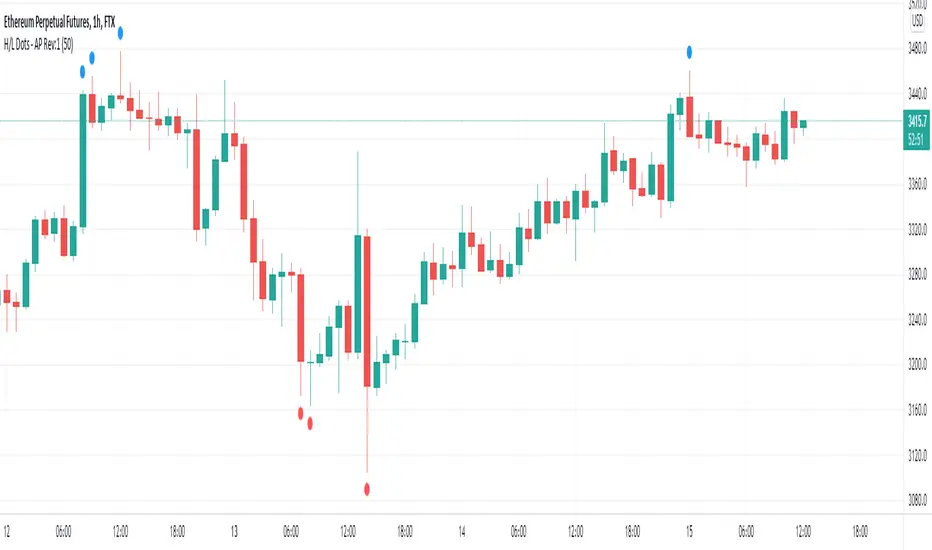
Recent High/Low Dots by Alejandro PSimple indicator that plots a dot in the chart when a candle breaks the high of the past X candles.
This is useful to easily visualize when the market is coming out of a range and making fresh highs or lows relative to the past X candles.
It can be used in trend following systems as an additional filter for validation.
하이-로우 인덱스
Trend Background by Alejandro PThis indicator is a comprehensive trend indicator designed to help traders filter market conditions for their trading.
The indicator has the option to use a classic Simple Moving Average as a trend filer or a more advanced Simple Moving Average Slope.
The indicator can also use the Aroon indicator as the trend filter and both the SMA and Aroon can be used together to only trade in strong trends.
The Simple Moving Average Slope and the Aroon filters can allow you to filter our 3 market conditions. 1- Upwards Trend, 2- Downwards Trend, 3- Ranging
By tuning these filters to your strategy you can make sure you are only taking trades when the trend is on your side and you can even filter out ranging market conditions to trade the best strategies depending on the market conditions.
Technical details:
If the Simple Moving Average filter is on and the Slope filter if off the indicator will determine the trend by where the price is relative to the moving average. If the price is higher than the SMA then the trend will be bullish, if the price is below the SMA the trend will be bearish.
If SMA filter and Slope FIlter are both on then the trend es defined by the slope of the SMA, this means that if the SMA slope is increasing then the trend will be bullish, if the slow is negative then it will be bearish, but if the slope is within a certain percentile that is classified as neutral then there will be no trend or a neutral market.
If the Aroon filter is enabled this will calculate the trend by the percent of candles with new highs or lows in a similar way as the SMA slope filter works
If both filters are enabled then both filters will have to coincide for a bull or bear trend to be determined.

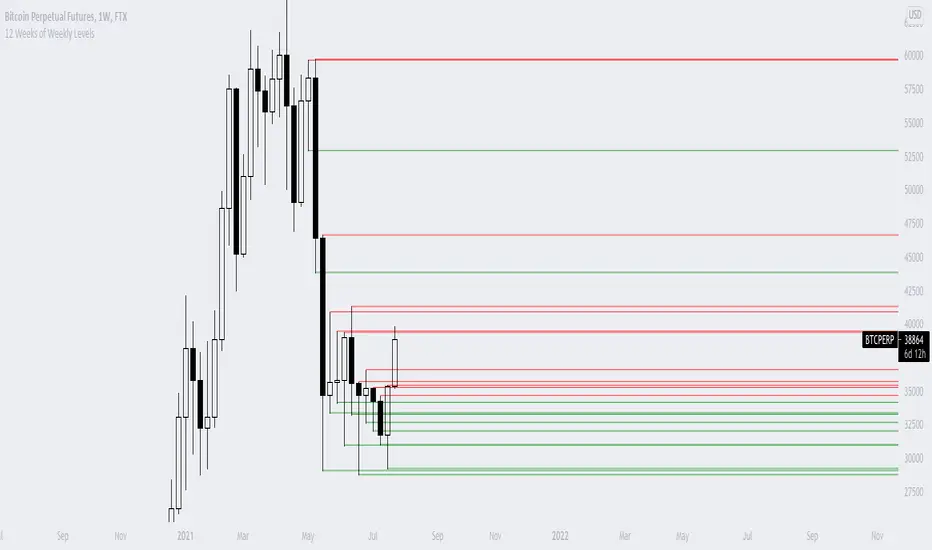
12 Weeks of Weekly LevelsA very simple indicator, which basically looks back on the past 12 weeks at 8PM EST and finds the highs and the lows. Once it finds those levels, it draws them as horizontal rays on the chart. The lows are drawn in green (to indicate previous buy zones) and the highs in red (to indicate previous sell zones). No user inputs are required
Nothing fancy, just weekly levels for the past quarter. You can easily draw these on a chart yourself, but it becomes very time consuming if you are watching a bunch of instruments and then Sundays come around.
Special shoutout to rumpypumpydumpy on StackOverflow for helping me work out the kinks, this is the first indicator I ever created. Hope it helps you find confluence in your decision making
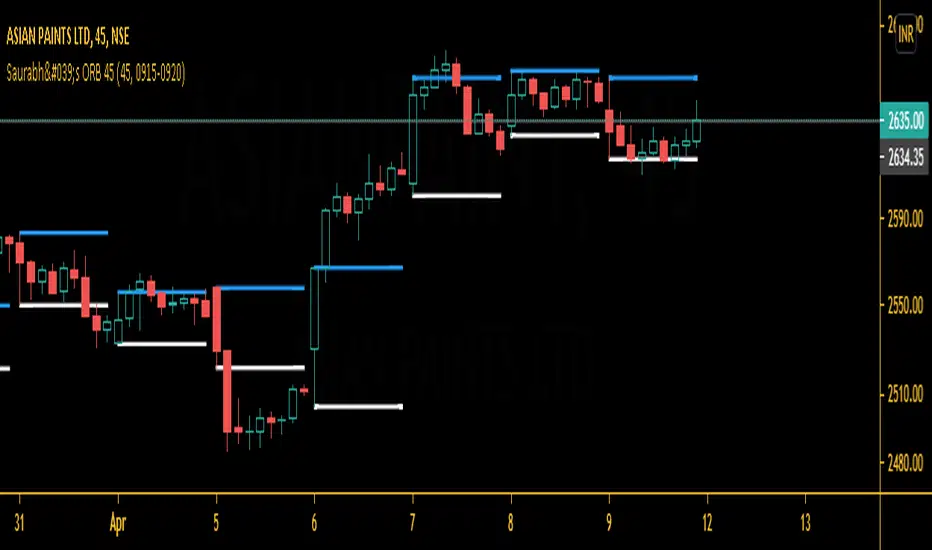
Saurabh's ORB 45This is indicator is all about opening range breakout on 45 mins charts.
|
|
|
|
|
which can be useful to day trader as a breakout strategy following the trend. Useful in 45 mins charts. Also, you may change the time frame from settings according to your likes.
Give thumbs up if you like it.
Cumulative Pivot HighLowThis indicator counts number of higher highs/lows and number of lower highs/lows and calculates trend based on that.
Indicator line shows (sum of higher highs/lows - sum of lower highs/lows) derived from last loopback periods. Indicator is green if last two consecutive highs/lows formed are on higher side. Red if on lower side. (Consecutive numbers can be controlled by parameter direction_threshold )
combineHighsAndLows if unselected shows not cumulative version but last consecutive highs and lows marked in red or green according to the trend.

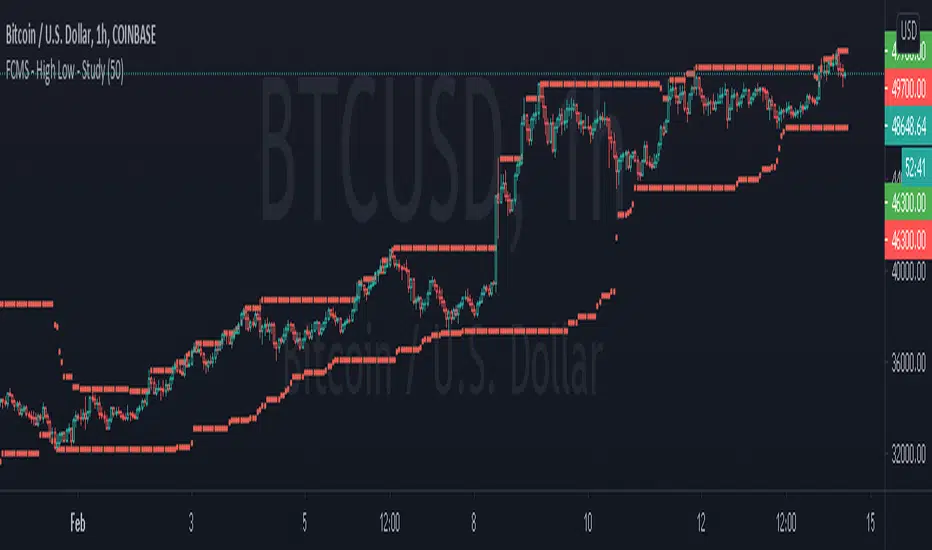
FCMS - Arrays Exercise - High Low with Arrays - StudyThis is just a script to exercise the use of arrays on pine script.
I think we could say that every for loop we had in pine script before the arrays, is eligible to become an array.
Our script will get more efficient and more reliable.
As every "if" case is elegible to became a function
I confess I was addicted to use if, else if, else in my codes, but recently i've been updating my scripts and it's became more efficient
I couldn't find an array function that insert an value removing the oldest one, so I'm using this condition to "shift" the first value.
I'll update as soon as I find a better way to do it.
In any case, for this specific goal, we already have an built in function, as I let on script
All-time high and percentage dropsThis script calculates the ATH of whichever chart you use and plots it in blue
There is also an option to display the following ATH percentages: 90, 80, 70, 60, 50, 40 and 30 in white

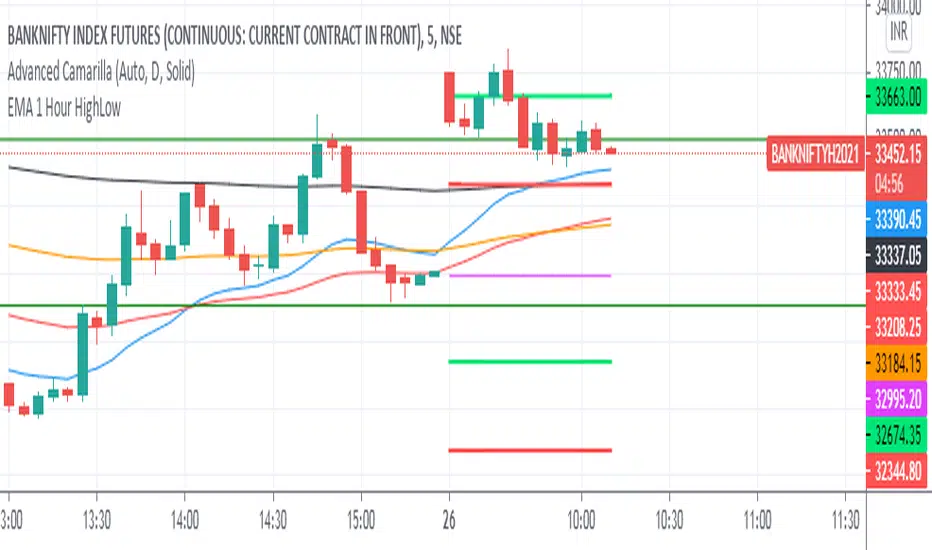
1st Hour High and Low ISRDaily Range :
1st Hour High and Low From Market Start Time
ISR = Initial Support Resistance
sDEFI Synthetix ExchangeStudy plotting sDEFI per sips.synthetix.io
Scale on the axis is not correct, it will always show whatever the base asset you open and hide. Use this study only for visual charting.

Donchian Channel - Pivot High-LowCombining Pivot High Low and Donchian Channel - both of which are useful indicators for trend following.
Donchian Channel shows highest and lowest prices for X number of bars.
Pivot High-Low identifies when price made new Highs and Lows
Applying Donchian Channel on Pivot High-Low channel, we are plotting highest and lowest pivots formed in X bars.
In this indicator, we have 3 options for Channel Base :
Price : This is regular Donchian channel based on High-Low Price
Pivots : This is Donchian channel based on pivot points.
Combined : Combines both. Takes highest of Price and Pivots for plotting high, lowest of Price and Pivots for plotting low

HTF Trend FilterTrend filter based on higher timeframe candles. Can be used as entry filters.
Checks if last 3 higher timeframe candles are in fully ascending order or fully descending order. Additionally you can also check if close price is above min of last two highs or below max of last two lows.
Lime and Orange candles imply partial trend in higher timeframe. (only last 3 candles align)
Green and Red candles imply complete trend. (last 3 candles align along with current close price).
Just an experiment. Can be further improved,

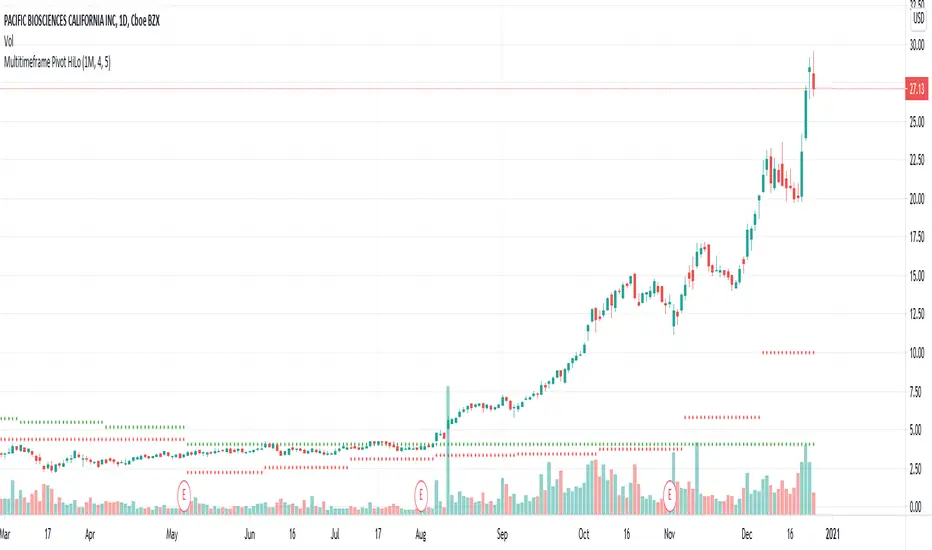
Multitimeframe Pivot HiLoPivot High/Low for multi timeframes.
Could be great entry filter to include multi time frame pivots in trend trading strategies.
Rabbit HoleHow deep is the Rabbit hole? Interesting experiment that finds the RISING HIGHS and FALLING LOWS and place the difference between the highs and lows into separate arrays.
== Calculations ==
In case current high is higher than previous high, we calculate the value by subtracting the current highest high with the previous High (lowest high) into array A,
same method for the lows just in Array B.
Since we subtract highs and lows it means velocity is taken into consideration with the plotting.
After adding a new value we remove the oldest value if the array is bigger than the Look back length. This is done for both lows and highs array.
Afterwards we sum up the lows and highs array (separately) and plot them separately, We can also smooth them a bit with Moving averages like HMA, JMA, KAMA and more.
== RULES ==
When High Lines crosses the Low Line we get a GREEN tunnel.
When Low Lines crosses the High line we get the RED tunnel.
The Greenish the stronger the up trend.
The Redish the stronger the downtrend.
== NOTES ==
Bars are not colored by default.
Better for higher time frames, 1 hour and above.
Enjoy and like if you like!
Follow up for new scripts: www.tradingview.com

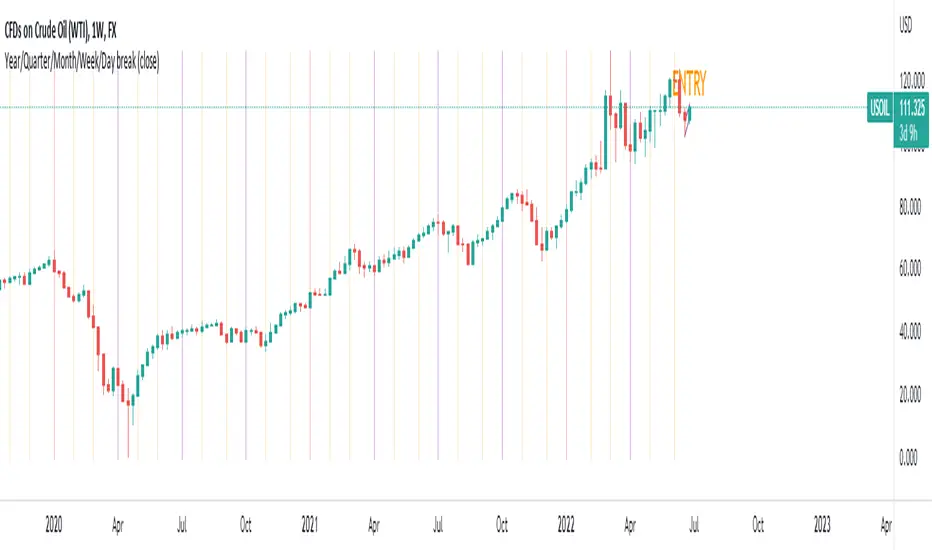
Year/Quarter/Month/Week/Day breaksUse this script very effectively to create completely customisable breaks ranging from :
YEAR
QUARTER
MONTH
WEEK
DAY
High Low Rate Of ChangeAn experimental indicator using Pine Script Arrays. The indicators measures the rate of change of the highest highs and lowest lows. I call it the "High Low Rate of Change".
The H/L Rate of Change indicator finds the delta between the current highest high and previous highest high and after some filtering places these values into an array.
Same goes for the lowest lows.
In the end Sum it all up into the Histogram with optional smoothing using Exponential moving average (EMA).
==Colors==
Green: Up Trending.
Light Green: Weakening up trend.
Red: Down Trending.
Light Red Weakening Down Trending.
==Notes==
Bar colors are disabled by default.
Supports EMA smoothing (enabled by default).
Like if you Like and Enjoy!
Follow up for upcoming indicators: www.tradingview.com

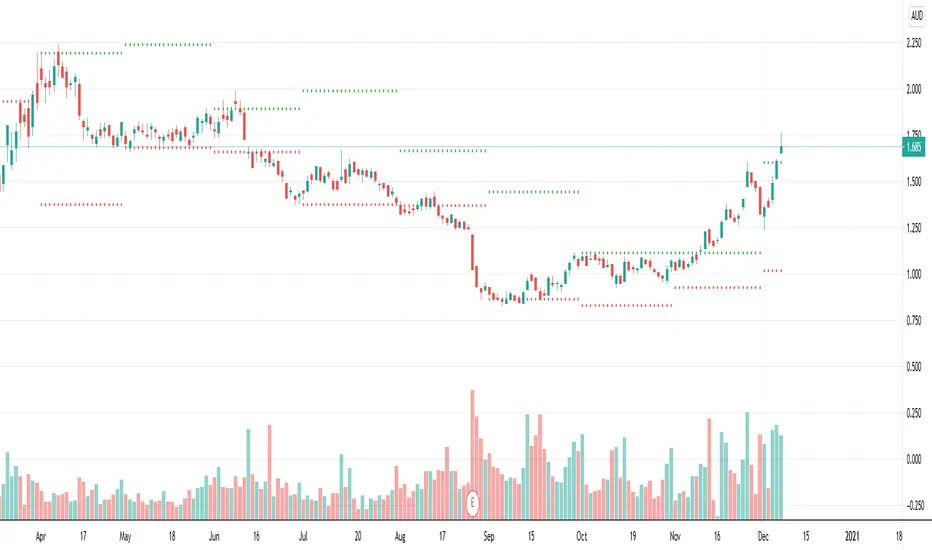
Previous High/Low MTFIndicator to plot higher time frame previous candle highs and lows.
One of the key factor in understanding the trend is to look at higher time-frames chart.
Parameters are explained below:
resolution : Chose resolution of higher timeframe. If set to same as symbol, it will consider next parameter HTFMultiplier for calculation of higher timeframe
HTFMultiplier : Multiply symbol timeframe to by HTFMultiplier to derive higher time-frame
Offset : Number of higher timeframe candles before to be plotted. 1 means - it will show highs/lows of previous higher timeframe candle.
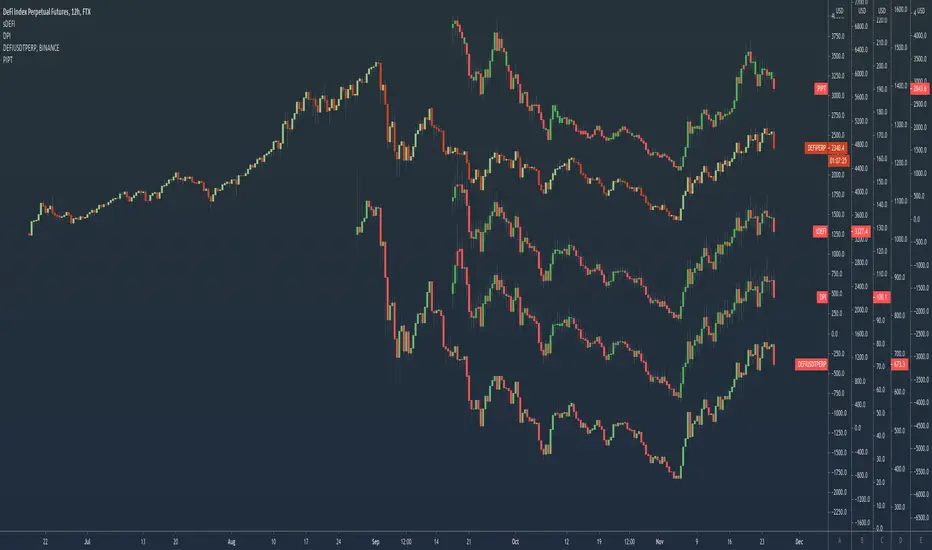
PIPT | Power Index Pool Token | DeFi indexPowerPool provides a DeFi index that has too many components to be used as a chart ticker.
So here is an indicator to bypass the ticker limit.
From the PowerPool docs : app.powerpool.finance
The chart shows it in comparison to other DeFi indexes, quite a difference as you can see!
DPI | DeFi Pulse IndexTokenSets and DeFi Pulse provide a DeFi index that has too many components to be used as a chart ticker.
So here is an indicator to bypass the ticker limit.
From the TokenSets docs : www.tokensets.com
The chart shows it in comparison to other DeFi indexes, quite a difference as you can see!

sDEFI IndexThe Synthetix Exchange provides a DeFi index that has too many components to be used as a chart ticker.
So here is an indicator to bypass the ticker limit.
From the Synthetics docs : docs.synthetix.io
DeFi Index (sDEFI)
Contract: 0xe1aFe1Fd76Fd88f78cBf599ea1846231B8bA3B6B
Token | Initial Weight
---------------------------
Aave | 15%
Synthetix Network Token | 15%
yearn.finance | 15%
Uniswap | 10%
Compound | 7.50%
Maker | 7.50%
Balancer | 5%
Curve DAO Token | 5%
Kyber Network | 5%
Ren | 5%
UMA | 5%
Wrapped Nexus Mutual | 5%
The chart shows it in comparison to FTX's DeFi index, quite a difference as you can see!

HhLl-OscilatorSimple oscillator which checks how many highs and how many lows the price is making. Parameters are as explained below:
lookback - Checks how many highs and lows it is making in these many bars. Sum of all highs and lows are taken for plotting.
periods - Initial period to check high and lows
multiples - Number of multiples on initial period for which highs and lows are checked
colorCandles - CandleColor based on the oscillator
If periods is 20 and multiples is 5 and loopback is 10
Indicator checks for last 10 bars how many highs/lows are made for 20, 40, 60, 80 and 100 periods. Sum of all highs and lows are plotted on the oscillator overlay

Price MovementPrice indicator that shows the trend based on price movement.
The indicator determinants when an asset price is getting higher or lower by comparing the previous price highs and lows to the current price.
==Explanation==
In case current HL2 exceeds the previous HL2 HIGH then the columns will turn green.
In case current HL2 fails the previous HL2 LOW then the columns will turn red.
The trick here is that the trend CONTINUES to show the greens and reds, until a reversal happens to the opposite side.
This can be used to determinate trends and reversals.
Note: Bar colors are disabled by default.
You can set the lookback period at the indicator settings as well as the asset source (HL2,CLOSE, etc..). default is HL2
Quote that i like: “It is impossible to produce superior performance unless you do something different from the majority.” – John Templeton
Enjoy and like if you like :)

High Low Differential MeterYet another trend follower that is based on a very simple principle: Take the highest high and lowest low from a user defined bars back period, do an average between them and smooth them up with 3 possible moving averages, VIDYA, EMA and SMA, while VIDYA is the default.
What is VIDYA ?
Variable Index Dynamic Average (VIDYA) is similar to the Exponential Moving Average (EMA), but automatically adjusts the smoothing weight based on price volatility.
How to use:
GREEN : Up trending
LIGHT GREEN : Up trend reversal might occur.
RED : Down trending
LIGHT RED : Down trend reversal might occur.
NOTE: BAR COLORS are set to TRUE by default!
Follow for more indicators: www.tradingview.com

Trend-Range IdentifierTrend trading algorithms fail in ranging market and Swing trading algorithm fail in trending market. Purpose of this indicator is to identify if the instrument is trending or ranging so that you can apply appropriate trading algorithm for the market.
Process:
ATR is calculated based on the input parameter atrLength
Range/Channel containing upLine and downLine is calculated by adding/subtracting atrMultiplier * atr to close price.
This range/channel will remain same until the price breaks either upLine or downLine.
Once price crosses one among upLine and downLine, then new upLine/downLine is calculated based on latest close price.
If price breaks upLine, the trend is considered to be up until the next line break or no lines are broken for rangeLength bars. During this state, candles are colored in lime and upLine/downLine are colored in green.
If price breaks downLine, the trend is considered to be down until the next line break or no lines are broken for rangeLength bars. During this state, candles are colored in orange and upLine/downLine are colored in red.
If close price does not break either upLine or downLine for rangeLength bars, then the instrument is considered to be in range. During this state, candles are colored in silver and upLine/downLine are colored in purple.
In ranging duration, we display one among Keltner Channel, Bollinger Band or Donchian Band as per input parameter : rangeChannel . Other parameters used for calculation are rangeLength and stdDev
I have not fully optimized parameters. Suggestions and feedback welcome.
