SilverHawk Trend Flow Part of SilverHawk Suite
This script is designed to be used with the SilverHawk Suite workflow (context → trigger → confirmation → execution).
It works standalone, but the highest accuracy comes from using the full suite together.
Where it fits:
• Role: Context
What it does:
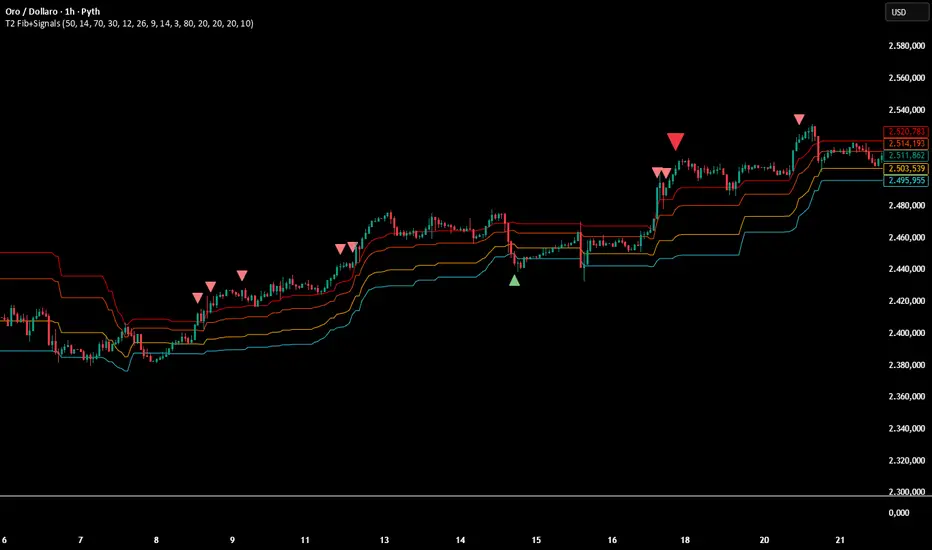
Colors candles based on detected trend regime, so you trade with the prevailing direction and avoid fighting structure.
How to use:
• Bullish color: prefer long triggers only
• Bearish color: prefer short triggers only
• No clear trend / transition: stand down and wait for the suite trigger + confirmation
Visual Tip: (important)
If candles look “hidden”: Settings → Visual Order → Bring To Front
Alerts:
New Up Trend / New Down Trend alerts trigger on confirmed candles (non-repainting style).
Suite note:
For full workflow and loadouts, start with: “SilverHawk Suite — Start Here (Workflow Guide)” (free)
Credits / License
Based on PhantomFlow Trend Detector (MPL-2.0). This script remains MPL-2.0.
Pine Script® 인디케이터