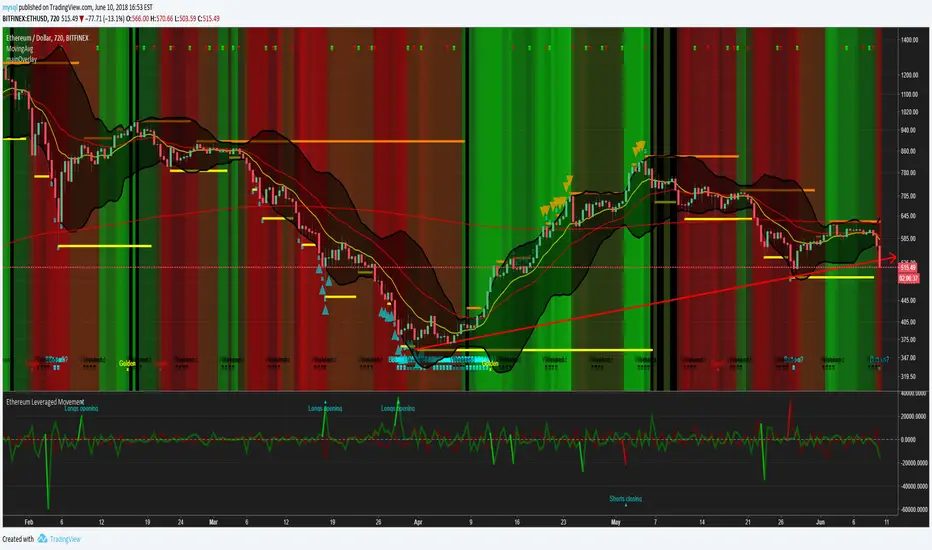
Ethereum Leveraged Movement, 3 different short/long views3 different views for Ethereum short/longs. the main view allows you to see changes from one bar to the next.
이더리움 (크립토커런시)
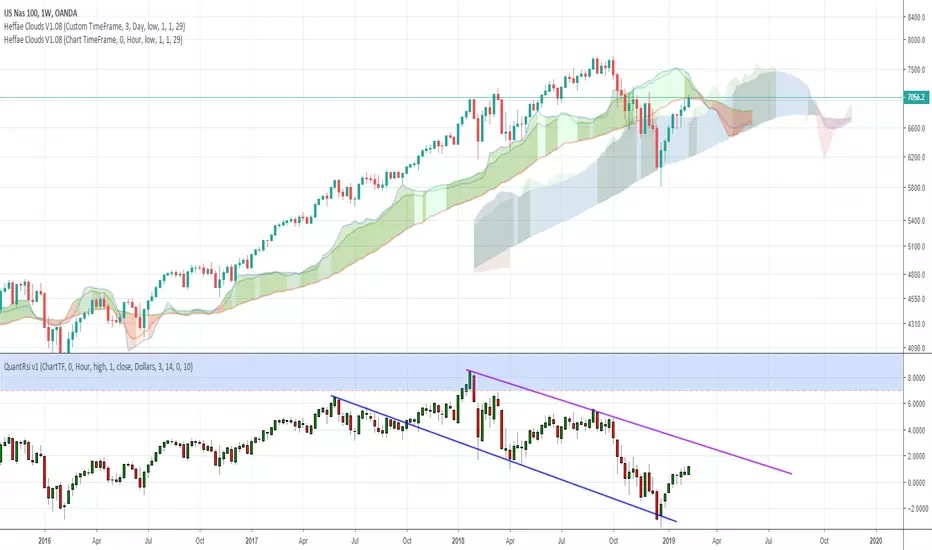
Heffae Clouds v1.00Heffae Clouds v1.0 - Ichimoku Modernized
Heffae Clouds Alpha release Version 1.0
Heffae Clouds functions as adaptive support and resistance. It has real-time paths and offset clouds, similar to ichimoku.
Paths are calculated by the complex discovery of prior behaviour for any crypto or forex asset.
Uses 5 single layer networks to calculate the optimal path fitting for any asset or timeframe.
The cloud color provides granular detail on path validity.
Please see the pastebin link for access information and links:
pastebin.com
Video introduction and trading strategy:
Some Beta-tester comments:
"It's like now having a microscope if you get what I mean. Which says great things about what you have done here. Love it man"
"I just find myself makes so many good decisions with your system it's hard to believe"
"this is without a doubt an improvement of Ichimoku (Which is my favorite tool by far). So much more info with your cloud system.."
Nefitty Cryptowave: Visual Control Lite 90DBest used under the influence of Com Truise
The wave will careen off the top and bottom of the channel. Use it to anticipate possible upcoming support and resistance lines. The midline is usually purple, and turns red when it is higher than the channel ceiling, 45 days back. Intended for daily timeframe only.
This indicator requires additional research:
Are there any leading indicators before the wave smashes into an edge?
How do we read it when it begins tightly hugging one extreme?
Can we use the midway line to predict changes?
That's it for now.
Godspeed, soldier.
- nefitty
Find me on r/cryptocurrency Discord


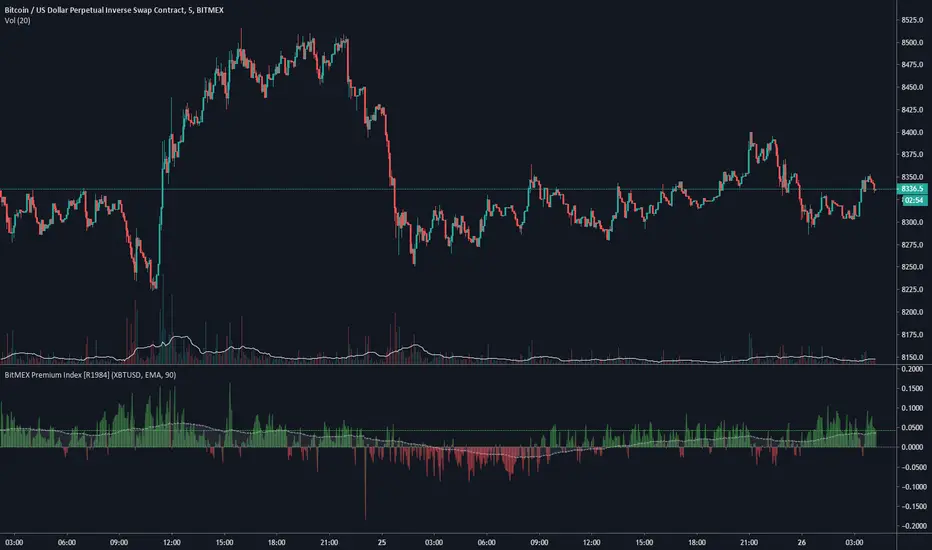
BitMEX Premium Index (.XBTUSDPI) [R1984]Basic indicator showing raw values of the BitMEX Premium Index (.XBTUSDPI) used in calculating the funding rate.
www.bitmex.com
www.bitmex.com
Funding rate indicator available here .
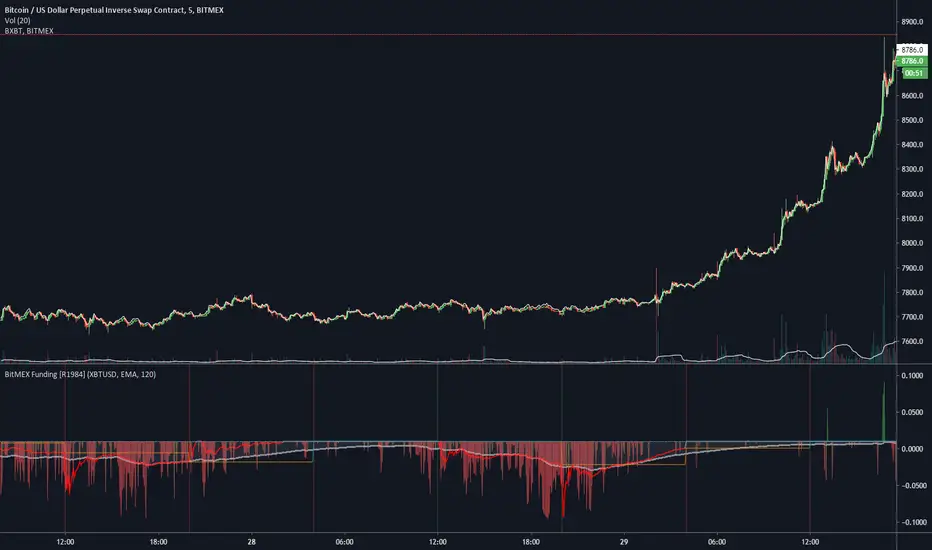
BitMEX Funding [R1984]This indicator attempts to emulate the BitMEX predicted funding rate for the XBTUSD perpetual swaps contract.
Reference
www.bitmex.com
www.bitmex.com
Indicator Key
Green/Red Area plot: Raw values of the calculated funding rate based on the XBTUSD Premium Index (.XBTUSDPI)
White Line plot: Time-Weighted Average Price (TWAP) of the calculated funding rate
Lime/Fuchsia Line plot: Predicted funding rate
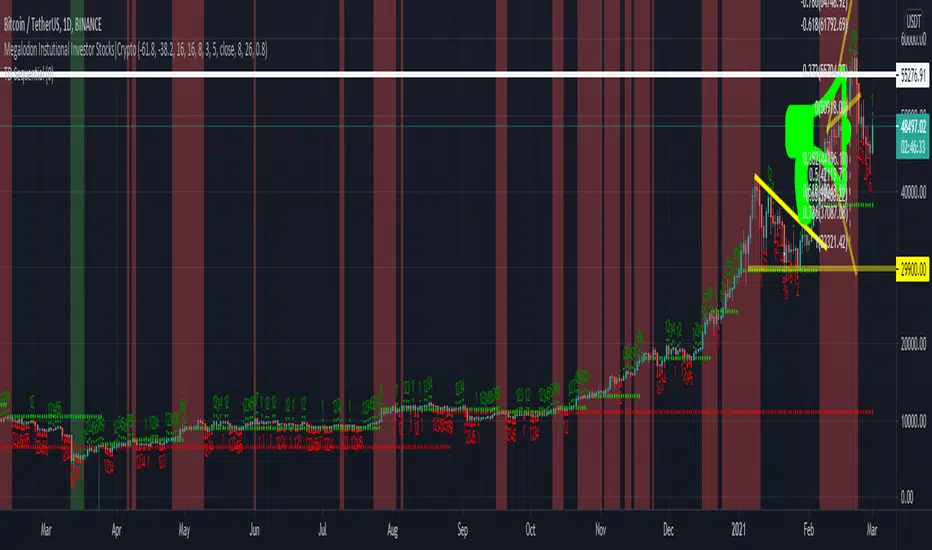
iPyra◬_theMegalodonTHEMEGALODON
theMegalodon looks for the institutional finger prints, the whales or the big boys.
theMegalodon is really simple to use.
theMegalodon combines the 8 different unique indicators, that each have almost perfect success rate.
theMegalodon works with any kind of market state, any kind of trading, and any kind of asset.
theMegalodon has more features than any other indicator in the market: Out of 9 working indicators, we have 3 momentum, 3 price and 3 volume indicators showing you the best signals.
--------------------------------------
theMegalodon is designed for us, the small fishes in the ocean, the millennials, the college students. This will basically makes us the new Megalodons(whale hunters).
All you have to do is:
1- Look for green or red arrows.
2- Look for orange or red candles.
3- Repeat
--------------------------------------
TECHNICAL DETAILS
Some boring info that you don't necessarily need to know.
1- Draws fibonacci retracement (s)' levels depending on your preferred look back period (Default: 365 and 120)
i) Can draw 2 fibs on the same chart. Can reverse the fib levels. Even, add an additional fib level to look for.
ii) Automatic fill function for a Reload Zone inside of a Reload Zone. *61.8% levels to 100% levels or 0% levels
2- Changes the color of the candle when strong buy(orange) or strong sell(red). Draws arrows on the chart for long and short positions.
i) Analyses and Combines
a) Price
b) Momentum
c) Volume
3- Prints out the indicators that are either giving Short or Long signs on the right corner.
4- The closer the unclebo indicator(click enable UncleBo) gets to the All time high, the better buy it is.
i) Same with the other way around. The closer it gets to the 0, the better sell it is.
5- Draws Bollinger Bands on the chart and shows where to buy or sell
6-The indicator is designed to be used in Daily time frame for the best calls to short or long.
--------------------------------------------------
iPyra◬
Enlighten others
Explosive PotentialThis script looks at times where MACD is within a specified range (very close to 0 values) and price action is very constrained (under 2%). Historically price has made a strong move after these conditions.
I typically run this on an 8H timeframe.
Review on BTCUSD and other cryptos.

UncleBo EasyVersion_BETAHey friends,
The Beta version of UncleBo indicator.
Trying to make it as simple and powerful as possible.
I will publish it once i feel like it does the job perfect.
----------------------
For more details and inquiries please pm me.

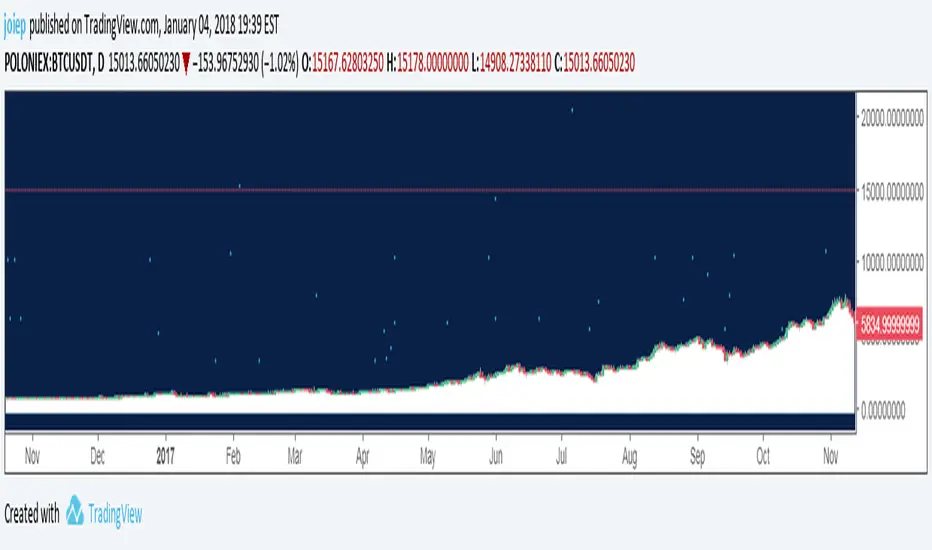
Rainbow RoadRainbow Road allows you to visualise the price in relation to the barriers of support and resistance that are the moving averages. The price can be observed breaking above barriers , or falling below them.
Rainbow Road displays these bands like a ribbon so that the strength or weakness of a security such as Bitcoin, can be observed in a very vibrant and obvious fashion.
The name "Rainbow Road" is inspired by the final course of the Special Cup featured in all Mario Kart games and is the climactic course of each game it appears.
.,-'"*.,-'"*Housekeeping*"'-,.*"'-,.
In order for you to make your chart look exactly like this one when you apply the Rainbow Road indicator, you will need to follow these simple steps.
1. Right click on your chart -> Price Scale -> Undo Indicator Labels
2. Right click on your chart -> Price Scale -> Undo Indicator Last Value
3. Right click on your chart -> Color Theme -> Black
4. Right click on your chart -> Properties -> Background -> Vert Grid Lines -> Slide transparency bar -> Horz Grid Lines -> Slide transparency bar
@#$%@#$%@#$%@#$%@#$%@#$%@#$%@#$%@#$%@#$%@#$%@#$%@#$%@#$%@#$%@#$%@#$%@#$%@#$%@#$%@%
I appreciate the feedback of all of my followers!
Like and follow for more awesome indicators!

UncleBoUncleBo looks for the institutional finger prints, the whales or the big boys.
Looks for price, volume , momentum analysis tools and COMBINES the most famous indicators.
Works for any kind of market.
Only thing you have to do is forget about any indicator you used before and look at lines. This helps you overcome your emotions.
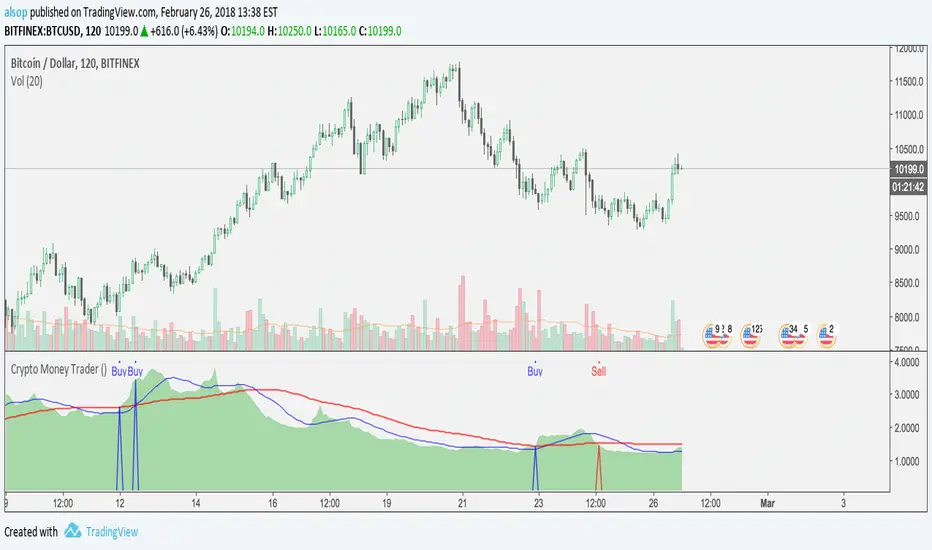
Crypto Money Trader - Indicator for Buy and Sell SignalsThis is it... the one that many have been waiting for.
We have taken everything we have learned from the Crypto Money Index and Crypto Money Bot and combined it into the best indicator possible for trading crypto currencies. This version also includes logic for shorts (sell) and another criteria for longs (buys).
The code is cleaner as well so there is less signal noise and more precise entries.
Before we released this script, we did backtesting on all the current supported USD pairs for optimal results.
Here is one set of results for BTC on 2 hour chats using $5,000 starting balance, 1 trade at once maximum, and 1 contract size:
www.cryptosignalsbot.com
Net Profit: $25,582, 511.64%
Total Trades: 17
Percent Profitable: 70.59%
Profit Factor: 4.304
Maximum Downdraw: $6,629
AvgTrade: $1,504.82, 30.1%
These results get even crazier when you get into settings where you can have 4 trades at once - beyond 700% return... crazy...
The indicator also includes alerts that you can setup so you are aware when a Buy or Sell signal is triggered. Just set an indicator alert for the Trigger Buy or Trigger Sell greater then a value of 0 and you will always know when it is time to look at the charts.
--== STRATEGY ==--
You can combine this indicator with other indicators in your strategy. Many of our most successful users of our previous scripts do just that as it helps them tune a perfect time for an entry.
Personally, we use the indicator and simple trendline entries. When a Buy or Sell triggers, draw a trendline and support / resistance lines and enter on a breakout. That's it.
Please note: this is not a "buy it or sell it now" kind of indicator. Sometimes it will signal a few hours early before a move.
--== SUPPORTED PAIRS ==--
We are always adding pairs, but as of February, 2018 this is our supported USD based pairs: BTC, ETH, LTC, XRP, NEO, BCH, IOT, EOS, BTG, ETC, ETP, OMG, EDO, ZEC, XMR, TRX, SAN, DSH, SNG
--== TELEGRAM CHANNEL ==--
All subscribers to this indicator will get access to our Exclusive Telegram Group where all the signals are analyzed and posted for you to see how we are playing the calls. You can either use this to learn how we use the indicator, or to trade from (at your own risk of course).
The alerts are all posted in this channel automatically and only the timeframes with the highest returns from extensive backtests are posted here automatically. However, we will sometimes post analysis on other timeframes as well.
--== BONUS ==--
As a subscriber, not only do you get this amazing indicator, but as a subscriber you will get access to our Crypto Money Index and the Crypto Money Bot
--== ACCESS ==--
Access is simple, go to our new website and register: Crypto Signals Bot
We will work to get you access to everything as quickly as possible. If you have any issues or questions, use the contact form on the website.
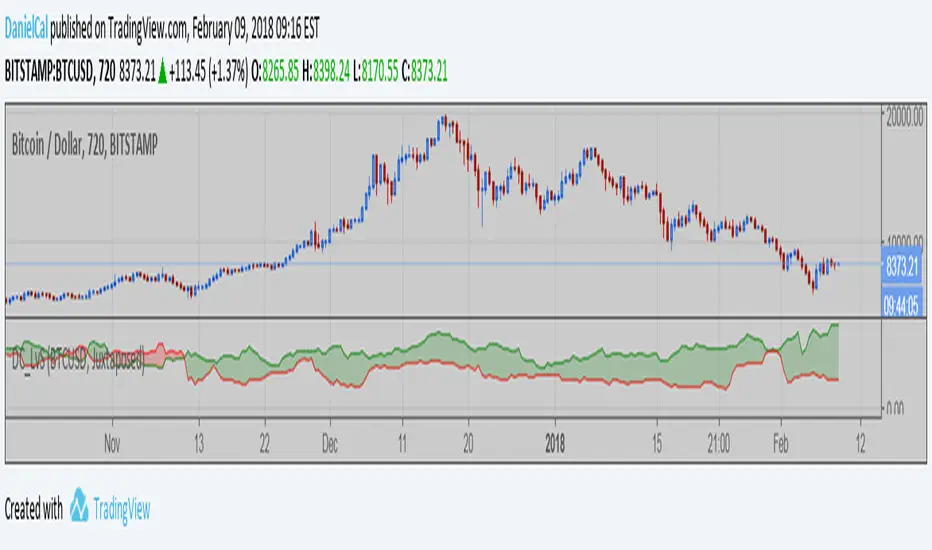
Margin Longs vs Shorts for BTC ETH & all Bitfinex pairs
Two modes of use...
a) The script detect chart symbol and show corresponding Bitfinex Longs & Shorts (if data exist).
b) You select BTCUSD or ETHUSD Bitfinex Longs & Shorts to show on any chart.
Two comparison views...
a) Juxtaposed: longs and shorts in same direction, side by side. (My preferred view)
b) Counterposed: longs and shorts in opposite polarity, separated by zero line. Another line is plotted representing the difference.
Crypto IchimokuIchimoku Cloud with settings recommended for crypto by trader IAmSatoshi. Includes a handy checkbox to double inputs, and alerts that can be set for when the price crosses the bottom or top of the cloud.
This script also includes an ichimoku signal count. The signal count is an UNWEIGHTED sum of positive or negative ichimoku signals with the greatest total being shown in either green(long>short) or red(short>long) or white(0, long==short). The signal count is only shown when their is a new signal or a signal is no longer valid.
If you use a major portion of the code please cite me. If you like the script and make a bunch of money using it, feel free to donate using the crypto addresses below.
BTC: 34uVepgjGJAKqf9i3mfdq8AG1dzTthjCgb
ETH: 0x71B15Beb6AF985853B5fC80205ddb3595C51B63e
LTC: MVzvSu53K5qPfjiQn4nk9D6WVLJKCMzXHJ
DASH: XoKVDBnhiyPvJeyRdpHjcWu1WtVjCbhP68
XMR: 46jnYGp7v5vCSAV8pzGXPbWM7YFiZNB4eaFCHsezitQ46KM1E6FgPM9ZaYJEfDVk5zdKoPQ7vw27ke34jMxERogvJDQhfQW

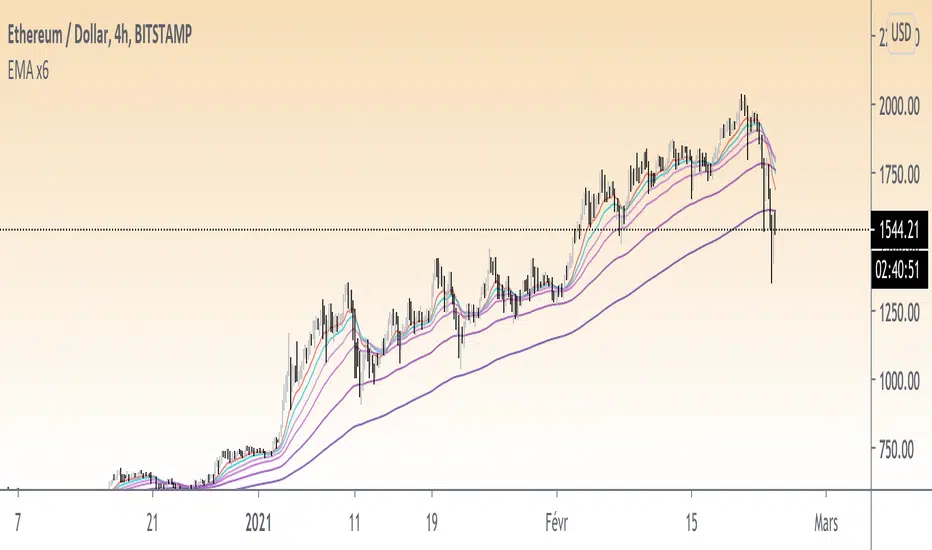
Multi EMAI really like to work with EMAs, but each time you use the "buit-in" one, you use one more slot in your indicators allowed.
So I built this simple one, 4 EMA in one indicator, and easy to use as following;
-displays 4 EMAs
-choose your EMA lenghts. bases are 20;50;100;200
-choose your color and other options as needed.
Hope you will enjoy it, and I will appreciate your feedback, and improvement suggestions.
Khaos-Crypto-TraderThis indicator has been developed to trade crypto-currencies, but can also be used to trade forex, stocks, and futures.
This Indicator is a full trading system that offers setups with Entries, Targets and Stops. This indicator is very accurate because it uses advanced setup detection and filtering logic.
The setup is triggered if the price passes the blue dot. Do not enter the trade unless price passes the blue dot. Each setup has 3 possible targets, which are dots colored green for longs and red for shorts.
The initial stop is the green square for longs, or the red square for shorts.
You can use the base-line (which is the dark blue line with dots) to manage the trade. One strategy would be if you enter a trade long, and reach the first target, you can take some profits, but still let the some of the position run, where a bar closing below the blue line, would stop out your remaining position.
To summarize:
Blue Dot = Entry Trigger
Green Dots = Long Targets (3 of them, for different price targets: target 1, 2 and 3)
Green Square = Long Stop Price
Red Dots = Short Targets (3 of them, for different price targets: target 1, 2 and 3)
Red Square = Short Stop Price
The great thing about this indicator is that its universal, there are no settings necessary -- just put it on the chart and it finds high probability setups and paints it on the chart as they occur. There is NO Repainting with this indicator.
Of course, you can add other indicators if you wish, and even add this indicator to your existing trading system.
Again, this indicator does NOT repaint.
Once a setup is found, the indicator draws the targets and stop at the setup bar close.
Setup Alerts are fully supported, via email, sms, and desktop notification.
LEGAL STUFF:
Risk Disclosure
Futures , forex, stock, crypto and derivative trading contains substantial risk and is not for every investor. An investor could potentially lose all or more than the initial investment. Risk capital is money that can be lost without jeopardizing ones’ financial security or life style. Only risk capital should be used for trading and only those with sufficient risk capital should consider trading. Past performance is not necessarily indicative of future results
Hypothetical Performance Disclosure
Hypothetical performance results have many inherent limitations, some of which are described below. no representation is being made that any account will or is likely to achieve profits or losses similar to those shown; in fact, there are frequently sharp differences between hypothetical performance results and the actual results subsequently achieved by any particular trading program. One of the limitations of hypothetical performance results is that they are generally prepared with the benefit of hindsight. In addition, hypothetical trading does not involve financial risk, and no hypothetical trading record can completely account for the impact of financial risk of actual trading. for example, the ability to withstand losses or to adhere to a particular trading program in spite of trading losses are material points which can also adversely affect actual trading results. There are numerous other factors related to the markets in general or to the implementation of any specific trading program which cannot be fully accounted for in the preparation of hypothetical performance results and all which can adversely affect trading results

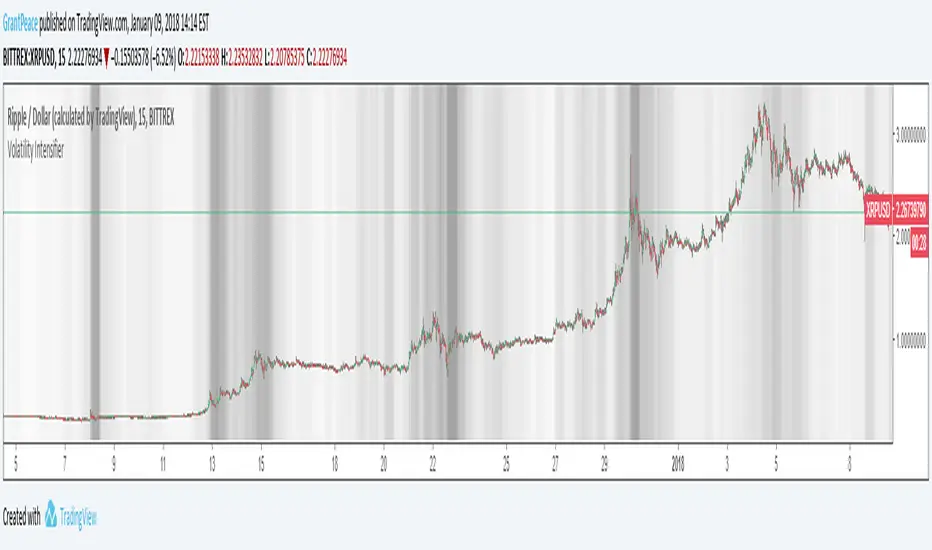
Volatility IntensifierThe background becomes increasingly dark during periods of high volatility.
...and yes, it can get completely black!
This makes it easier to identify areas that are "hot" with price action and appealing to trade.
Follow and comment to be added to the access to this indicator granted every Monday.
Like for more indicators! Thanks to all of my followers, you are the real MVP <3
To clarify; No, this indicator is based off of volatility, NOT volume :)
Bias Indicator (BI) 乖離率What is the Bias Indicator (BI)?
The Bias Indicator is basically based on the share price opening range

Best Holy Grail Indicator V3Thanks to everyone that has been contacting me about the holy grail project, your comments and feedback have made this project much more rewarding. I'm excited for your further feedback. Here is Version 3.
How to use:
At the heart of this projects is a new kind of moving average that I have been developing. As such it is reasonable to think of these lines as highly enhanced and finely tuned moving averages. Their slopes, crossovers, spreads, and behaviors are all meaningful, just as in other moving averages. What is special about these is that if you trade their price crossovers, it almost never generates a real loss, just consistent profits. In trending markets these lines can give you all you need to know about trend entry/exit and details inbetween, effectively letting you get in/out at the top/bottom. In a ranging market they will show you ideal lines of mean reversion, and how to play them.
Description (Upgrades from V2), there are 3 huge improvements from V2:
1) It follows the price better: In the inputs window there is now a box called “Responsiveness”, it can have values from 0 to 5. At 0 Version 3 looks a lot like V2. When you turn up the responsiveness the lines follow closer when they should, and repel themselves when they should be distant. Unfortunately the lines are no longer as smooth, but it isn’t much of a problem. When you turn this up the lines can generate losses if you blindly use the crossover, this is because the slopes of these lines now have more meaning as they focus on the trend, and not how price moves right around it. This can also give very powerful signals if all 5 lines crossover in the same place. Mess with it.
2) There are too many neutral entries: Now every trade can be closed profitably! I posted an idea a few weeks back about “smart execution traces”, it is an intelligently suggested stop loss. The way you set it is in the inputs window at “Smart Execution Baseline”. If you are using crossover signals from Line 4, then set this to 4, if you use line 3 then set it to 3, ect… Unfortunately the lines are also not so smooth, but this can be a very helpful tool. If you play with it you can easily get a feeling for it.
3) Flipping between timeframes is now easier: Here you can bring a line in from another time frame. In the input window there is a box “Line from other timeframe?”. Here you can select the line you are interested in. Next you have to choose which timeframe you are interested it, you can choose this in the “timeframe multiplier” box. This multiplies you current time frame to get the desired one. If you are on the hourly charts and are interest in line 4 on the 6 hour charts, you first choose line 4, then in the timeframe multiplier you enter 6 to see the 6 hour red line in the 1 hour time frame. Likewise if you are still in the 1 hour and want to see the 15 minute red line, simply multiply by 0.25 (which is 1/4). Due to the limitations of pinescript it is easier to see smaller timeframes, getting a higher timeframe line requires more data. If you don’t want to consult another timeframe leave both of these at 0 to cut down on computational time.
After enough inquiries, the source code is now for sale.
If you are making money with this system and want to share it, here are my addresses. If you donated and want to see some of the indicators I am currently working on just message me so I can privately tag you in.
ETH: 0xcf1ca127d9cefb5efbe9557fa09a05cf4daea6c1
ZEC: t1dSFhH9jkG1z9AdGA27e2UqCMLdA2Y1or1
LTC: LQ1cssjU3dhqSa9K85ErqZYuRAPLfGKivA
BCH: 15zwnh2t2nM2bufnuPv12hJvJhFrU8iSFk
Please feel free to write in further questions in the comments below. Hope this makes some of you rich, happy trading!

Cryptotutor CrossThe cryptotutors cross is a lagging indicator that can help detect a change in the trend. For example, it can help detecting an upwards or downwards movement of Bitcoin (on 1H), which can save you a lot of money when you are in altcoins.
