Vantage-X (2.0)Vantage-X (2.0) — The Clean-Chart Trading Dashboard
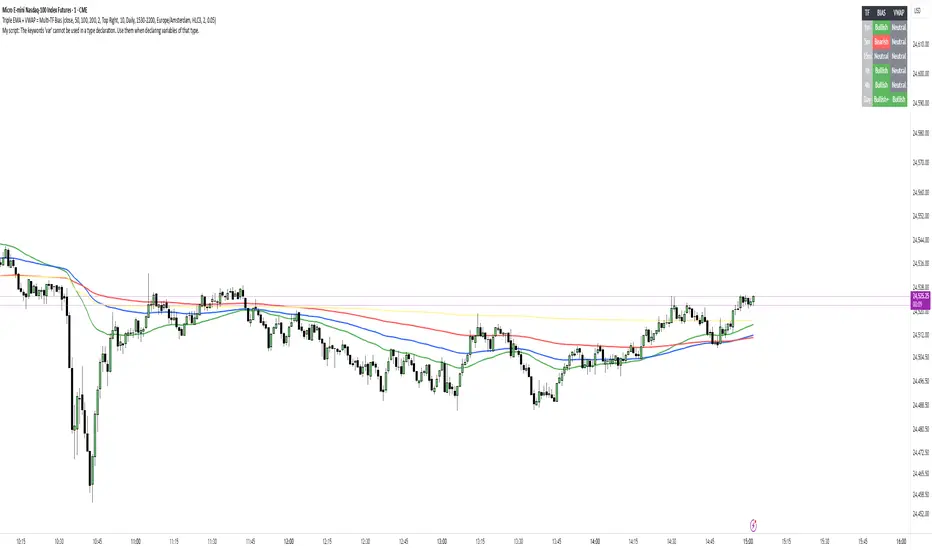
Vantage-X (2.0) is a next-generation, all-in-one chart optimization dashboard designed for traders who want clarity, precision, and zero clutter. Whether you scalp, day trade, or swing trade, this indicator removes the noise and gives you the exact market signals that matter, all from one clean, minimal interface.
Built for traders who are tired of overcrowded charts filled with lines, clouds, bands, and unnecessary indicators, Vantage-X (2.0) brings everything together into a powerful visual dashboard — so you can focus on price action, not distraction.
⸻
🔹 What’s New in Version 2.0
Vantage-X (2.0) adds several high-value trend-tracking systems to improve timing, confirmation, and momentum detection:
• EMA 50 / EMA 200 Cross
A classic long-term momentum and directional bias filter.
Perfect for identifying macro trend shifts or avoiding trades against the dominant trend.
• EMA 20 / EMA 50 Cross
A medium-term trend confirmation system used by professional intraday traders to time pullbacks, continuations, and structure-based setups.
• EMA 5 / EMA 13 Cross
A fast-reaction signal for sudden bursts of volatility.
Ideal for scalpers catching early momentum, breakouts, retests, and reversal flips.
All three systems come with full toggles, so you can enable or disable any layer depending on your style.
All three EMA Crosses work on the current timeframe you are looking at.
⸻
🔹 Core Purpose
The purpose of Vantage-X is simple:
Give traders a clean, powerful dashboard that replaces multiple indicators — without ever touching the price chart.
No more overlapping lines.
No more stacked indicators taking up screen space.
No more analysis paralysis.
Just fast, easy, intuitive signals displayed in a compact table so you can instantly read the market’s story.
⸻
🔹 Features
✔ Ultra-clean dashboard layout (does not clutter your chart)
✔ Trend direction & EMA cross signals
✔ Color-coded bias detection (bullish, bearish, neutral)
✔ Adjustable toggle system for full customization
✔ Works on all markets & timeframes
✔ Designed for scalpers, day traders, and swing traders
✔ Perfect for traders who rely on price action but still want smart confirmation
⸻
🔹 Why Traders Love It
Vantage-X is built for the modern trader — the type who values simplicity, clarity, and speed. Every feature in this dashboard is made to:
• Reduce hesitation
• Improve timing
• Simplify decision-making
• Keep charts visually clean
• Remove emotional noise
• Increase confidence in entries and exits
If you want a chart that stays clean but still gives high-precision market signals, Vantage-X is built for you.
⸻
🔹 Free to Use — For the Trading Community
Vantage-X (2.0) is completely free.
No paywalls. No locked features.
This release is my contribution to traders who want a cleaner, more efficient way to interpret the market without relying on a dozen indicators layered on top of each other.
⸻
🔹 Final Notes
Vantage-X (2.0) is continuously evolving, and future versions will bring even more flexibility, signal refinement, and dashboard intelligence. Feedback is always welcomed — I want this to be one of the most useful and clean charting tools available on TradingView.
🔥 {COMING SOON: You will be able to set different timeframes for each EMA cross Signal. So if you are looking at 5min timeframe but you want to know 15min 20/50 EMA cross. You will be able to adjust that in settings. SO NO SWITCHING BACK AND FORTH BETWEEN DIFFERENT TIMEFRAME CHARTS!!} 🔥
Pine Script® 인디케이터