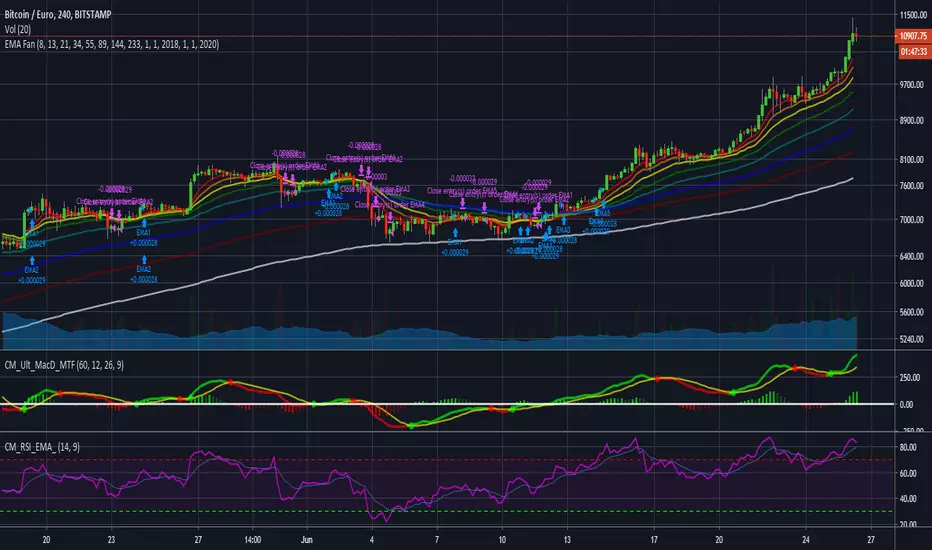
지수 이동 평균 (EMA)
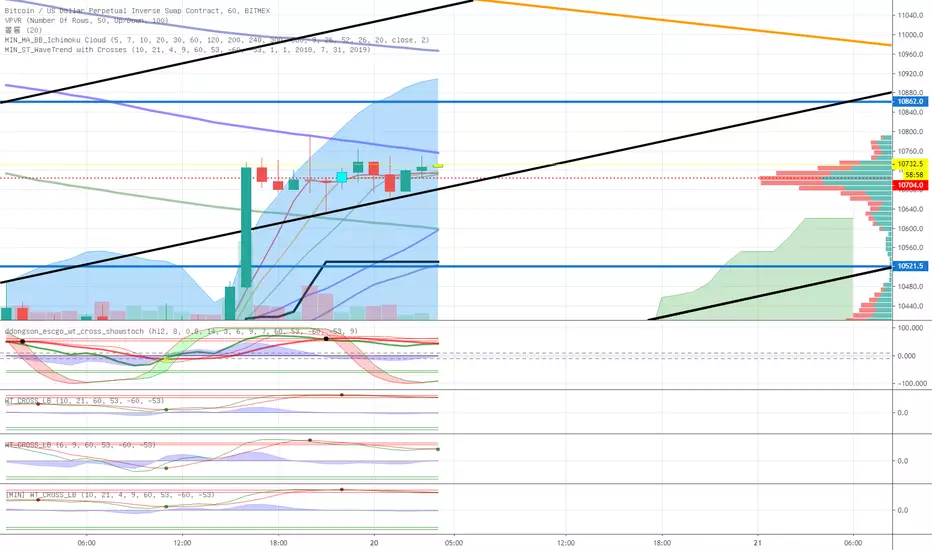
Makenai Chart Strategy Full(日本語による説明は こちら から)
Each hourly foot can display the moving average line for the same period of time in the same color.
The average moving line that you want to see is displayed by time leg, as well as the long-term Bollinger band that should be noticed by the time leg.
1. You can get a lot of useful information at a glance by displaying the moving average line of the long-term and period setting that many traders are aware of.
○ The period setting of the moving average line displayed in each time and foot is not fixed as usual, but changed the period by time and foot, and the moving average line of the same color is the same.
It is a moving average line of time (for example, an hourly average line and a four-hour average line).Therefore, the market price is always the same even if the time to see changes
You can see it on a scale.It doesn't happen when you look at it in five minutes, but when you look at it in four hours, it looks like a downward trend.
○ The sensitivity of the rate to the moving average line displayed is very high.
You can see how rate moves, such as trends, are determined, and you can see reality in abstract chart moves
I can feel it.Purple 24 hours (one day) moving average line with 1 minute to 4 hours of foot, Green 1 week moving average line with 5 minute to day.
The sensitivity to the Blue Monthly Movement Average Line, which is displayed from 5 mins to 5 weeks, and Red One Year Movement Average Line, which is displayed from 1 hour to 5 weeks, is very high.
Just look at whether the rates are moving up or down the moving average line and you'll be able to decide what to look for.
○ What is the positional relation between the moving average line of seven (eight in addition to the weekly moving average line) in the short, short, medium, medium, long, and long periods?
To make the direction and intensity of the trend easier to recognize, it is colored between moving averages to be visible as short- and medium-term clouds.
The three clouds changed color to warm rising clouds and cold falling clouds, depending on the relation of the moving averages.
·Strong upward trend rates when all clouds are unified in either upward or downward direction and are arranged in the order of short-term, medium-term or long-term clouds
·The thickness of the clouds is strong, and when the thickness is increased, the trend rate is strong.
·Trendless market when clouds overlap or the colors of the clouds are mixed
• Range price when rates are moving back and forth between clouds
You can visually and intuitively understand the market conditions, such as .
○ Short-term, short-term, medium- and short-term positional relationships will indicate the timing of the entry payment and the direction of the long-short.It's also written.
In conjunction with this, the duration for which the background color should be long changes to light warm color and warm color, and the duration for short changes to light cold and cold color.
2. The long-term Bollinger band is displayed so that you can trade with the higher time base than the time base you see.
○ You can ride on a long-term trend by detecting and entering the trend occurrence of long-term feet with short-term feet.
Buy high prices, sell low prices, relax your trend-follow-style tears, and enable stress-free entries.
○ A light, transparent gray filter is displayed between the long-term foot Bollinger band ±1σ which sets the period suitable for the time and foot.
I understand that while the rate is moving in this zone (called gray zone), it is difficult to trend and the price range is small, so it should not be taken care of.
Yes, you can use this filter to prevent deception when the volatility is not present, and if you are out of the filter, you can use the above sign.
By trading in accordance, you can invest in trend-follow tiles while avoiding losses in range markets.
○ Bolinger bands generally display six of ±1σ, ±2σ and ±3σ, but in this indicator, two are inside ±1σ and two are outside ±3σ.
We have added a total of four bands.The former sets up early entries and the latter sets up new reverse positions, expecting a market shift from overheating.
for tips on how to
○ Expansion period (expansion period) due to characteristics of the Bollinger band is a period when volatility is big for trade, and a squeeze period
(Shrinking period) I understand that the volatility is small and it is not suitable for trade.Also, it's a squeeze period, but it's not
You can seize investment opportunities by making you expect the timing to move from contraction to expansion and by watching.
※Valid time difference by series
Multi Time : 1 minute, 5 minutes, 15 minutes, 30 minutes 1 Hour, 4 Hour, Daily, Week (Total 8 Hours)
Long Time Span : 1 hour, 4 hour, daily, 4 long-term
Short Time Span : 1 minute, 5 minutes, 15 minutes, 30 minutes
Trial (1n & 1h) : 1 min.
※See here for details of the indicator and how to use it.
★ for "Indicator Grant" and "Market Analysis Information and Indicator Signature Distribution Service" by LINE Group (for a fee)
If you wish, please send a message on private chat


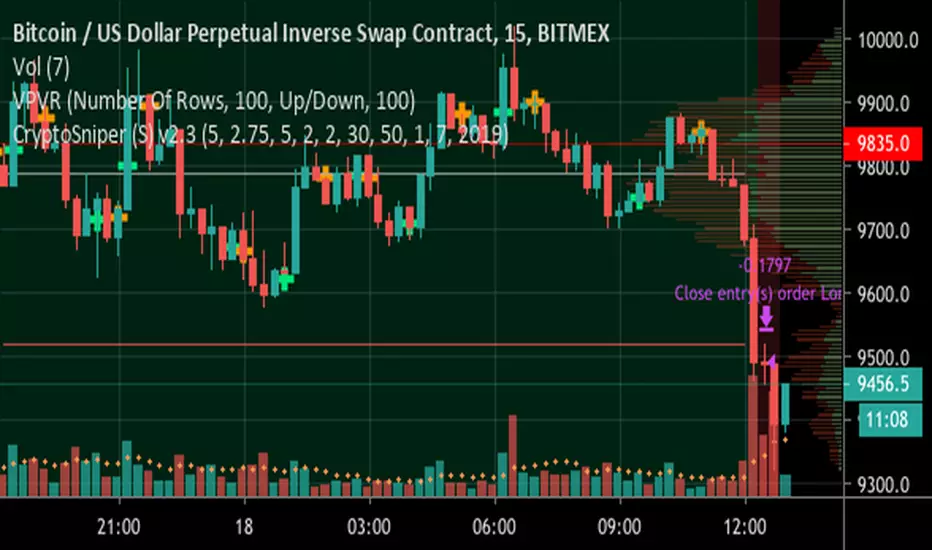
ck - CryptoSniper (Strategy) v2.1This strategy is radically different to the v1 script previously released.
It has ***NO REPAINTING*** - as such the algorithm had to change to remove it’s reliance on HMAs from future timeframes to establish trend, this is now accomplished with EMAs.
It is completely written in Pinescript v4.
It has integrated Stoploss and you can plot this & with the recommended Entry on the chart.
WARNING - This strategy has to be “tuned” to the instrument you are trading, for example, Bitcoin. The default settings work well for BTC/USD, XBT/USD on 15m chart timeframe but not for ETH/USD - it is possible the default settings will work with other crypto’s but I haven’t had time to test - if you find good settings PLEASE share them!
How to use:
1) Load up your favourite chart/instrument and select your favourite timeframe
2) Adjust the “signal” EMA and “baseline” EMA settings until you get the majority of uptrending moves highlighted with a green background and the majority of downtrending moves with a red background. The signal has to be faster (that is a lower number) than the baseline.
3) Adjust the “Sensitivity” - this will plot more green & orange Trigger points on the chart.
The strategy waits until in a trend, for example, a Long (green background) then waits for first green cross before opening a deal. It will Trigger a sell if the background turns red (downtrend) and a orange cross is printed.
4) Fine tuning:
A) Increase your profits by changing the Stoploss value - getting this right protects you from bad trades but also resets the indicator to provide another alert faster
B) You can increase the delay positions are opened or closed with the “Bar(s) offset to open position” and “Bar(s) offset to close position” settings. When you adjust these, 0 will buy/sell immediately when a Trigger cross is printed, 2 will wait until 2 bars/candles AFTER the Trigger cross prints to strat/close a position.
TIP: When adjusting indicator settings, load your chart and timeframe first.
Add the indicator/strategy (if you haven’t already).
Click the Strategy Tester tab at the bottom of the chart window so it is visible.
Open the strategy/indicator settings so you can see this wind AND the Strategy Tester display
Change a setting and click into a different setting input box, this will update the test results WITHOUT closing the settings window! This will save you a lot of time!
Write down any OK settings you find, you can come back later to fine tune them!
Please provide any feedback & let’s share the best settings for different crypto’s!
ck - CryptoSniper Longs Only (Strategy) v1Hey all,
This is a new script I have been working on and is in Beta testing stage.
It is best used for scalping 1/3/5/10/15 minutes.
Default settings are great for scalping, changing the “Period” will allow you to tweak for swing trades.
To use manually, you will get a Green triangle to alert you to be prepared to place an order.
This will happen 1 candle before the strategy paints an “open long” label on the chart.

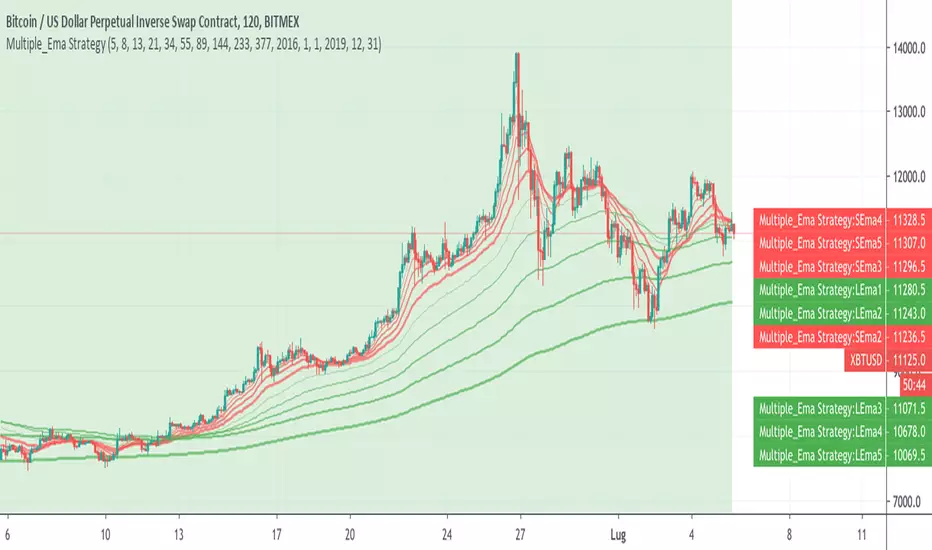
Multiple_Ema Strategyexponential moving averages for Long e Short Strategy
3, 4, and 5 cab be disabled by put team to zero
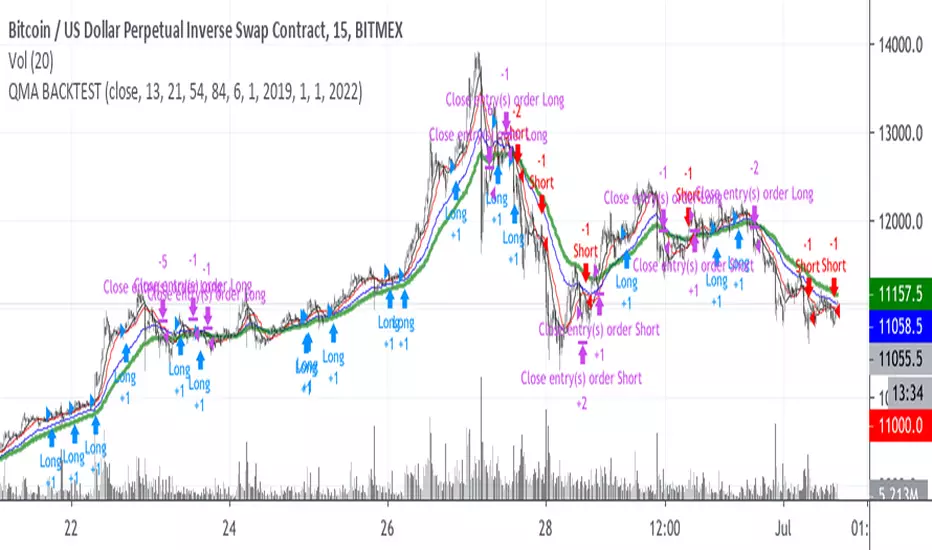
[M10] Quad MA Trend ScalperFour adjustable moving averages set in order to produce buy and sell signals, works best on smaller timeframes from my backtesting, 10M - 30M seems optimal for scalping.
The idea behind this script is to only enter positions that are following the trend in order to minimise drawdown and decrease risk when using leverage.
The script will only enter long positions when MA crossover occurs above the Long MA 2.
The script will exit a long position when MA Short crosses below Long MA 1.
The script will only enter short positions when MA cross under occurs below the Long MA 2.
The script will exit a short position when MA Short crosses below Long MA 1.

Ema BacktesterA simple, but useful script for backtesting purposes. Find the optimal Settings for your strategy.
tips are always welcome at: 38uGQJDDZDL6wX48x4gYTccPeQ3ZHVYmY4 (btc)
I hope you enjoy the script :)

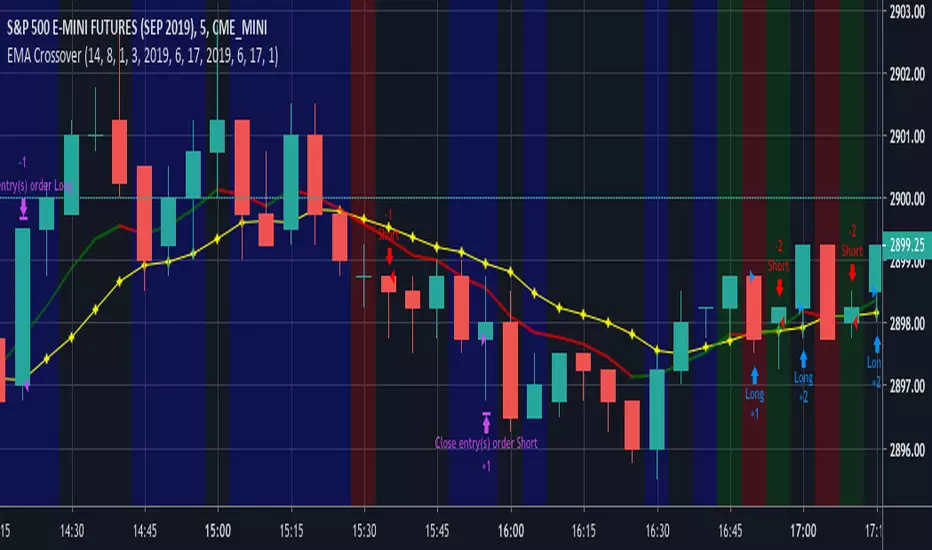
EMA CrossoverEMA Crossover
Input Parameters:
Stop loss (ticks) - define stop loss in unit of ticks (*1 tick = 12.5)
Exit signal - 1: When EMA and price crosses
2: When EMA changes direction
Start year, month, day & Stop year, month, day - define backtest period
You can set Order size, Commission in Settings, Properties tab.
Sniper & Strategy SniperTrading permite detectar los momentos exactos de compra y venta obteniendo un buen rendimiento.
Como aplicarlo:
* Realice una compra cuando el indicador de COMPRA aparezca en la pantalla.
* Realice una venta cuando el indicador de VENTA aparezca en la pantalla.

SW_55-EMA_STRAT//.SYNOPSIS
//.DESCRIPTION : REF - Philakone (@PhilakoneCrypto)
//.NOTES 55 EMA - Backtest
//.DATE 2/5/2019

Death & Golden Cross IndicatorThis script will plot three EMAs and give alerts for death cross and golden cross buy & sell strategy.
The death cross signals a possible shift in trend sentiment from bullish to bearish. Golden Cross signals a shift in a bearish trend to a bullish trend.
Death Cross = 50 Day EMA crosses under 100 Day EMA
Double Death Cross = 50 Day EMA crosses under 200 Day EMA
Golden Cross = 50 Day EMA crosses over 200 Day EMA
Moving Average Cross = 50 Day EMA crosses over 100 Day EMA
Entry Points:
Entry on Golden Cross & VWMA
Entry on 50 EMA Cross 100 EMA
Exit Points:
Exit on Death Cross, Double Death Cross, 200 Day EMA crosses under VWMA
Early Entry and Exit Points:
Uses 50 Day VWMA crossing with 200 Day EMA
As always, trade at your own risk. Best to confirm entry and exits with other strategies and oscillators.


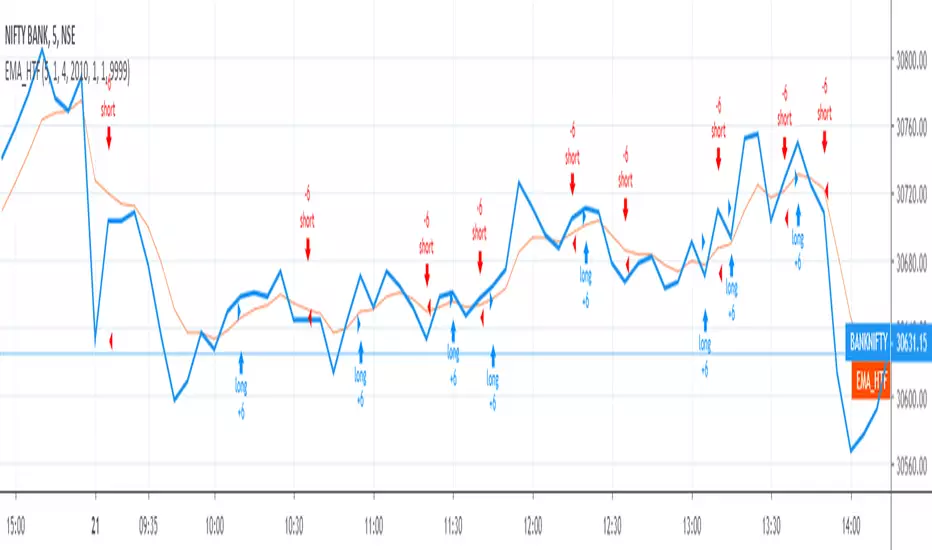
TradersVenue_EMA_StrategyHere long and shorts calls are triggered basis 9/21 EMA crossover. You can keep the nearest swing point high as stoploss for short trades and nearest swing point low for long trades.


Hucklekiwi Pip - HLHB Trend-Catcher SystemThe strategy was authored by Hucklekiwi Pip back in 2015 and is still being updated today. She says that the system was designed to simply catch short-term forex trends. At its heart, the system is a simple EMA crossover strategy with a couple of other indicators used for confirming entries.
Strategy Rules
See her original post here:
www.babypips.com
Be sure to check out the updates and tweaks over the years!
HOW TO USE
For full information on how to use this strategy and how to correctly set the exit time, see this post:
backtest-rookies.com

Custom Band Strategy1. Trend
if ema200 > ema30 Long entry only
else Short entry only
2. Custom Band
Upper band = sma(period) + max(close, period) * multiplier
Lower band = sma(period) - max(close, period) * multiplier
Multiplier can be either 1.3 or 1.1 depending on the trend.
(If trend is long, upper band's factor would be 1.3, lower band be 1.1)
2. Long entry condition
- Cross over the lower band and band width is greater than (close price)*2.2%(assume this band width as an expected ROE)
- Previous candle change rate((close-open)/open*100) is less than 3%.
3. Short entry condition
- Cross under the upper band and band width is greater than (close price)*2.2%
- Previous candle change rate is less than 3%.
4. Long/Short exit condition
- cross over/under the lower/upper band and roe is higher than 2%.
5. Stop/Target condition
- Target 10%, Stoploss 3%
- Previous candle change rate is higher than 3%.
Most variables can be set manually.
Test period changeable.

[pti]DAX 1H EMA BB Das Script funktioniert mit diesem Parametern NUR im DAX 1H.
Works ONLY in Ger30 1H!
Kein / No Stopp-Loss !

Tangram Bot 2 - SmartbotPrimeira Versão do Script Tangram Bot 2 da Smartbot para tradingview.
A intenção é agilizar e fazer um teste prévio e rápido do setup.
O resultado indicado aqui jamais corresponderá a um resultado real. É apenas uma ferramenta de estudo.
Ainda falta fazer e melhorar a parte de gestão de risco.
Caso queria fazer alguma sugestão ao cógido para melhorar a gestão de risco ou caso tenha encontrado algum erro, favor comunicar.
O tangram bot 2 combina o uso de até dez Indicadores de Análise Técnica com Gerenciamento de Risco (stop gain, stop loss, stop móvel, realização parcial, bloqueio de reversões, lucro máximo por dia e prejuízo máximo por dia) e Filtros Diversos (sentido das operações, uso do after-market, bloqueio de nova entrada após saída, hora inicial e hora final para negociação). São utilizados os indicadores Médias Móveis, HiLo Activator, MACD, ADX, Estocástico, VWAP, IFR, Bandas de Bollinger, Stop ATR e SAR Parabólico

Elliott strategyIt uses Elliott teory to shift two moving averages 8 positions (based on 5-3 fractal), and the crossing is close to reversions. And it keeps an eye on RSI level to be sure it is on hot level to sell/buy
