Zigzag Trend-based Color [SteinG]Zigzag Indicator with Trend-based Color Coding and Info Table
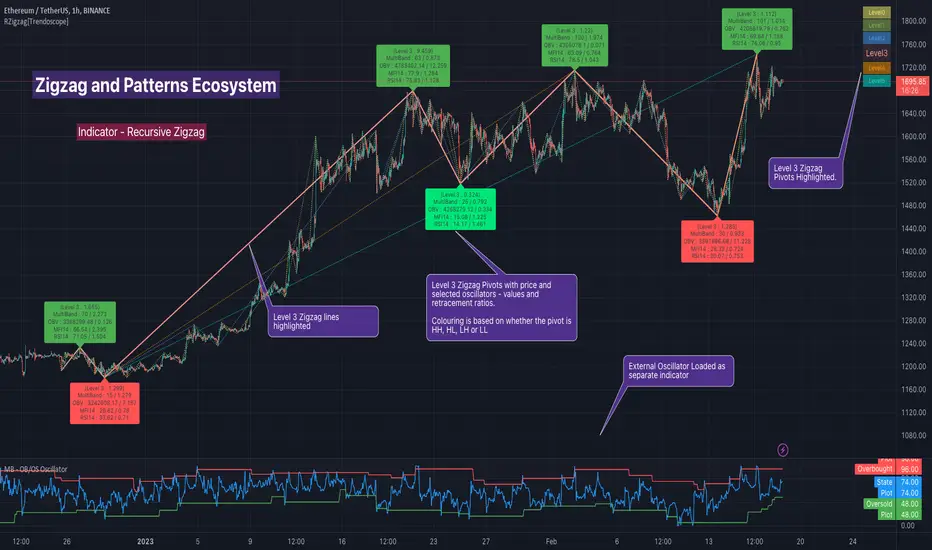
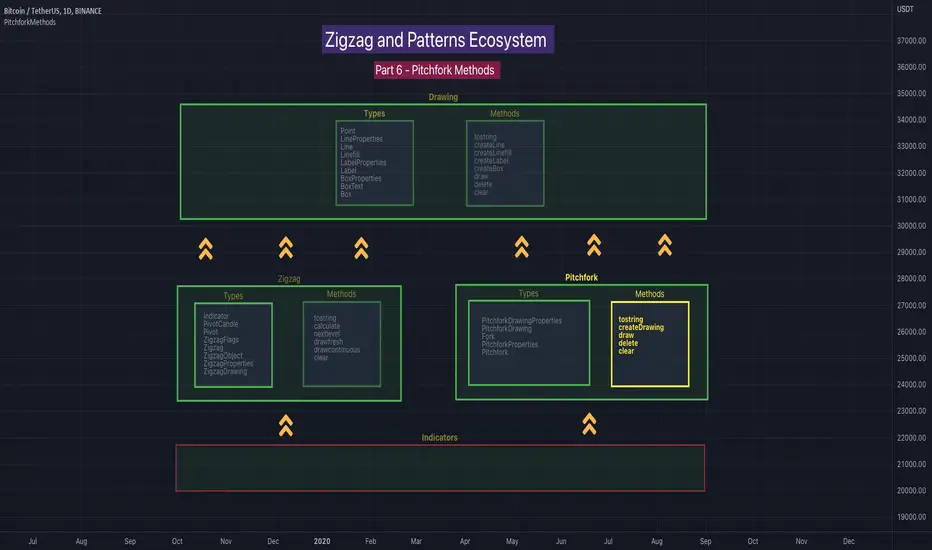
This indicator is forked from Trendoscope's Recursive Zigzag
The Zigzag Indicator with Trend-based Color Coding and Info Table is a powerful tool for technical analysis, designed to help you identify significant price swings, visualize trends, and analyze pivot points with ease. This advanced indicator offers enhanced functionalities and improved visual representation.
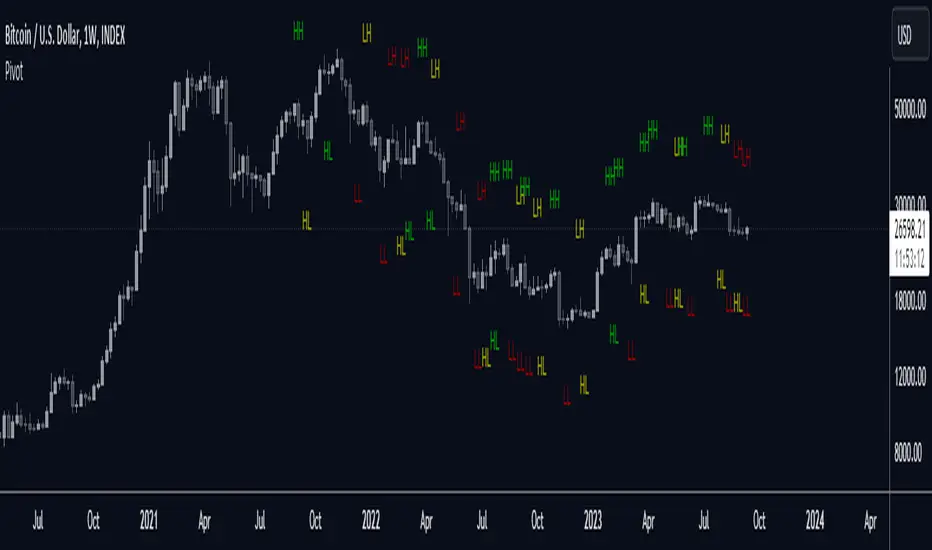
The primary purpose of the Zigzag Indicator is to identify and highlight important price reversals, commonly referred to as pivot points, in a given chart. These pivot points are essential in recognizing trend changes and potential market turning points. With the Zigzag Indicator, you can quickly identify these pivotal moments and gain valuable insights into market dynamics.
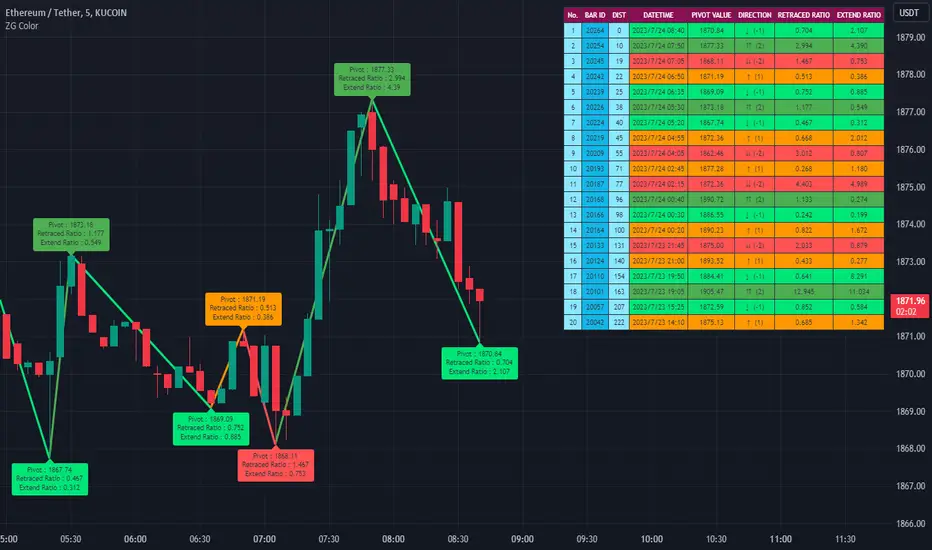
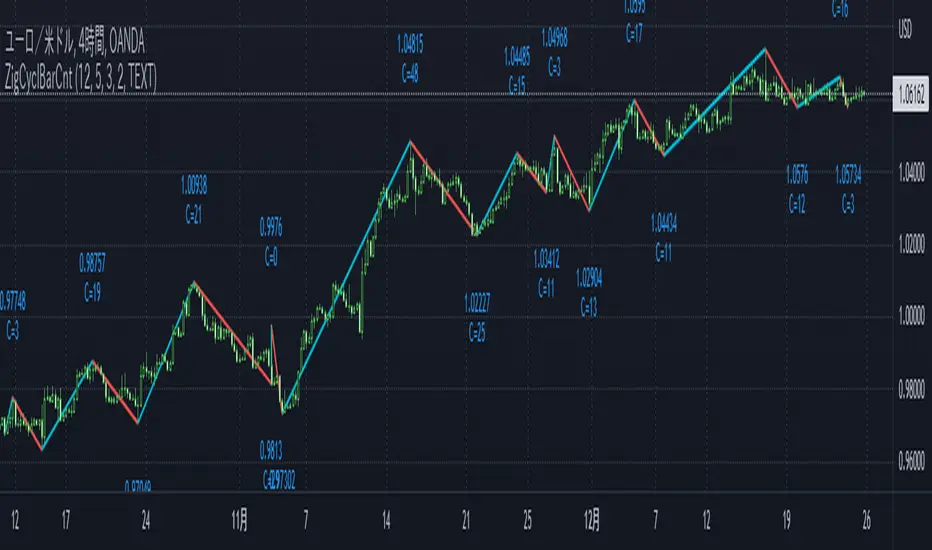
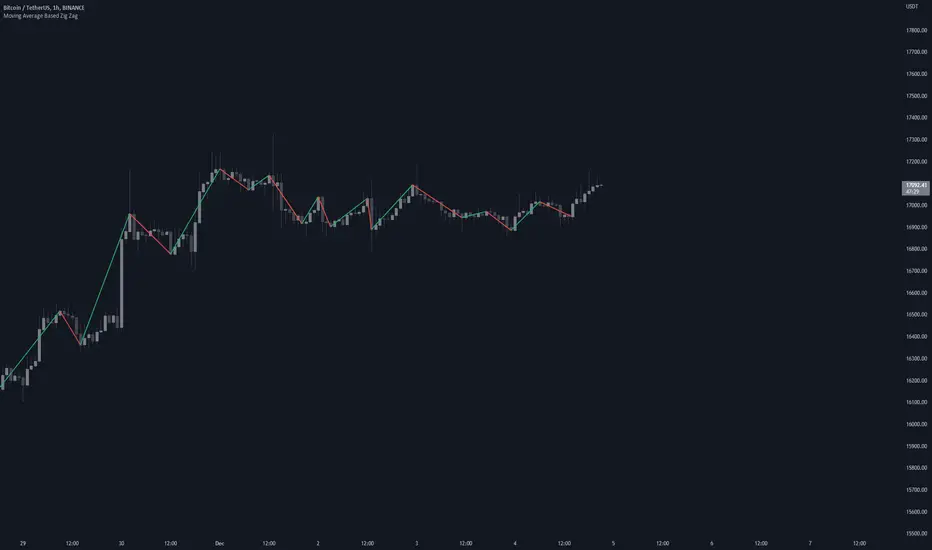
One of the standout features of this indicator is the color coding applied to the Zigzag line, which intuitively reflects the trend associated with each pivot point. The color scheme is as follows:
- Green : Indicates an upward trend, representing a bullish movement in the price.
- Lime : Represents a retracement during an upward trend, indicating a temporary pullback before the uptrend resumes.
- Red : Signifies a downward trend, indicating a bearish movement in the price.
- Orange : Represents a retracement during a downward trend, indicating a temporary bounce before the downtrend resumes.
This color coding allows you to easily visualize the prevailing market sentiment and make more informed trading decisions accordingly.
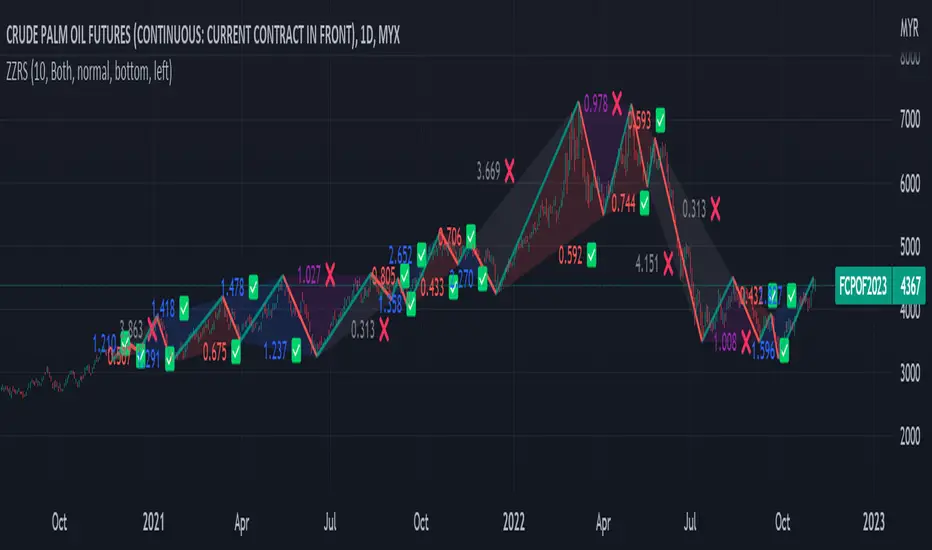
In addition to the visual representation, the Zigzag Indicator also includes an informative table that provides essential details about each pivot point. The table presents the following information for each pivot point:
1. Pivot Value : The price level at which the pivot point occurs.
2. Direction : Indicates whether the pivot point represents an upward or downward trend.
3. Fibo Ratios : Displays the Fibonacci retracement levels between two consecutive pivot points, offering insights into potential support and resistance levels.
The inclusion of this comprehensive info table enables you to analyze pivot points more effectively, understand the underlying price dynamics, and identify key trading opportunities.
Pine Script® 인디케이터