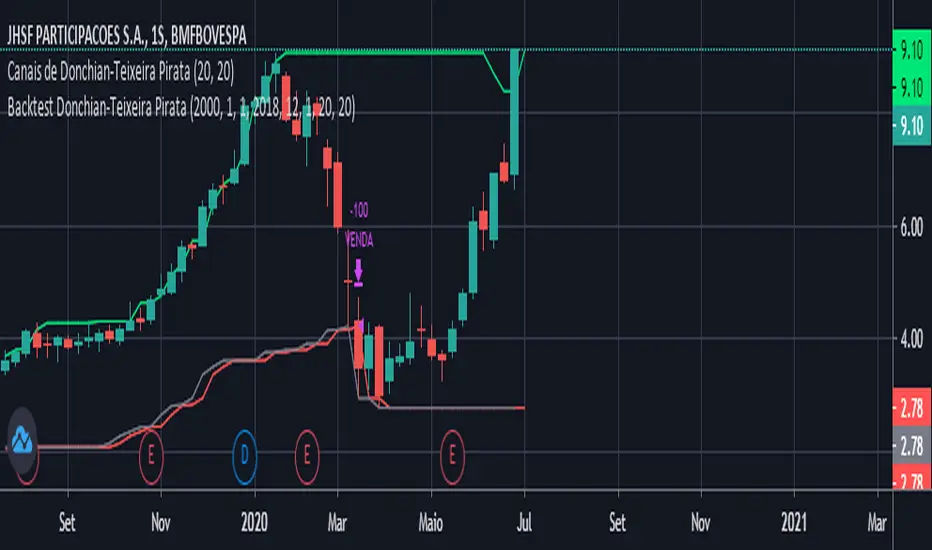
Donchian Channels Strategy - Long Term TrendFor Educational Purposes. Results can differ on different markets and can fail at any time. Profit is not guaranteed.
This only works in a few markets and in certain situations. Changing the settings can give better or worse results for other markets. This is a longer term trend following strategy that uses Donchian Channels for trend following and uses the upper and lower bands to find price breakouts to enter the market and then uses the middle band as a trailing stop to exit. DCs are known as the original trend following strategy made by Richard Donchian.
Usually the middle band uses the same length of the upper and lower bands in its calculation but I included the default option of using a middle band that is double the length of the other bands, but also an option to use the regular input length that most Donchian strategies use if needed. If long term trends are somehow found, this longer middle band lets the profits run longer and lets you see where the long trends were at if the market had any. The double lengthed middle band looks surprisingly very similar to a 3x ATR trailing stop, which is the recommended setting Wilder suggested for trend following. If a good ATR stop or other trailing stop can't be found, this longer middle band can act as a substitute for it.
For some reason I can't seem to find anything related to Donchian strategies on here despite the popularity and simplicity of it, not even a single working one to my liking, so I made my own. It seems this strategy only works in trending markets. I intentionally handpicked a market that the backtest does well on to illustrate the potential it might have for other markets where trending following strategies might work on and what to expect the results in those might be. Trend following strategies are said to have high profits but at the same time lower accuracy due to the failure rate of being able to catch the right trend. If you all got any suggestions or feedback please let me.
돈치안 채널 (DC)

Lagged Donchian Channel + EMAThis strategy is based on a lagged 24 periods Donchian Channel and a 200 periods EMA .
The enter positions are calculated this way :
Bull entry
1. we wait for the close of a candle below the channel and it must be below the 200 EMA
2. the following candle must be a green one and close in the lagged channel
3. we put a long order at the close of the second candle, a stop loss at the low of last 3 candles and a x3 take profit
Bear entry
1. we wait for the close of a candle above the channel and it must be above the 200 EMA
2. the following candle must be a red one and close in the lagged channel
3. we put a short order at the close of the second candle, a stop loss at the high of last 3 candles and a x3 take profit
For both long or short positions :
If the order is not filled, it's cancelled if the price reach 50% of the TP or if the price reach the stop loss level
The position is closed if a new bear/bull condition appears in the other side of the position (if a bear appears when you're long and inversement)
Features :
Position calculator's included with leverage option
Labels of position can be plotted or not
Bull/Bear channels can be plotted with red and green filled
All parameters can be changed for backtesting
Better results have been got with defaults parameters on LTCUSDTPERP in H1 timeframe => profit factor of 2.84 with almost 100 positions.
Hope this strategy will be useful and it would be cool if I could get feedback, comments or better combinations of parameters !!
Don't hesitate to like and leave a comment ;)
@Mysteriown

Channel Break [for free bot]I present to you a script for testing the channel breakout strategy for the Bitmex exchange.
Cryptocurrency itself is a trending tool, which is why breakout strategies generate the largest profits, and the channel breakout strategy is one of the most effective trend strategies.
The optimization result shows the result of trading on a volume of 20% of the deposit. But since Bitmex trades in futures contracts, you can use 50%, 100% and even much more, depending on your attitude to risk.
At the time of publication on the Bitmex exchange there are 12 different contracts, i.e. You can diversify your trading well (by pre-optimizing the settings for each contract).
In the script, you can set up many trading options - timeframe, periods for buying and selling, method of exiting a trade, stop loss, take profit, risk management, etc.
Thus, you create a strategy "for yourself".
Представляю Вам скрипт для тестирования стратегии пробоя канала для биржи Битмекс.
Криптовалюта, сама по себе является трендовым инструментом, именно поэтому, пробойные стратегии генерируют самую большую прибыль, а стратегия пробоя канала – является одной из самых эффективных трендовых стратегий.
На результате оптимизации показан результат торговли на объеме в 20% от депозита. Но так как на Битмекс торговля идет фьючерсными контрактами, Вы можете использовать 50%, 100% и даже намного больше, в зависимости от Вашего отношения к риску.
На момент публикации на бирже Битмекс есть 12 разных контрактов, т.е. Вы можете хороши диверсифицировать свою торговлю (предварительно оптимизируя настройки по каждый контракт).
В скрипте Вы можете настроить множество вариантов торговли - таймфрейм, периоды для покупки и продажи, метод выхода из сделки, стоп-лосс, тейк-профит, рискменеджмент и т.п.
Таким образом Вы создаете стратегию "под себя".

Donchian Strat EXMOThis is simple test of Turtle Trading strategy by Richard Dennis. The script meant to place orders on Donchian Channel borders. It's best to test and use on mid-term charts like 1H and more.
I've chosen Kraken XBT/USDT chart because this market opened in december 2019. The main problem of crypto trading strategy testing is the bullish market of 2017 year. That enormous growth gives unrealisting expectations to all trend-following strategies tested.

Donchian Channel StrategyLong and Short entries based on the Donchian Channel indicator. The entry can be set to Higher High/Lower Low or the basis line.

Combo Backtest 123 Reversal & Donchian Channel Width This is combo strategies for get a cumulative signal.
First strategy
This System was created from the Book "How I Tripled My Money In The
Futures Market" by Ulf Jensen, Page 183. This is reverse type of strategies.
The strategy buys at market, if close price is higher than the previous close
during 2 days and the meaning of 9-days Stochastic Slow Oscillator is lower than 50.
The strategy sells at market, if close price is lower than the previous close price
during 2 days and the meaning of 9-days Stochastic Fast Oscillator is higher than 50.
Second strategy
The Donchian Channel was developed by Richard Donchian and it could be compared
to the Bollinger Bands. When it comes to volatility analysis, the Donchian Channel
Width was created in the same way as the Bollinger Bandwidth technical indicator was.
As was mentioned above the Donchian Channel Width is used in technical analysis to measure
volatility. Volatility is one of the most important parameters in technical analysis.
A price trend is not just about a price change. It is also about volume traded during this
price change and volatility of a this price change. When a technical analyst focuses his/her
attention solely on price analysis by ignoring volume and volatility, he/she only sees a part
of a complete picture only. This could lead to a situation when a trader may miss something and
lose money. Lets take a look at a simple example how volatility may help a trader:
Most of the price based technical indicators are lagging indicators.
When price moves on low volatility, it takes time for a price trend to change its direction and
it could be ok to have some lag in an indicator.
When price moves on high volatility, a price trend changes its direction faster and stronger.
An indicator's lag acceptable under low volatility could be financially suicidal now - Buy/Sell signals could be generated when it is already too late.
Another use of volatility - very popular one - it is to adapt a stop loss strategy to it:
Smaller stop-loss recommended in low volatility periods. If it is not done, a stop-loss could
be generated when it is too late.
Bigger stop-loss recommended in high volatility periods. If it is not done, a stop-loss could
be triggered too often and you may miss good trades.
WARNING:
- For purpose educate only
- This script to change bars colors.

Donchain BreakoutIt is a long only strategy.
1. Buy when price breaks out of the upper band.
2. Exit has two options. Option 1 allows you to exit using lower band. Option 2 allows you to exit using basis line.
3. Slippage and commissions are not considered in the return calculation.

Donchian Breakout StrategyThis strategy buys when the Donchian Channel is broken to the upside and uses the lower Donchian Channel line as a trailing stop. You can also choose to use a moving average as a filter to keep you out of trades that are counter trend.
You can also configure which dates you want to backtest, so you can see how this behaves over specific time frames and market cycles.

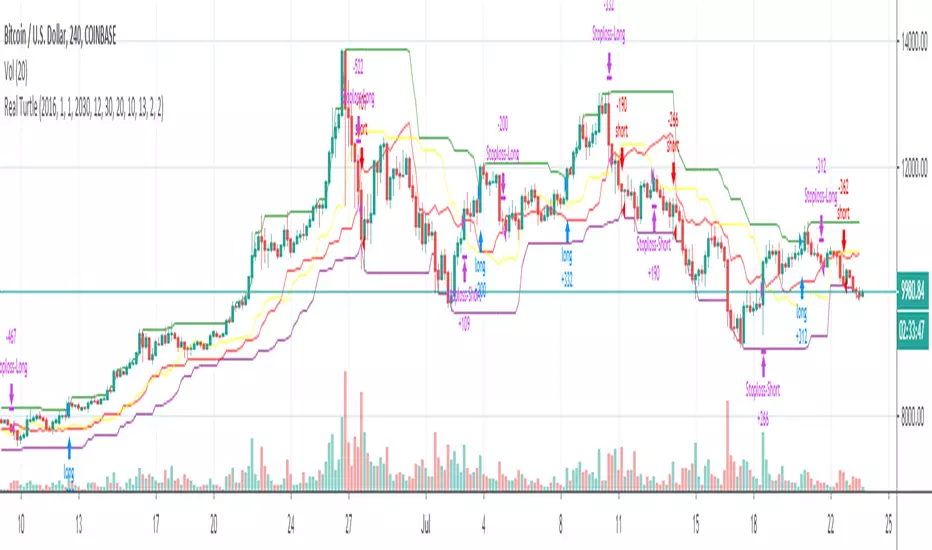
Real TurtleThere are a few different attempts at the turtle strategy on here, but none that I have seen thus far correctly follow the strategy as I know it. This version uses a stop order to trail out of the position by moving the stop order to match the exit channel or stoploss as the N*2( ema of True Range * 2). This version of turtle strategy also uses stop orders for entry on either side in order to enter at optimal time. The ability to specify a backtest period was borrowed from another script, I grabbed it so long ago I no longer remember from whom i borrowed it, if it was yours I will credit you if you PM me.
This version unlike others also allows you to specify a risk % so you only risk that percentage of your equity in a trade, as calculated from your stoploss.
Disclaimer: I have published several scripts in the past when i was first learning pinescript and they are all horrible please ignore those. I would delete them, but TV doesn't allow you to delete.

Donchian Channel TestingConditions:
1. Centre line above close long entry, exit centre line below close.
2. Centre line below close short entry, exit centre line below close.
3. But For now I coded like Long Exit becomes entry for Short and vice versa
Have to further Update
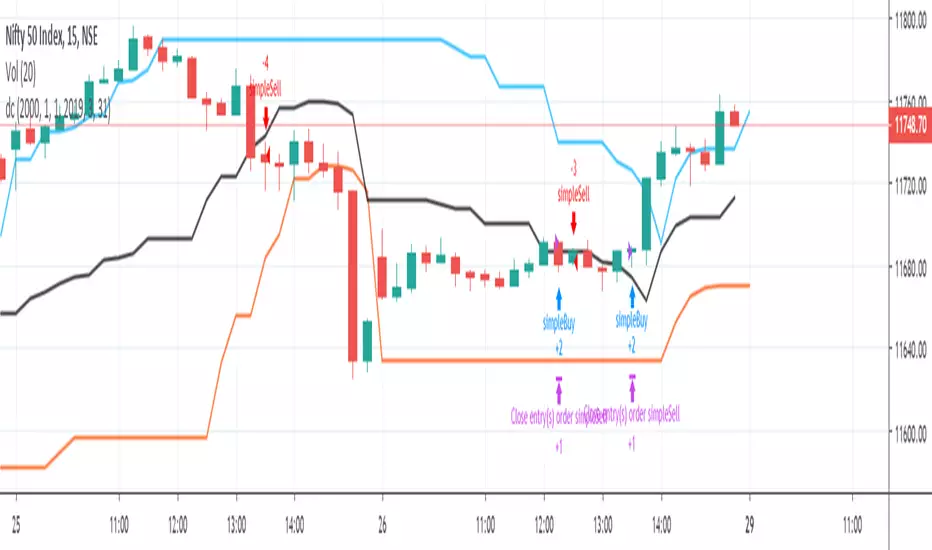
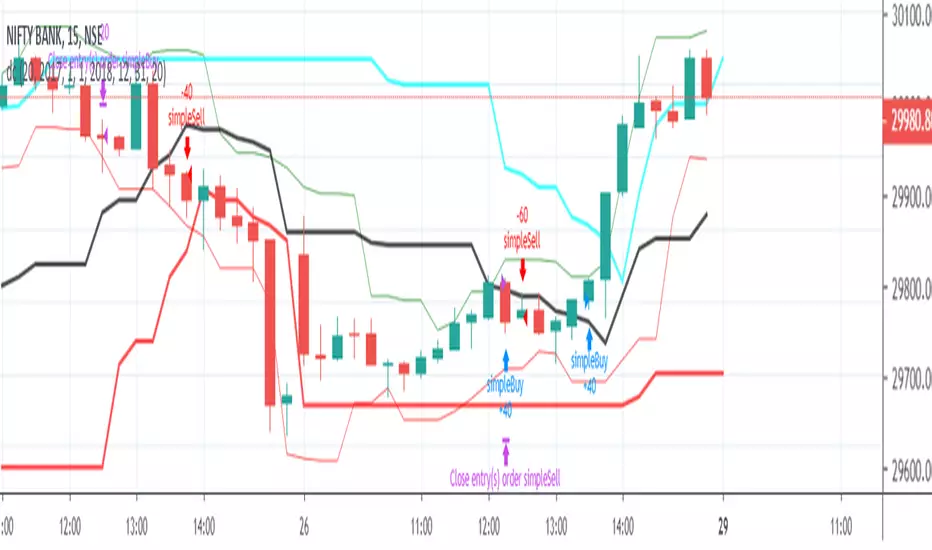
donchian channelssimple donchian channels strategy. can be modified for long or short, futures / equities / crypto / forex
Donchian Channel Width Strategy The Donchian Channel was developed by Richard Donchian and it could be compared
to the Bollinger Bands. When it comes to volatility analysis, the Donchian Channel
Width was created in the same way as the Bollinger Bandwidth technical indicator was.
You can change long to short in the Input Settings
WARNING:
- For purpose educate only
- This script to change bars colors.

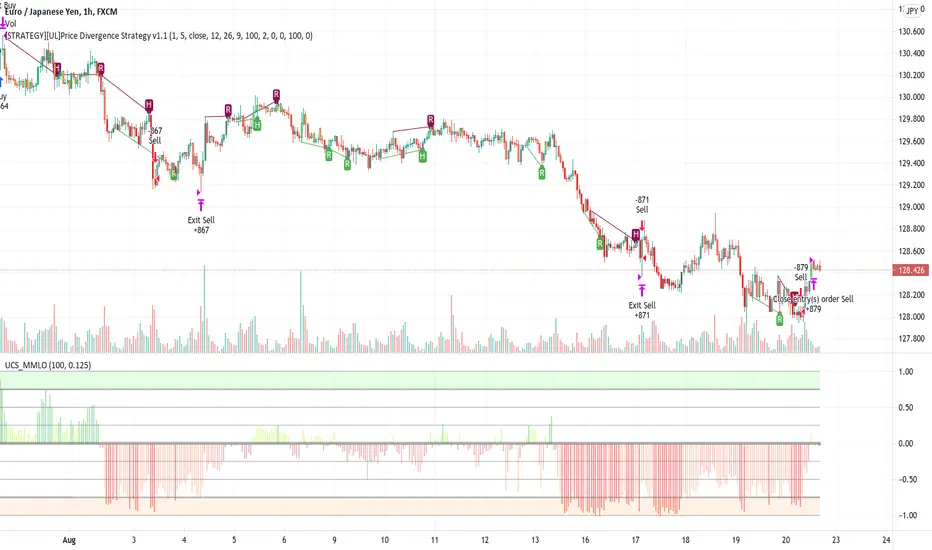
[STRATEGY][UL]Price Divergence Strategy v1.0Created by Request: This is a trend trading strategy that uses Price Divergence detection signals that are confirmed by the "Murrey's Math Oscillator" (Donchanin Channel based).
Strategy Code Based on:
Price Divergence Detector V2 by RicardoSantos
UCS_Murrey's Math Oscillator by Ucsgears
Strategy Risk Management Based on:
Strategy Code Example by JayRogers
Information on Divergence Trading:
- www.babypips.com
*** USE AT YOUR OWN RISK ***