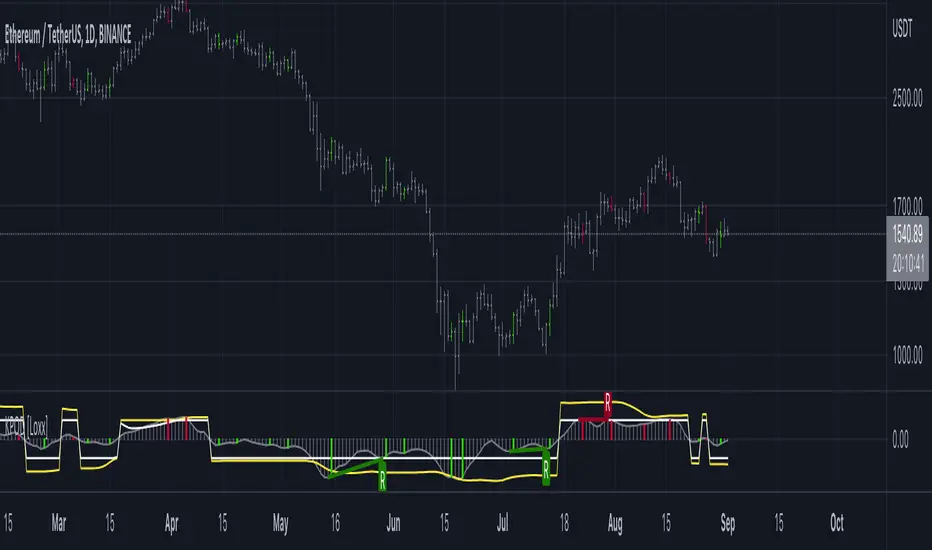
Kase Peak Oscillator w/ Divergences [Loxx]Kase Peak Oscillator is unique among first derivative or "rate-of-change" indicators in that it statistically evaluates over fifty trend lengths and automatically adapts to both cycle length and volatility. In addition, it replaces the crude linear mathematics of old with logarithmic and exponential models that better reflect the true nature of the market. Kase Peak Oscillator is unique in that it can be applied across multiple time frames and different commodities.
As a hybrid indicator, the Peak Oscillator also generates a trend signal via the crossing of the histogram through the zero line. In addition, the red/green histogram line indicates when the oscillator has reached an extreme condition. When the oscillator reaches this peak and then turns, it means that most of the time the market will turn either at the present extreme, or (more likely) at the following extreme.
This is both a reversal and breakout/breakdown indicator. Crosses above/below zero line can be used for breakouts/breakdowns, while the thick green/red bars can be used to detect reversals
The indicator consists of three indicators:
The PeakOscillator itself is rendered as a gray histogram.
Max is a red/green solid line within the histogram signifying a market extreme.
Yellow line is max peak value of two (by default, you can change this with the deviations input settings) standard deviations of the Peak Oscillator value
White line is the min peak value of two (by default, you can change this with the deviations input settings) standard deviations of the PeakOscillator value
The PeakOscillator is used two ways:
Divergence: Kase Peak Oscillator may be used to generate traditional divergence signals. The difference between it and traditional divergence indicators lies in its accuracy.
PeakOut: The second use is to look for a Peak Out. A Peak Out occurs when the histogram breaks beyond the PeakOut line and then pulls back. A Peak Out through the maximum line will be displayed magenta. A Peak Out, which only extends through the Peak Min line is called a local Peak Out, and is less significant than a normal Peak Out signal. These local Peak Outs are to be relied upon more heavily during sideways or corrective markets. Peak Outs may be based on either the maximum line or the minimum line. Maximum Peak Outs, however, are rarer and thus more significant than minimum Peak Outs. The magnitude of the price move may be greater following the maximum Peak Out, but the likelihood of the break in trend is essentially the same. Thus, our research indicates that we should react equally to a Peak Out in a trendy market and a Peak Min in a choppy or corrective market.
Included:
Bar coloring
Alerts
Divergences
KDJ [JoseMetal]============
ENGLISH
============
- Description:
This indicator is a modification of the common KDJ, as you may know the KDJ is just a Stochastic (K+D) with an extra line which is J, the J line can be used as "movement strength" filter and also for overbought and oversold conditions anticipating the K and D.
In this particular modification I've tested many different settings to find the best possible ones, it also has customizable MA type for the calculation and a histogram calculated with the difference between J and D, this is useful to spot divergences and determine trend strength easily, the histogram has a smooth option to make it even more clearer.
- Visual:
So you have K and D from the Stochastic (green and red lines) as well as the J line (white).
Then you have the histogram to show the difference between J and D, the histogram has a similar color scale as a MACD to determine the strength of the trend easily, lighter = stronger, darker = weaker, there are 2 default customizable color setups by the way.
Crossovers between lines (which generates LONG and SHORT entries) are presented with a DOT (green for long and red for short).
Background color also changes, green for bullish, red for bearish, crossovers also marks the background color even more.
- Customization:
As usual in my indicators, everything is customizable, you can pick yours, settings, colors, figures etc.
- Usage and recommendations:
I've tested many different setting setups, for now, the best are the default (14, 21, 21) for the KDJ and (7) for the histogram smooth, 20 and 80 for oversold and overbought levels.
Histogram is great to spot divergences, I recommend to wait for a divergence on a 4H timeframe and wait for the LONG or SHORT signal to appear to enter a trade in the divergence direction.
Enjoy!
============
ESPAÑOL
============
- Descripción:
Éste indicador es una modificación del KDJ común, como sabrás el KDJ es solo un estocástico (K+D) con una línea extra que es la J, la línea J puede ser usada como filtro de "fuerza de movimiento" y también para condiciones de sobrecompra y sobreventa anticipando la K y la D.
En esta modificación en particular he probado muchas configuraciones diferentes para encontrar las mejores posibles, también tiene un tipo de MA personalizable para el cálculo y un histograma calculado con la diferencia entre J y D, esto es útil para detectar divergencias y determinar la fuerza de la tendencia fácilmente, el histograma tiene una opción suave para hacerlo aún más claro.
- Visual:
Por lo tanto, tenemos por un lado la K y D del estocástico (líneas verde y roja), así como la línea J (blanco).
Luego tenemos el histograma para mostrar la diferencia entre J y D, el histograma tiene una escala de colores similar a la del MACD para determinar la fuerza de la tendencia fácilmente, más claro = más fuerte, más oscuro = más débil, hay 2 escalas de color personalizables por defecto.
Los cruces entre líneas (que generan entradas LARGAS y CORTAS) se presentan con un PUNTO (verde para LARGO y rojo para CORTO).
El color de fondo también cambia, verde para alcista, rojo para bajista, los cruces también resaltan el color de fondo aún más.
- Personalización:
Como es habitual en mis indicadores, todo es personalizable, puedes elegir los tuyos, ajustes, colores, figuras, etc.
- Uso y recomendaciones:
He probado muchas configuraciones diferentes, por ahora, las mejores son las predeterminadas (14, 21, 21) para el KDJ y (7) para el histograma suave, 20 y 80 para los niveles de sobreventa y sobrecompra.
El histograma es excelente para detectar divergencias, recomiendo esperar una divergencia en un marco de tiempo de 4H y esperar a que aparezca la señal de LARGO o CORTO para entrar en una operación en la dirección de la divergencia.
¡Que lo disfrutéis!

MACD DivergencesUpdate of MACD indicator which shows the most recent, and developing, price action divergences with the histogram.

CFB-Adaptive, Williams %R w/ Dynamic Zones [Loxx]CFB-Adaptive, Williams %R w/ Dynamic Zones is a Jurik-Composite-Fractal-Behavior-Adaptive Williams % Range indicator with Dynamic Zones. These additions to the WPR calculation reduce noise and return a signal that is more viable than WPR alone.
What is Williams %R?
Williams %R , also known as the Williams Percent Range, is a type of momentum indicator that moves between 0 and -100 and measures overbought and oversold levels. The Williams %R may be used to find entry and exit points in the market. The indicator is very similar to the Stochastic oscillator and is used in the same way. It was developed by Larry Williams and it compares a stock’s closing price to the high-low range over a specific period, typically 14 days or periods.
What is Composite Fractal Behavior ( CFB )?
All around you mechanisms adjust themselves to their environment. From simple thermostats that react to air temperature to computer chips in modern cars that respond to changes in engine temperature, r.p.m.'s, torque, and throttle position. It was only a matter of time before fast desktop computers applied the mathematics of self-adjustment to systems that trade the financial markets.
Unlike basic systems with fixed formulas, an adaptive system adjusts its own equations. For example, start with a basic channel breakout system that uses the highest closing price of the last N bars as a threshold for detecting breakouts on the up side. An adaptive and improved version of this system would adjust N according to market conditions, such as momentum, price volatility or acceleration.
Since many systems are based directly or indirectly on cycles, another useful measure of market condition is the periodic length of a price chart's dominant cycle, (DC), that cycle with the greatest influence on price action.
The utility of this new DC measure was noted by author Murray Ruggiero in the January '96 issue of Futures Magazine. In it. Mr. Ruggiero used it to adaptive adjust the value of N in a channel breakout system. He then simulated trading 15 years of D-Mark futures in order to compare its performance to a similar system that had a fixed optimal value of N. The adaptive version produced 20% more profit!
This DC index utilized the popular MESA algorithm (a formulation by John Ehlers adapted from Burg's maximum entropy algorithm, MEM). Unfortunately, the DC approach is problematic when the market has no real dominant cycle momentum, because the mathematics will produce a value whether or not one actually exists! Therefore, we developed a proprietary indicator that does not presuppose the presence of market cycles. It's called CFB (Composite Fractal Behavior) and it works well whether or not the market is cyclic.
CFB examines price action for a particular fractal pattern, categorizes them by size, and then outputs a composite fractal size index. This index is smooth, timely and accurate
Essentially, CFB reveals the length of the market's trending action time frame. Long trending activity produces a large CFB index and short choppy action produces a small index value. Investors have found many applications for CFB which involve scaling other existing technical indicators adaptively, on a bar-to-bar basis.
What is Jurik Volty used in the Juirk Filter?
One of the lesser known qualities of Juirk smoothing is that the Jurik smoothing process is adaptive. "Jurik Volty" (a sort of market volatility ) is what makes Jurik smoothing adaptive. The Jurik Volty calculation can be used as both a standalone indicator and to smooth other indicators that you wish to make adaptive.
What is the Jurik Moving Average?
Have you noticed how moving averages add some lag (delay) to your signals? ... especially when price gaps up or down in a big move, and you are waiting for your moving average to catch up? Wait no more! JMA eliminates this problem forever and gives you the best of both worlds: low lag and smooth lines.
Ideally, you would like a filtered signal to be both smooth and lag-free. Lag causes delays in your trades, and increasing lag in your indicators typically result in lower profits. In other words, late comers get what's left on the table after the feast has already begun.
What are Dynamic Zones?
As explained in "Stocks & Commodities V15:7 (306-310): Dynamic Zones by Leo Zamansky, Ph .D., and David Stendahl"
Most indicators use a fixed zone for buy and sell signals. Here’ s a concept based on zones that are responsive to past levels of the indicator.
One approach to active investing employs the use of oscillators to exploit tradable market trends. This investing style follows a very simple form of logic: Enter the market only when an oscillator has moved far above or below traditional trading lev- els. However, these oscillator- driven systems lack the ability to evolve with the market because they use fixed buy and sell zones. Traders typically use one set of buy and sell zones for a bull market and substantially different zones for a bear market. And therein lies the problem.
Once traders begin introducing their market opinions into trading equations, by changing the zones, they negate the system’s mechanical nature. The objective is to have a system automatically define its own buy and sell zones and thereby profitably trade in any market — bull or bear. Dynamic zones offer a solution to the problem of fixed buy and sell zones for any oscillator-driven system.
An indicator’s extreme levels can be quantified using statistical methods. These extreme levels are calculated for a certain period and serve as the buy and sell zones for a trading system. The repetition of this statistical process for every value of the indicator creates values that become the dynamic zones. The zones are calculated in such a way that the probability of the indicator value rising above, or falling below, the dynamic zones is equal to a given probability input set by the trader.
To better understand dynamic zones, let's first describe them mathematically and then explain their use. The dynamic zones definition:
Find V such that:
For dynamic zone buy: P{X <= V}=P1
For dynamic zone sell: P{X >= V}=P2
where P1 and P2 are the probabilities set by the trader, X is the value of the indicator for the selected period and V represents the value of the dynamic zone.
The probability input P1 and P2 can be adjusted by the trader to encompass as much or as little data as the trader would like. The smaller the probability, the fewer data values above and below the dynamic zones. This translates into a wider range between the buy and sell zones. If a 10% probability is used for P1 and P2, only those data values that make up the top 10% and bottom 10% for an indicator are used in the construction of the zones. Of the values, 80% will fall between the two extreme levels. Because dynamic zone levels are penetrated so infrequently, when this happens, traders know that the market has truly moved into overbought or oversold territory.
Calculating the Dynamic Zones
The algorithm for the dynamic zones is a series of steps. First, decide the value of the lookback period t. Next, decide the value of the probability Pbuy for buy zone and value of the probability Psell for the sell zone.
For i=1, to the last lookback period, build the distribution f(x) of the price during the lookback period i. Then find the value Vi1 such that the probability of the price less than or equal to Vi1 during the lookback period i is equal to Pbuy. Find the value Vi2 such that the probability of the price greater or equal to Vi2 during the lookback period i is equal to Psell. The sequence of Vi1 for all periods gives the buy zone. The sequence of Vi2 for all periods gives the sell zone.
In the algorithm description, we have: Build the distribution f(x) of the price during the lookback period i. The distribution here is empirical namely, how many times a given value of x appeared during the lookback period. The problem is to find such x that the probability of a price being greater or equal to x will be equal to a probability selected by the user. Probability is the area under the distribution curve. The task is to find such value of x that the area under the distribution curve to the right of x will be equal to the probability selected by the user. That x is the dynamic zone.
Included:
Bar coloring
3 signal variations w/ alerts
Divergences w/ alerts
Loxx's Expanded Source Types

PPO w/ Discontinued Signal Lines [Loxx]PPO w/ Discontinued Signal Lines is a Percentage Price Oscillator with some upgrades. This indicator has 33 source types and 35+ moving average types as well as Discontinued Signal Lines and divergences. These additions reduce noise and increase hit rate.
What is the Price Percentage Oscillator?
The percentage price oscillator (PPO) is a technical momentum indicator that shows the relationship between two moving averages in percentage terms. The moving averages are a 26-period and 12-period exponential moving average (EMA).
The PPO is used to compare asset performance and volatility, spot divergence that could lead to price reversals, generate trade signals, and help confirm trend direction.
Included:
Bar coloring
3 signal variations w/ alerts
Divergences w/ alerts
Loxx's Expanded Source Types
Loxx's Moving Averages

MACD Potential Divergence - FontiramisuIndicator showing potential momentum divergences on MACD Momentum.
The problem with the classic divergence is that when the signal appears, it is sometimes too late to enter a trade .
The potential divergence corrects this problem by signaling the beginning of a potential divergence .
MACD is a momentum indicator that offers relevant insights with divergences.
Potential divergences are indicated with the letter B and a red color for Bearish Div or Green color for Bullish Div .
Potential divergence is confirmed when the line and the label "Bear"' or "Bull" appear.
JG RSI/MFI/divergence IndicatorThis is a combination of
- RSI (relative strength index)
- MFI (money flow index)
- Divergences on the RSI
MFI behaves much the same as RSI but it more responsive/to some degree a leading indicator. I find it helps having this overlayed with RSI to help gauge price action and sentiment, as well as for confluence with RSI.
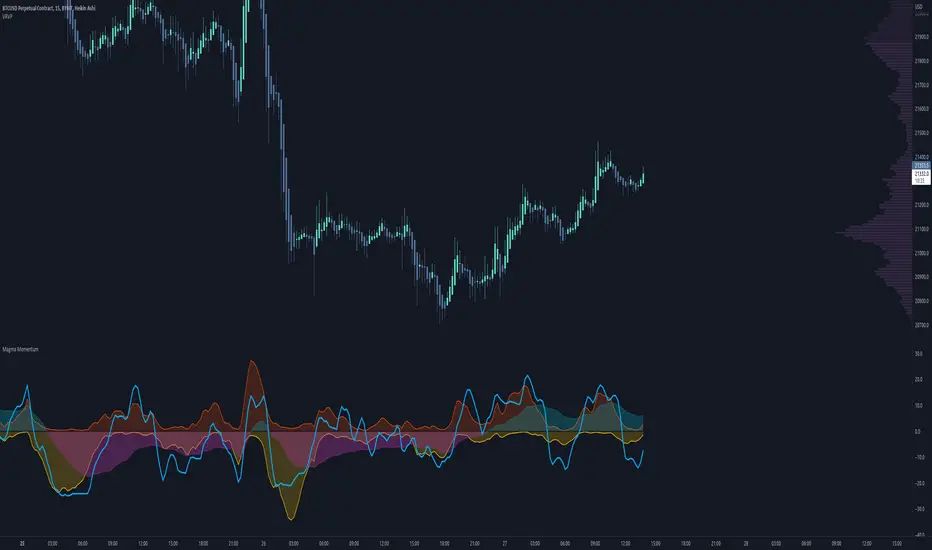
Magma MomentumThis is a simple and easy-to-read momentum indicator that can help you identify divergences and shifts in momentum.
A divergence is when price moves in one direction but the indicator moves in the opposite direction. This typically is a sign of price exhaustion and can indicate that price is about to reverse, at least momentarily.
Here is a comparison with RSI (relative strength index) and some examples of divergences.
Enjoy.
Pro Ecometrics [by @Amu_Arsalan] ✔ Intro
As a day trader, this is one of my main strategies to trade with, I have been developing this strategy last 6 months. this strategy helps me make great trades more confident. I wish this could help you make great trades as well
✔ OVERVIEW
This is a combination of linear regression for trend analysis and auto plot channel and divergences for 9 oscillators and indicators in 5 different candle range lookback.
✔ CONCEPTS
As a trader, you probably know how to trade with channels and trend lines, but we need more confirmation before we dive into a trade, Divergences are one of the most accurate and reliable confirmations for this purpose. So I combine these as a strategy. when I see a confluence in divergence signal and trend line (regression), it has a great chance to see a reversal.
✔ Divergences
Show both Bearish and Bullish Divergences fully detailed for normal and hidden divergences it plots a label with indicator names and its values that make this divergence occur. it could calculate divergences for 9 oscillators and indicators for 5 lookback periods.
✔ Trend Line
It has editable settings such as lookback period, source, and even color changing. by default, it makes a linear regression for the past 100 candles.

Bogdan Ciocoiu - MoonshotDescription
Moonshot is an indicator that encapsulates the value delivered by the TSI, MACD, Awesome Oscillator and CCI algorithms to produce signals to enable users to enter positions in ideal market conditions. Moonshot integrates the value delivered by the above four algorithms into one script.
This indicator is particularly useful when trading continuation/reversal divergence strategies.
Uniqueness
The Moonshot's uniqueness stands from integrating the above algorithms into the same visual area and leveraging preconfigured parameters suitable for 1-3 minute scalping techniques.
In addition, Moonshot allows swapping or furthermore configuring the above four algorithms in such a way to align signals by colour-coding or shape thickness to aid the users with identifying any emerging patterns quicker.
Furthermore, Moonshot's uniqueness is also reflected in the way it has standardised the outputs of each algorithm to look and feel the same (including the scale at which the shapes are shown) and, in doing so, enables users to plug them in/out as needed.
Open-source
The indicator leverages the following open-source scripts/algorithms:
www.tradingview.com
www.tradingview.com
www.tradingview.com
www.tradingview.com

[_ParkF]KDJThis indicator is based on price fluctuations.
It is a trend indicator that uses changes in K, D, and J values as a calculation formula.
Like my previous indicators, Divergence was included.
The movements of the K, D, and J lines are also shown through the histogram.
The Period value and color of each line can be modified.
The color of the histogram can also be modified.
I hope you will use this indicator differently from the usual one with overbuying and overselling sections.
We do not recommend entering the position when J Line enters the red area,
which is the over-buying section of this indicator, and the green area, which is the over-selling section.
Based on J Line's entry into overbuying and overselling areas,
it is recommended to watch future trends, check overlapping with divergence signals or RSI+ indicators
and determine with support and resistance in parallel channels or trend lines to increase reliability of position entry.
I hope it will help you with your trading.
hope you become rich!
-------------------------------------------------------------------------------------------------------------------------------------------------
이 지표는 가격 변동을 중심으로 한 지표입니다.
K, D, J 값의 변화를 계산식으로 사용하는 트렌드계 지표입니다.
기존의 제 지표와 마찬가지로 Divergence가 포함되었고
K, D, J 선의 움직임은 히스토그램을 통해서도 나타나게 됩니다.
각 선의 Period 값, 색상을 수정 가능하며
히스토그램의 색상 또한 수정이 가능 합니다.
이 지표는 과매수, 과매도 구간이 있는 일반적인 지표의 사용법과는 다르게 사용하셨으면 좋겠습니다.
과매수 구간인 빨간색 지역과 과매도 구간인 초록색 지역으로 J Line이 진입했을 때 포지션 진입을 하는 것은 추천 드리지 않습니다.
J Line이 과매수, 과매도 지역으로 진입했을 때를 기준으로 향후 추세를 지켜보고
다이버전스 신호 또는 제 지표인 RSI+ 지표와의 중복 확인,
선형회귀( parallel channel )나 추세선에서의 지지, 저항과 함께 판단하여 포지션 진입의 신뢰도를 높혀주는 형태로 사용하시길 권장 드립니다.
당신의 트레이딩에 도움이 되었으면 합니다.
부자되세요!
[UPRIGHT] Awesome DMI+Hello Traders,
Today I'm releasing a spin on an 'oldie but goodie'; the Directional Movement Index (DMI).
DMI is a combination of 3 different indicators developed by the famous J. Welles Wilder. DMI has 3 different plots: the ADX, +DI, and -DI. The first is the ADX (Average Directional Index), which Wilder created in 1978 to show the strength of a trend by comparing the current price with the previous price range. The other two are the +DI (positive directional indicator) and the -DI show up as two separate lines, +DI is the difference between the highest price of the current day and the highest price of the day before, and -DI does the same calculation with the current and previous day's lows.
How does it work?
When the ADX line is above 25 (as a general rule, some traders use a different threshold, +/- 5), the trend is strong. When the +DI line is above the -DI line, the asset (stock) is moving in an uptrend, and the opposite means the asset is in a downtrend.
How is this different?
Uses multiple calculations to produce signals for an indicator than normally doesn't have any.
Multiple ADX's, +DI's, and -DI's for better accuracy and clearer direction changes.
Ability to use 2 different background highlight signals and several buy/sell signals.
Fully customizable (as always), ability to turn on or off any signals, change any of the colors to suit your needs.
Added pre-filled Alerts.
The ribbons created by the fill make it easier to see the change in direction of each plot.
The chart should look like:
Cheers,
Mike
(UPRIGHT TRADING)

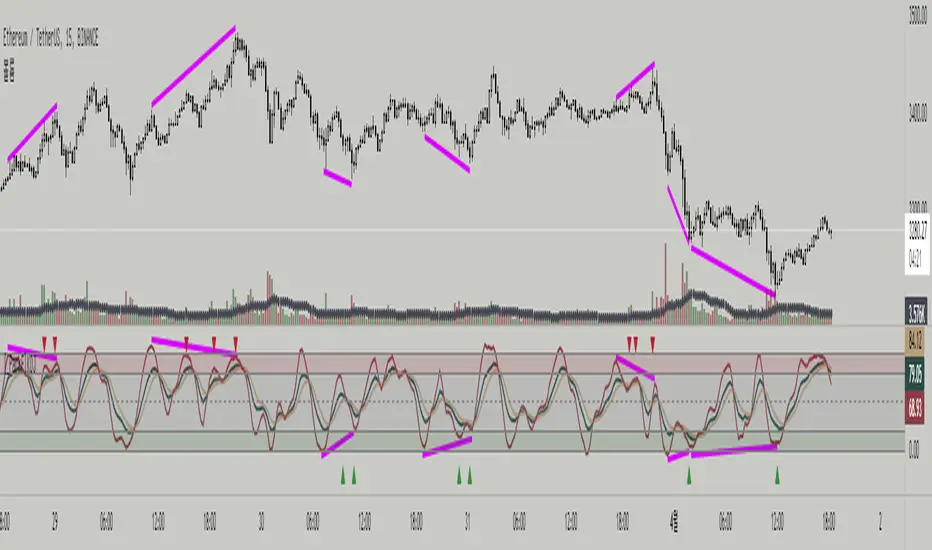
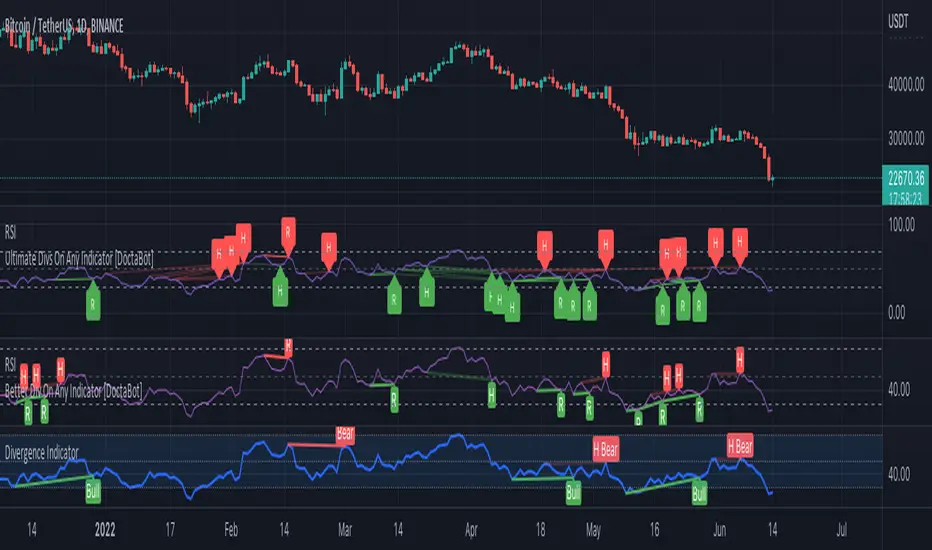
Better Divergence On Any Indicator [DoctaBot]This is an expansion of the Tradingview built in Divergences indicator (bottom) with 2 MAJOR differences.
First, and most importantly, the built in indicator identifies pivots in your chosen oscillator, but then utilizes the corresponding candle's HIGH or LOW to identify potential divergences. I'm not a fan of this method because oscillator values are typically calculated using the candle CLOSE values, so, in my opinion, divergences should be identified using the candle CLOSE value as well, as they are in this script.
Second, the built in divergence indicator only looks back one oscillator pivot for potential divergences. I coded this to look back one additional pivot as well to identify more valid potential divergences. The script will only identify these types of "multiple pivot divergences" if the oscillator pivot in between the two diverging pivots DOES NOT intersect the line being drawn them.
Notes for chart:
#1: This built in Divergence indicator misses this hidden bearish divergence because of the pivot in between (marked with red vertical line). No divergence exists between the most recent pivots, but it does if we compare it to the next one back.
#2: The RSI14 is making a lower high here, the first criteria for a bearish divergence. The built in Divergence indicator then references the candles' HIGHS. Because the most recent HIGH exceeds the previous one, it is considered a higher high and incorrectly identified as a bearish divergence. If we use the candle CLOSE price to identify divergences, this does not qualify.
#3: Here, we see both of the updates in action. Neither of these bearish divergences are identified with the built in Divergence Indicator. The first divergence s missed due to the use of candle HIGHS rather than closes; the original HIGH is greater than the next HIGH, however, comparison of closes shows that it is, in fact, a higher CLOSE. The second divergence is missed because original indicator can only look back one pivot and, consequently, misses the divergence between the next one back.
Please note, you may notice while using this script that some of the older divergences do not show any lines between the oscillator pivots. THIS IS NOT A BUG! In order to draw divergence lines properly for multiple pivots back, I had to use the line.new functions rather than plot functions. These line functions will delete old lines when a certain number have been drawn on the chart so these old ones are automatically erased as time passes.
[Rygel] MACD 4C with divergences, crossovers and alertsThis indicator is a reliable, exhaustive, instant, simple divergence detector for the MACD 4C oscillator.
I've struggled for months to find a MACD divergence indicator I can rely on, I've tinkered with the ones I found and never was satisfied by the final result. For all of them important divergences were not shown, for some divergences was shown too late, for others divergence lines was not drawn, some even shown some strange exotic divergences... I played will all the parameters and something was always wrong or missing at the end.
It was even worse for the MACD 4C indicator, the 4-color MACD, which I prefer to use.
So I finally decided to write my own divergence algorithm and to create my own indicator. After a few attempts, here's the result.
This MACD indicator is using the same divergence detection algorithm I wrote for my RSI indicator. You'll find on its description page a comparison of my divergence algorithm with other ones to see how it differs.
When I built this indicator, my objectives were to create one that is:
Reliable. I didn't want to have to double-check an indicator to make sure it's doing what I expect it to do. I want to be able to look at it for one second and know I can rely on it.
Exhaustive. I didn't want to have to rely on multiple indicators to be sure I'm not missing a divergence.
Instant. I wanted the divergences to be shown as soon as soon as they form and not after a pivot is confirmed. For some indicator, when the divergence is displayed, it's already too late to act on it.
Simple. I wanted my indicator to be clean, readable and not visually aggressive. The main objective of this indicator is to show divergences and I didn't want to visually overload it with unrequired information.
I wanted my indicator to be a simple as possible, nonetheless you'll find a few parameters to tinker with. Many of them will need no explanation but here's the list.
Show signal line: disabled by default. Show the MACD signal line.
Color signal line: disabled by default. Show the signal line as green when it goes up and read when it goes down.
Show signal crossovers: enabled by default. Show a green dot when MACD crosses up its signal line and a red dot when it crosses down.
Show zero line: enabled by default. Show a line at the 0 value.
Show zero crossovers: disabled by default. Show a green triangle when MACD crosses up the 0 line and a red triangle when it crosses down.
Show regular divergences: enabled by default.
Show hidden divergences: disabled by default for readability. I try to keep the indicator as clean as possible by default.
Bullish regular divergence color : no explanation needed I suppose.
Bullish hidden divergence color : same.
Bearish regular divergence color : ditto.
Bearish hidden divergence color : uhh.
Show overbought and oversell backgrounds : when RSI is oversold or oversell, the background color changes to red or green. The indicator uses two levels of oversold/overbought. When the RSI is strongly oversold/overbought the background color gets brighter. You can configure these levels in the advanced parameters.
Advanced parameters:
MACD fast moving average length: 12 by default.
MACD slow moving average length: 26 by default.
MACD signal moving average length: 9 by default.
Show divergences before pivot confirmation : enabled by default. Divergences will appear as soon as possible, before the pivot is confirmed by another candlestick. Unconfirmed divergences will appear as dashed lines then disappear if not confirmed or turn to solid lines if confirmed. This may create false positives with alerts as the divergence may disappear.
Minimum bars to check: 5 by default. As this indicator detects absolutely all the divergences, some may be insignificant and it may become unreadable without some filtering. If you want to see absolutely all the divergences, you may lower this value. Please note TradingView limits to 50 how many lines are displayed at the same time on an indicator. So when you display more divergences, some in the past disappear. It's not usually an issue but if you scroll back in time, divergences will stop to show at one point in the past.
Maximum bars to check: 75 by default. Divergences may go far in the past, this parameters limit how old a divergence may be. You can higher it to show more divergences.
Show pivots: disabled by default. Show the pivot points used for divergence detections.
This indicator offers the following alerts:
Any divergence
Bearish divergence
Bullish divergence
Regular bearish divergence
Regular bullish divergence
Hidden bearish divergence
Hidden bullish divergence
MACD becoming positive
MACD becoming negative
MACD crossing up signal line
MACD crossing down signal line
Please note TradingView limits for performance reason to 50 the number of lines you can display on an indicator at the same time. So when you scroll back in time, at one point divergences will stop to show. If you want to see divergences far in the past, you may need to use the replay feature or to configure stronger filtering settings.
I hope you'll enjoy this indicator as much as I do! :)
Feel free to comment if you experience a bug or if an important feature is missing for you. (Please note the core of this indicator is divergence detection, I want to keep it simple so I will probably not add many unrelated features to it.)

[Rygel] RSI with divergences and alertsThis indicator is a reliable, exhaustive, instant, simple divergence detector for the RSI oscillator.
I've struggled for months to find a RSI divergence indicator I can rely on, I've tinkered with the ones I found and never was satisfied by the final result. For all of them important divergences were not shown, for some divergences was shown too late, for others divergence lines was not drawn, some even shown some strange exotic divergences... I played will all the parameters and something was always wrong or missing at the end.
So I finally decided to write my own divergence algorithm and to create my own indicator. After a few attempts, here's the result.
At first. Please find below a quick comparison of this indicator with some of the most popular RSI divergence indicators on TradingView. I've hidden their names as it's not my intention to show them in a bad light. These indicators are great and some of you may even find them better than this one, they were just not what I was looking for.
You will most likely notice all of them are missing divergences but not always the same. You'll have to combine all of them to get (almost) all the divergences.
When I built this indicator, my objectives were to create one that is :
Reliable. I didn't want to have to double-check an indicator to make sure it's doing what I expect it to do. I want to be able to look at it for one second and know I can rely on it.
Exhaustive. I didn't want to have to rely on multiple indicators to be sure I'm not missing a divergence.
Instant. I wanted the divergences to be shown as soon as soon as they form and not after a pivot is confirmed. For some indicator, when the divergence is displayed, it's already too late to act on it.
Simple. I wanted my indicator to be clean, readable and not visually aggressive. The main objective of this indicator is to show divergences and I didn't want to visually overload it with unrequired information.
I wanted my indicator to be a simple as possible, nonetheless you'll find a few parameters to tinker with. Many of them will need no explanation but here's the list.
Show regular divergences : enabled by default.
Show hidden divergences : disabled by default for readability. I try to keep the indicator as clean as possible by default.
Bullish regular divergence color : no explanation needed I suppose.
Bullish hidden divergence color : same.
Bearish regular divergence color : ditto.
Bearish hidden divergence color : uhh.
Show overbought and oversell backgrounds : when RSI is oversold or overbought, the background color changes to red or green. The indicator uses two levels of oversold/overbought. When the RSI is strongly oversold/overbought the background color gets brighter. You can configure these levels in the advanced parameters.
Advanced parameters:
RSI source: "close" by default.
RSI length: 14 by default.
Show divergences before pivot confirmation : enabled by default. Divergences will appear as soon as possible, before the pivot is confirmed by another candlestick. Unconfirmed divergences will appear as dashed lines then disappear if not confirmed or turn to solid lines if confirmed. This may create false positives with alerts as the divergence may disappear.
Minimum bars to check: 5 by default. As this indicator detects absolutely all the divergences, some may be insignificant and it may become unreadable without some filtering. If you want to see absolutely all the divergences, you may lower this value. Please note TradingView limits to 50 how many lines are displayed at the same time on an indicator. So when you display more divergences, some in the past disappear. It's not usually an issue but if you scroll back in time, divergences will stop to show at one point in the past.
Maximum bars to check: 50 by default. Divergences may go far in the past, this parameters limit how old a divergence may be. You can higher it to show more divergences.
Use limits for divergences: enabled by default. Don't show divergences when they are above or below a threshold. Another filtering options to make sure only relevant divergences are shown.
Minimum value for bearish divergence: 40 by default.
Maximum value for bullish divergence: 60 by default.
Show pivots: disabled by default. Show the pivot points used for divergence detections.
Oversold level: 30 by default. A red background is shown when the indicator goes below this level.
Overbought level: 70 by default. A green background is shown when the indicator goes above this level.
Strongly oversold level: 20 by default. A brighter red background is shown when the indicator goes below this level.
Strongly overbought level: 80 by default. A brighter green background is shown when the indicator goes above this level.
Show moving average: disabled by default. Add a moving average to the indicator.
Moving average type: SMA by default. You may choose between Bollinger Bands, EMA, SMA, SMMA (RMA), VWMA and WMA.
Moving average length: 14 by default.
Bollinger Band standard deviation 2 by default.
This indicator has the following alerts:
Any divergence
Bearish divergence
Bullish divergence
Regular bearish divergence
Regular bullish divergence
Hidden bearish divergence
Hidden bullish divergence
Please note TradingView limits for performance reason to 50 the number of lines you can display on an indicator at the same time. So when you scroll back in time, at one point divergences will stop to show. If you want to see divergences far in the past, you may need to use the replay feature or to configure stronger filtering settings.
I hope you'll enjoy this indicator as much as I do! :)
Feel free to comment if you experience a bug or if an important feature is missing for you. (Please note the core of this indicator is divergence detection, I want to keep it simple so I will probably not add many unrelated features to it.)

RSI Divergences + Bollinger Bands█ OVERVIEW
Here's the RSI divergences with Bollingers bands.
█ CONCEPTS
5 features
1 — RSI
2 — Bollinger bands
3 — RSI signal is in another color when above 70 or below 30
4 — Looking for previous Divergences, Bullish, Bearish and Hidden Bullish and Bearish but I don't like Hidden divergences
5 — Color fill when overbuy or oversold
█ OTHER SECTIONS
I like to see it like a moutain, with snow on top and lake on bottom. I think you don't want to start walking at the top, nor sink to the bottom of the lake for ever and ever.
It is an idea of sjoerd , tip him if you like it.
An oscillator is good to know where we are in the trends, but it's not enough to run a small business of trading, you need to learn how to use it.
What is a divergence ?
Thanks to The rational investor for teaching me how to use this indicator.
+ %UMAIf you are familiar with the %B for use with Bollinger Bands, then you will understand this indicator immediately.
Designed for use with my +UMA moving average, this works in exactly the same way, with a few differences.
First off, as you can choose on which type of moving average the calculations are made, so too you will want to match this up with the one you are using. That of course goes for the standard deviation as well (just like you would with Bollinger Bands and %B). Here, because the +UMA uses highs and lows to create a sort of moving average channel, and then also to create the bands, I've opted to set the inner part of the bands as the extreme edge that the %UMA equates with the upper and lower lines.
I've added a moving average, donchian channels, and auto-plotted divergences as well, if you like. Typical color related stuff that I do. Alerts for everything.
Hope you like it!
The above image is comparing two of the same indicator, but based on different moving averages, and how it might plot divergences differently between the two.

The Divergent - Advanced Divergence IndicatorAutomated divergence detection with unparalleled customizability for any market on TradingView.
This is the Basic (Free) version of The Divergent - Advanced Divergence Indicator .
Features :
1. Divergence detection for any market & any timeframe
Bitcoin? Tesla? Gold? You name it. The Divergent will spot divergences for you on any market and any timeframe.
2. Choose from 2 built-in oscillators
The Basic version of The Divergent comes with 2 built-in oscillators: MACD and RSI
3. Automated detection of Regular Bullish and Regular Bearish divergences
The Basic version of The Divergent can detect two types of divergences: Regular Bullish and Regular Bearish
4. Complete control over every aspect of divergence detection
The Divergent exposes over 40 different settings to allow you fine tune the divergence detection algorithm.
- Oscillator (MACD / RSI)
- Detect Regular Bullish Divergences
- Detect Regular Bearish Divergences
- Pivot Detection Source (Price / Oscillator)
- Source smoothing
- Candle Pivot Detection Mode (Bodies / Wicks)
- Pivot Lookback Right
- Pivot Lookback Left
- Divergence Max. Length
- Divergence Min. Length
- Number of Historic Pivots to Compare
- Pivot Correction
- Restrict Starting Pivot to a Single Divergence
- Allow Early Detection of Divergences
- Line of Sight filter
- Minimum Pivot Change filter
- Pivot Candle Color filter
- Moving Average Filter
- MACD settings
- RSI settings
5. Divergence statistics
6. Fully documented
The Divergent has each and every of its inputs documented via tooltips inside the settings panel. Simply hover your mouse over the ( i ) icon next each the input field to learn more about the purpose of the configuration.
---

CryptoGraph MA DivergenceCryptoGraph MA Divergence is a multifunctional trading tool that identifies aspects of trend trading.
The indicator is based on moving averages, transformed into an oscillator. This way it becomes possible to get a better visualisation of MA's relative to each other, and more importantly, it enables us to spot divergences based on MA's.
This simply yet effective enhancement wasn't seen before as an oscillator, so I decided to make and share it.
Features of the indicator:
- Blue/Purple wave (Based on Moving Averages)
- White line (Average of Blue/Purple Wave)
- Green/Red Dots (Trend reversals)
- Red/Green lines (Wider red and green lines are regular divergences, thinner red and green lines are hidden divergences)
What to look for?
- A red or green dot may be a very early indication of a trend reversal, in times of consolidation they cluster together. Use other CryptoGraph indicators to filter these dot clusters.
- Blue/Purple wave crossing 0 line.
- Divergences. Divergences are automatically spotted in the indicator. HOWEVER, always try to find them manually, since the indicator won't be able to spot them all automatically.
For access contact me through TradingView or Discord.

Stochastic Weighted RSI w/ Divergence + Signals🐢 Tawtis' Stochastic Weighted Relative Strength Index , aka SWRSI
This indicator combines the Stochastic RSI and the classic RSI we all know and love to create a more effective indication of seller/buyer dominance, and in turn, trend. I have named it the "Stochastic Weighted RSI". The script also includes a standard RSI, so you can use both at the same time!
Loads of customisation, pretty much every input can be changed to fit your preferences, however, the default settings are what I would personally recommend for the best results. Either way, feel free to change them!
By looking at the indicator, you can also establish the trend that may follow in the candles to come.
Typically, an indicator reading of over 70 is considered overbought, and an indicator reading of under 30 is considered oversold.
The calculations for the SWRSI and its signals take into account a multitude of exponential moving averages, a Stochastic RSI and a classic RSI, among other things.
There are 2 types of signals provided by the indicator, being strong and weak. You do not have to follow these, and they aren't always accurate (it's impossible to be accurate 100% of the time), however, they can give a good idea of the trend that will ensue.
Strong buy signals are created when:
SWRSI is under 30
SWRSI is over the EMA (default 2) of the SWRSI
Short EMA (default 20) is under the long EMA (default 50)
Strong sell signals are created when:
SWRSI is over 70
SWRSI is under the EMA (default 2) of the SWRSI
Short EMA (default 20) is over the long EMA (default 50)
Weak buy and sell signals are printed as green and red background highlights, and operate the same as the strong buy and sells, without the short/long EMA criterion. Both of these signal types can be toggled off using the settings if you do not want to see them.
Enjoy!

Rainbow Indicator - Polfwack ProThis is a reverse engineered completely free Version of an Indicator that you would normally have to spend huge amounts of money on. I personally believe that no one should pay a fortune for access to an Indicator that contains huge amounts of freely available stuff.
This indicator claims to be even better than Market Cipher. Turns out it uses - just as Market Cipher, freely available Indicators and puts them in a nice looking package. I packed in as much as it made sense, the original Indicator is visually very cluttered with - in my opinion, too much random stuff that I have left out for a cleaner look, for example the truckload of entry signals, MFI and that Autotrendline feature that no one really needs because the human brain is way better at drawing lines.
Was is included? From top to bottom:
1st Bar -> Color coded RSI status. It shows Oversold and Overbought, Bullish, Hidden Bullish, Bearish and Hidden Bearish Divergences.
2nd Bar -> Color coded Market Structure Analyser. It shows if the market is currently ranging, bullish or bearish based on calculated pivots and outbreaks of said pivots. Bullish and Bearish breaks are also being printed.
Main Oscillator -> An Awesome Oscillator (AO) that prints bullish, hidden bullish, bearish and hidden bearish divergences as well as positive and negative Pivot Points.
Bollinger Bands -> They are following the AO and are color coded to the long term trend indicator for less visual clutter.
Secondary Oscillator -> Accelerator Oscillator (AC).
3rd Bar -> Color coded longer term trend indicator, it mirrors the color code on the Bollinger Bands. The original uses an ATR-based calculation, but I found a Kumo cloud to be more simple and more reliable for this kind of thing.
4th Bar -> Color coded mirror of the Accelerator Oscillator.
I tried to make the whole Indicator as adjustable as possible, most of the variables can be edited to your liking.
On the internet you can find all sorts of strategies for every single of the included indicators.
I hope that I have saved you at least some money. Good luck.

MechaOscillatorWhat is MechaOscillator?
MechaOscillator was created as a companion to our main script MechaAlgo. Using MechaOscillator along with MechaAlgo will allow you to boost your overall understanding of any market, and make more informed decisions as a trader.
Feature List
Built-In Improved WaveTrend Oscillator
Buy & Sell Signals
Bullish and Bearish Divergences
Short and Long Term Trend Indicators
Trend Strength Indicator
Market State Indicator
Real Time Informational Dashboard
Bullish and Bearish Breakout Indicator
Many More Features to Come!
By using this script you acknowledge that MechaOscillator cannot guarantee you profit, and that this product was only created in attempt to benefit traders. You also acknowledge that past performance is not indicative of future results, and that the experience of other users or what you see online may not always be your experience.

Divergence of Stocks Above MA50 v.s. US-Stock MarketEnglish:
This indicator has been developed as an early warning tool to estimate the probability of correction in the US stock market. It works best in the daily chart.
Function:
1.) "Index-line"
The underlying stock index is converted to a scale between 0% and 100% based on its 52-week highs and lows. Where 100% is closing price at 52-week high and 0% is closing price at 52-week low.
2nd) "Stocks Above MA50".
For each major stock index, there is an index that determines the percentage of stocks above its 50 moving average. For example, for the S&P 500, this is the S5FI.
3) "Divergence
In an efficient market, both lines (index and number of stocks above the 50 MA) would run more or less in sync. A new high in the index would also mean a new high in the stocks trading above the 50 moving average. Often, however, a correction in the index is announced when the number of stocks trading above their 50 MA do not make a new, or even a lower, high while the underlying index marks a new high. The divergence signal measures this divergence of the indices. The higher the bar, the more pronounced the divergence.
How to read the indicator?
If a divergence occurs, then the stops should be tightened. As with any indicator, false signals can occur because a divergence does not automatically lead to a correction. The higher the divergence is indicated, the higher the probability. The strength of a correction cannot be predicted with the indicator.
For which symbols does the indicator work?
The indicator works exclusively for the following symbols:
S&P500: SPX, SPY, ES1!, US500 Index above MA50: S5FI
Russel2000: IWM, US2000, RTY1!, RUT, IWO Index above MA50: R2FI
NASDAQ100: NDX, NAS100, NQ1!, US100, QQQ Index above MA50: NDFI
NASDAQ: IXIC, ONEQ, QCN1!, NDAQ Index above MA50: NCFI
NYSE: XAX, NYA Index above MA50: MMFI
DowJones100: DJX, DJI, DIA, MYM1!, YM1! Index above MA50: DIFI
DowJonesComp: DOW, IYY Index above MA50: DCFI
Deutsch:
Dieser Indikator ist als Frühwarninstrument zur Einschätzung der Korrekturwahrscheinlichkeit im US-Aktienmarkt entwickelt worden. Er funktioniert am besten im Tages-Chart.
Funktion:
1.) „Index-line“
Der zugrunde liegende Aktienindex wird bezogen auf seine 52Wochen Hochs und Tiefs in eine Skala zwischen 0% und 100% umgerechnet. Dabei sind 100% Schlusskurs auf 52-Wochen Hoch und 0% Schlusskurs auf 52-Wochen Tief.
2.) „Stocks Above MA50“
Zu jedem Hauptaktienindex gibt es einen Index, der den Prozentwert der Aktien über Ihrem 50 gleitenden Durchschnitt ermittelt. Beim S&P 500 ist das z.B. der S5FI.
3.) „Divergence“
In einem effizienten Markt würden beide Linien (Index und Anzahl Aktien über dem 50 MA) mehr oder weniger synchron laufen. Ein neues Hoch im Index würde auch ein neues Hoch bei den Aktien, die über dem 50 gleitenden Durchschnitt notieren, bedeuten. Oft jedoch kündigt sich eine Korrektur im Index an, wenn die Anzahl der Aktien, die über ihrem 50 MA notieren kein neues, oder sogar ein niedrigeres Hoch machen, während der zu Grunde liegende Index ein neues Hoch markiert. Das Divergenz-Signal misst diese auseinanderlaufen der Indices. Je höher der Balken, umso stärker ist die Divergenz ausgeprägt.
Wie ist der Indikator zu lesen?
Wenn eine Divergenz auftritt, dann sollten die Stopps enger herangezogen werden. Es kann wie bei jedem Indikator zu Fehlsignalen kommen, da eine Divergenz nicht automatisch zu einer Korrektur führen muss. Die Wahrscheinlichkeit ist um so höher, je höher die Divergenz angezeigt wird. Die Stärke einer Korrektur kann mit dem Indikator nicht prognostiziert werden.
Für welche Symbole funktioniert der Indikator?
Der Indikator funktioniert ausschließlich für folgende Symbole:
S&P500: SPX, SPY, ES1!, US500 Index über MA50: S5FI
Russel2000: IWM, US2000, RTY1!, RUT, IWO Index über MA50: R2FI
NASDAQ100: NDX, NAS100, NQ1!, US100, QQQ Index über MA50: NDFI
NASDAQ: IXIC, ONEQ, QCN1!, NDAQ Index über MA50: NCFI
NYSE: XAX, NYA Index über MA50: MMFI
DowJones100: DJX, DJI, DIA, MYM1!, YM1! Index über MA50: DIFI
DowJonesComp: DOW, IYY Index über MA50: DCFI
