Supply & Demand - Trading Vidhyalaya (Free)A powerful script that automatically plots Supply and Demand zones on your chart. Designed to help traders identify potential reversal areas with precision.
Free Version Capabilities:
Works exclusively on the Daily (1D) Timeframe.
Includes Wick & Strong validation logic.
📍 Pinpoint accurate reversals.
🔔 Real-time alerts for Daily zones.
📉 "Touched" zone logic to keep your chart clean.
Want to use this on Intraday Charts? The Premium version supports ALL Timeframes (1m to Monthly) and includes Multi-Timeframe (MTF) overlay capabilities.
Demandandsupplyzones

Liquidity Mix- Supply and DemandLiquidity Mix highlights developing and confirmed supply/demand zones and optional trade guides with entries, stops, targets, and risk/reward math. Benefits: see high-probability reaction areas early, size positions automatically from your risk input, track reward multiples, and receive optional alerts when price tags zones or entries—all in one overlay.

Demand & Supply by DaoEA — v1.1Demand & Supply by DaoEA
This indicator is designed to help traders identify key demand and supply zones, displaying strong price action patterns such as Pin Bar, Engulfing, Hammer, and Shooting Star to confirm reversal points.
Key Features
Automatically identifies Supply & Demand Zones and extends them to the right.
Displays Break of Structure (BOS) when prices break out of these zones.
Tracks Swing Highs/Lows and analyzes HH, HL, LH, and LL.
Highlights strong price action patterns such as Bullish/Bearish Pin Bars, Engulfing, Hammer, and Shooting Star.
Customizable zones, colors, and labels.
Overlay zone protection. To avoid over-cluttering the chart,
Usage
Use with higher timeframes (H1 and above) to identify high demand and supply points.
Switch to smaller timeframes (M15–M30) to identify entry and exit opportunities.
Wait for a strong BOS + PA to confirm the signal.
Suitable for scalpers, swing traders, and Smart Money Concept (SMC) traders who want to clearly understand market structure.

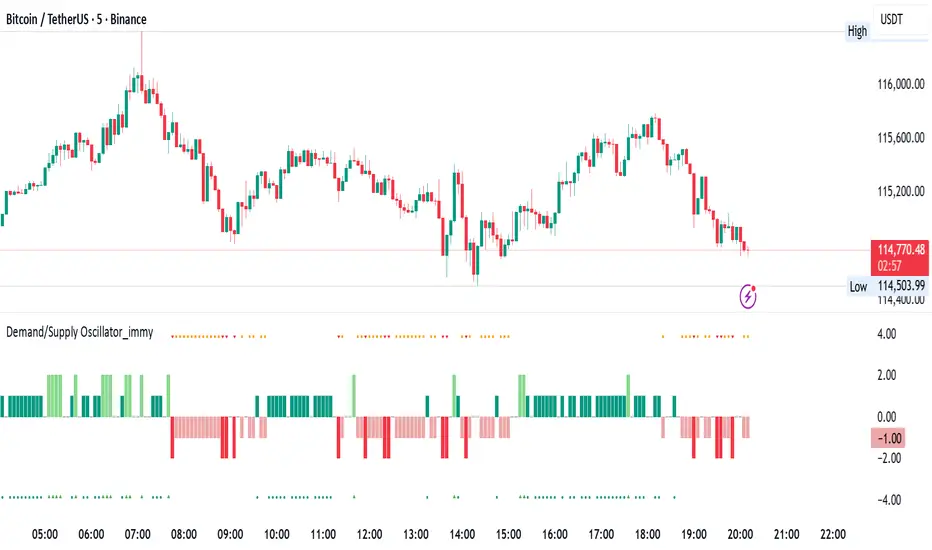
Demand/Supply Oscillator_immyDemand/Supply Oscillator, probably the only D/S oscillator on TV which doesn't draw the lines on the chart but to show you the actual reasons behind the price moves.
Concept Overview
A demand/supply oscillator would aim to look for the hidden spots/order which institutes place in small quantities to not to upset the trend and suddenly place one big order to liquidate the retailers and make a final big move.
The lite color candles in histogram shows the hidden demand/supply which is the reason behind the sudden price pullback, even for short period of time.
Measure demand and supply based on volume, price movement, or candle structure
Identify price waves or impulses (e.g., using fractals, zigzag, or swing high/low logic)
Detect hidden demand/supply (e.g., low volume pullbacks or absorption zones)
Plotted on histogram boxes to visualize strength and direction of each wave
What “Hidden Demand” Means?
Hidden demand refers to buying pressure that isn’t immediately obvious from price action — in other words, buyers are active “behind the scenes” even though the price doesn’t yet show strong upward movement.
What Hidden supply Means?
refers to selling pressure that isn’t obvious yet on the price chart. It means smart money (big players) are quietly selling or distributing positions, even though the price might not be dropping sharply yet.
It usually appears when:
The price is pulling back slightly (down candle),
But volume or an oscillator (like RSI, MACD, or OBV) shows bullish strength (e.g., higher low or positive divergence).
That suggests smart money is accumulating (buying quietly) while the public may think it’s just a normal dip.
💹 Price Reaction — Up or Down?
If there is hidden demand, it’s generally a bullish signal → meaning price is likely to go up afterward.
However, on that exact candle, the price may still be down or neutral, because:
Hidden demand is “hidden” — buyers are absorbing supply quietly.
The move up usually comes after the hidden demand signal, not necessarily on the same candle.
📊 Example
Suppose:
Price makes a slightly lower low,
But RSI makes a higher low → this is bullish (hidden) divergence, or “hidden demand.”
➡️ Interpretation:
Smart buyers are stepping in → next few candles likely move up.
The current candle might still be red or show a small body — that’s okay. The key is the shift in underlying strength.
🧭 Quick Summary
Term Meaning Candle Effect Expected Move After
Hidden Demand Buyers active below surface Candle may still go down or stay flat
Hidden Supply Sellers active behind the scenes Price likely to rise soon
🛠️ Key Components
Best results with Price/Action e.g. Use swing high/low or zigzag to segment price into waves.
Optionally apply fractal logic for more refined wave detection
Combine with other indicators (e.g., RSI, OBV) for confirmation
Include zone strength metrics (e.g., “Power Number” as seen in some indicators)
Demand/Supply Calculation
Demand: Strong bullish candles, increasing volume, breakout zones
Supply: Strong bearish candles, volume spikes on down moves
Hidden Demand/Supply: Pullbacks with low volume or absorption candles
Histogram Visualization
Use plot() or plotshape() to draw histogram bars
Color-code bars: e.g., green for demand, red for supply, lite colors for hidden zones
Add alerts for wave transitions or hidden zone detection
How It Works
Demand/Supply: Detected when price moves strongly with volume spikes.
Hidden Zones: Detected when price moves but volume is low (potential absorption).
Histogram Values:
+2: Strong Demand
+1: Hidden Demand
-1: Hidden Supply
-2: Strong Supply
0: Neutral
Feature Demand (Visible) Hidden Demand
Visibility Clearly seen on price charts Subtle, often masked in consolidation
Participants Retail + Institutional Primarily Institutional
Price Behavior Sharp rallies from zone Sideways movement, low volatility
Tools to Identify Candlestick patterns, support zones Volume profile, order flow, price clusters
Risk/Reward Moderate (widely known) High (less crowded, early entry potential)
HTF Supply & Demand Zones 📊 Overview
Advanced supply and demand zone indicator that automatically detects institutional-level price zones on higher timeframes and dynamically adapts zone colors based on price position. Zones below price act as demand (support) and zones above price act as supply (resistance).
✨ Key Features
🎯 Dynamic Zone Recognition
- Smart Color Adaptation: Zones automatically change from demand (green) to supply (red) when price crosses them
- Higher Timeframe Analysis: Detect zones from any timeframe while trading on lower timeframes
- Base/Blast Pattern Detection**: Identifies strong institutional zones using base-blast candle methodology
- Automatic Zone Flipping: Broken demand zones become supply and vice versa
📈 Zone Detection Method
Uses the proven Base & Blast candle pattern:
- Base Candle: Small consolidation candle with minimal wick
- Blast Candle: Strong momentum candle breaking from the base
- Customizable Ratio: Adjust base/blast body size ratio (default 8:1)
- Wick Filter: Ensures clean base candles for higher probability zones
🎨 Visual Features
- Clean Zone Boxes: Extended zones with customizable colors and transparency
- Smart Labels: Display zone type and touch count
- Touch Counter: Track how many times price has tested each zone
- Info Dashboard: Real-time statistics in top-right corner
⚙️ Zone Management
- Auto-Delete After X Touches**: Remove zones after specified number of tests (default: 5)
- Optional Break Deletion**: Choose whether to delete zones when price breaks through
- Maximum Zone Limit**: Control chart cleanliness by limiting displayed zones
- Extended Zones**: All zones extend to the right for forward visibility
🔧 Settings
Detection Parameters
- Higher Timeframe: Select any timeframe for zone detection (empty = current timeframe)
- Base/Blast Ratio: 4.0 to 30.0 (default: 8.0) - Higher = stronger zones, fewer signals
- Wick Threshold: 0.1 to 0.5 (default: 0.3) - Maximum base candle wick size
Display Options
- Toggle demand/supply zones independently
- Maximum zones to display (1-50)
- Show/hide zone labels
- Customizable colors for demand and supply zones
- Adjustable border width
Zone Management
- Delete after X touches (1-30 touches)
- Delete on break option
- Touch counter displays current/max touches
💡 How to Use
For Swing Trading
1. Set timeframe to Daily or Weekly
2. Use 8:1 ratio for high-quality zones
3. Enable auto-delete after 3-5 touches
4. Trade pullbacks to green zones (demand) for longs
5. Trade rallies to red zones (supply) for shorts
For Day Trading
1. Set timeframe to 1H or 4H
2. Use 6:1 ratio for more zones
3. Watch for zone color changes as confirmation
4. Enter when price retests zones in the direction of the higher timeframe trend
For Scalping
1. Set timeframe to 15m or 1H
2. Use 5:1 ratio for frequent signals
3. Focus on first touch of fresh zones
4. Use lower timeframes for precise entries
📋 Best Practices
✅ DO:
- Use zones from higher timeframes for better reliability
- Wait for zone color change as confirmation of flip
- Focus on first 2-3 touches of a zone
- Combine with trend analysis
- Use zones as targets and entry levels
❌ DON'T:
- Trade every zone - quality over quantity
- Ignore the touch counter
- Use on very low timeframes without HTF context
- Trade zones that have been tested many times
🎓 Understanding Dynamic Colors
Green Zones (Demand) = Below current price = Support = Look for bounces
Red Zones (Supply) = Above current price = Resistance = Look for rejections
When price breaks a green zone downward, it flips to red (former support becomes resistance)
When price breaks a red zone upward, it flips to green (former resistance becomes support)
📊 Info Dashboard
The top-right table displays:
- Active timeframe
- Current demand zones count (below price)
- Current supply zones count (above price)
- Active base/blast ratio
- Maximum touches setting
🔔 Trading Signals
High Probability Setups:
- Fresh zones (0-1 touches) on higher timeframes
- Zones that align with major support/resistance
- First test after a zone color flip
- Multiple timeframe confluence
Avoid:
- Zones with 4+ touches
- Zones in choppy/ranging markets
- Counter-trend zones during strong momentum
⚡ Performance Notes
- Maximum 500 boxes and lines supported
- Optimized for real-time scanning
- Minimal resource usage
- No repainting - all zones are confirmed
🎯 Recommended Settings by Trading Style
Conservative (Higher Quality)
- Ratio: 10:1
- Wick Threshold: 0.2
- Delete After: 3 touches
Balanced (Default)
- Ratio: 8:1
- Wick Threshold: 0.3
- Delete After: 5 touches
Aggressive (More Signals)
- Ratio: 6:1
- Wick Threshold: 0.4
- Delete After: 7 touches
---
📖 Additional Resources
For more information on supply and demand trading:
- Study institutional order flow
- Learn base and blast candle patterns
- Understand market structure and liquidity zones
- Practice on demo before live trading
Risk Warning: This indicator is a tool for technical analysis. Always use proper risk management and combine with your trading strategy. Past performance does not guarantee future results.
---
Compatible with all markets: Forex, Stocks, Crypto, Futures, and Indices
Version: 1.0 | Language: Pine Script v5

Demand Supply Zones with MTFDemand Supply Zones with Multi-Timeframe Analysis
Overview:
Advanced institutional demand/supply zone detector with multi-timeframe analysis, proximity alerts, and trend dashboards. Identifies high-probability reversal areas using intelligent base detection and breakout validation across 4 simultaneous timeframes.
Core Unique Features:
• 💎 Elite Base Factor: Auto-detects institutional base patterns using pre-breakout candle body ratio analysis (adjustable 0.1-2.0).
• 🌐 4-Timeframe Zone Detection: Simultaneous MTF zones with individual "👁️ Tested" toggles for granular control - unprecedented in demand/supply indicators.
• 🚨 Proximity Dashboard: Real-time distance tracking to nearest zones (current + all MTF). Visual "APPROACHING!" alerts when price within threshold %.
• 📊 Zone Analytics Dashboard: Live counters for active/tested zones per timeframe with date range display and MTF status tracking.
• 📈 Multi-Timeframe Trend Analysis: 4-TF trend direction
• 🎯 Advanced EMA System: 10 multi-timeframe EMA-20 lines + Golden/Death Cross alerts with customizable styling.
• 📅 Date Range Filter: Performance optimization with calendar-based zone limits (10-500 zones).
• 🧩 Gap Filling: Optional gap bridging between base and leg-out candles for continuous zones.
• 🔐 No Repainting: MTF zones created only on confirmed bars with lookahead bias disabled.
How It Works:
1. Base Detection: Identifies consolidation candles (1-4 consecutive) with customizable body % threshold. Elite mode auto-detects when pre-breakout candle is significantly smaller.
2. Leg-Out Validation: Confirms breakout strength of legout
3. Zone Extension: Projects zones forward (10-500 bars).Fresh zones (green/red) turn gray when tested.
4. MTF Integration: Detects zones from 4 higher timeframes with independent parameters. Each MTF has individual tested zone toggle.
5. Analytics: Proximity dashboard calculates real-time distance to nearest zones. Trend dashboard shows direction across 4 TFs.
Important Notes:
• Educational Purpose: This indicator is for analysis and learning only. Does not guarantee future results.
• Risk Management Required: Always use stop losses and proper position sizing.
• Chart Type: Use standard Candlestick charts. Non-standard charts (Heikin Ashi/Renko) not recommended for accurate zone detection.
• Timeframe Requirements: MTF zones appear only when viewing lower timeframe than selected MTF (e.g., view 1H chart to see Daily MTF zones).
• Performance: Enable Date Range Filter when using multiple MTF timeframes to reduce computational load.
• Past Performance Disclaimer: Historical accuracy does not guarantee future trading results.
⭐ If you find this indicator valuable, please like and share!

SD Demand & Supply IndicatorSD Demand & Supply Indicator automatically identifies and displays demand and supply zones across multiple timeframes.
The indicator detects:
Demand Zones: Drop–Boring–Rally (DBR) and Rally–Boring–Rally (RBR) formations
Supply Zones: Rally–Boring–Drop (RBR) and Drop–Boring–Drop (DBD) formations
When a Demand Zone is detected, it plots a blue Label below the relevant boring candle. When a Supply Zone is detected, it plots a red Label above the relevant boring candle — making it easy to visualize potential reversal areas.
With built-in alert functionality, you can also set alerts on your preferred symbols and timeframes to get instant notifications whenever new Demand or Supply Zones are formed.
How the Script Works?
1. The script scans the price action of three to five consecutive candles to identify potential Demand and Supply patterns based on the open, High, Low and close prices.
2. The script evaluates every candle’s price movement based on set conditions to confirm a valid demand or supply pattern.
3. For demand cases, the script recognizes specific formations such as Drop– Boring –Rally (DBR) and Rally– Boring –Rally (RBR), which indicate potential buying zones.
4. For supply cases, it identifies Rally– Boring –Drop (RBD) and Drop– Boring –Drop (DBD) structures, indicate potential selling zones.
5. When a valid Demand Zone is detected, the script plots a Blue label below the relevant Boring candle.
6. When a valid Supply Zone is found, it plots a Red label above the relevant Boring candle.
7. The script includes an alert feature that notifies users in real-time whenever a valid demand or supply pattern is formed, allowing timely action
How Users can get benefited using this Script?
1. The labels and text plotted by the script help traders visually identify potential entry and exit points.
2. When a valid Demand Zone is detected and the price revisits it, it may indicate a potential bullish reversal.
3. When a valid Supply Zone is detected and the price revisits it, it may indicate a potential bearish reversal.
4. Users can integrate this script with other indicators, fundamental data, or sentiment analysis to confirm signals and make more informed decisions.
5. Traders should use proper risk management strategies, including stop-loss orders to limit losses and targets when the trade moves in their favor.
Settings Explained
1. Boring & Legin Ratio
This is the ratio between the Legin candle and the Boring candle.
A default value of 2 means the Legin candle size (High–Low) is twice the size (High–Low) of the Boring candle.
2. Leg-In & Leg-Out Ratio
This is the ratio of Legin candle and Legout candle.
A default value 2 means the Legout candle size (High-Low) is twice the size (High-Low) of the Legin candle.
3. Leg-In & Three-Leg-Out Ratio
This is the ratio of Legin candle and to the combined size of three Legout candles. A default value 2 means the overall size of the three Legout candles is twice that of the Legin candle.
4. Leg-In Body to Wick Ratio
It is the ratio between the body size of a candle and its total wick length.
A default value of 0.6 means that 60% of the total candle length should be the body.
Zone Selection Filters
1. All Possible Zones
Displays all types of zones, including with or without Clear Area and with or without True Range (TR) vs Average True Range (ATR) criteria
2. All Zones with TR Vs ATR
Shows all zones but with True Range (TR) vs Average True Range (ATR) criteria.
3. Clear Area Zone Only
It will show the Zone with Clear Area and either with or without TR Vs ATR compliance
Clear Area Zone – is considered when the body of the Legout candle does not overlap the Boring candle. In other words, the right side of the Boring candle area remains completely free
4. Clear Area Zone with TR vs ATR Compliance
It will show the Zone with Clear Area and with TR Vs ATR compliance
Note: No. 1 and 2 is suitable for Forex, and crypto market segment
No. 3 and 4 is suitable for commodity and stock market segment
What is TR Vs ATR Criteria?
TR (True Range) vs ATR (Average True Range) criteria is used to validate the strength of a Demand or Supply Zone and it is very important criteria.
For Legin Candle (first candle of the pattern from left) — TR value should be greater than the ATR value.
For Boring Candle (second candle of the pattern from left) — TR value should be smaller than the ATR value.
For Legout Candle (third ,fourth & fifth candle of the pattern from left) — TR value should again be greater than the ATR value,
Important:
Due to the high calculation effort, the history is limited to maximum 10 Zones in total. All zones prior to that will not be displayed so that chart remain clear. Once our indicator has started displaying a Zone, then zone will be visible until it exceeds maximum 10 Zone history. This indicator does not repaint. All signals remain fixed once a candle closes.
What Makes this Indicator Unique?
The Smart Dude Indicator stands out because it doesn’t just mark Demand and Supply Zones — it qualifies them using advanced candle behavior and volatility analysis by using TR Vs ATR analysis .
Unlike typical zone indicators that rely only on price structure, Smart Dude combines candle-to-candle ratio logic with TR vs ATR criteria
Why traders use this indicator?
This strategy is already being used by many experienced traders, including some of my close trading associates. They’ve seen results and even encouraged me to publish it so that more traders can benefit from it. The indicator combines key elements like candle ratio and TR vs ATR criteria, giving users a structured and reliable way to identify zones.
How this Indicator Is Original?
The Smart Dude Indicator is a fully original work — designed and coded from scratch with a unique logic structure.
It is not copied or derived from any existing open-source script.
Key points that make it unique and original:
Exclusive Candle Ratio Logic
TR vs ATR Integration
Clear Area Detection
Fully Hand-Written Logic
Every condition — from candle identification to ratio calculation and plotting — has been manually coded line by line without importing or modifying any existing public logic.
Disclaimer:
This indicator is only for educational purposes and that highlights potential market opportunities. It should not be treated as financial or investment advice.
Trading in financial markets involves risk. The indicator is designed to assist you in making more informed decisions but outcomes depend on your due intelligence and zone validation skills

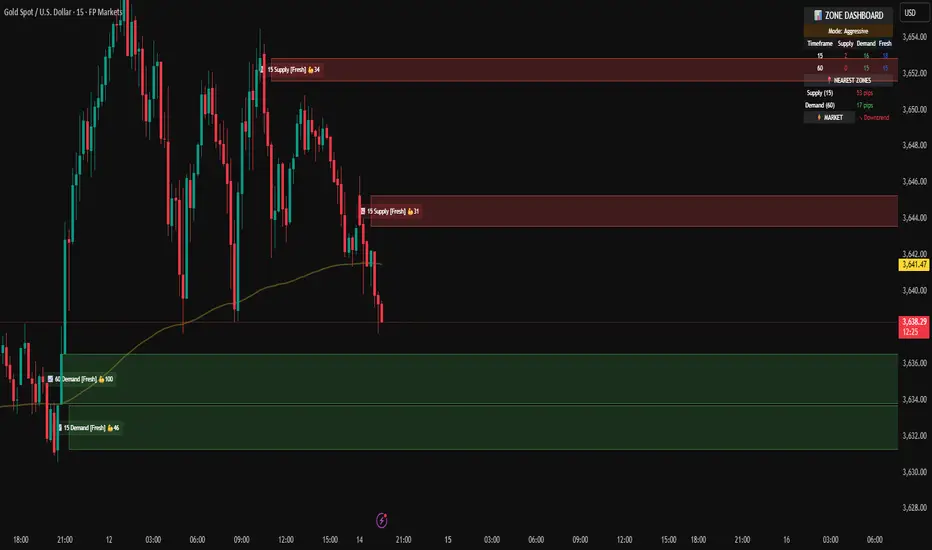
Demand & Supply Smart Zones (Riz)A professional zone engine that detects, ranks, and maintains Supply and Demand areas across multiple timeframes. It combines swing structure, engulfing/imbalance logic, optional liquidity-sweep validation, and trend/volume filters. Zones are refined, merged, aged, and removed automatically, while a dashboard and mini-map summarize the state of the market at a glance.
How it works (why this isn’t a simple mashup)
⦁ Zone Detection (Auto/Manual/Hybrid):
⦁ Auto finds zones from three independent catalysts: swing turns, engulfing patterns, and imbalance candles.
⦁ Manual lets you define a zone precisely (top/bottom + type).
⦁ Hybrid adds your manual zones on top of the model’s detections.
⦁ Strength Model: Each zone receives a score using ATR-scaled size, relative volume (vs SMA), timeframe weight (higher TF = more authority), and session context (optional Killzone boost). This surfaces the most actionable areas rather than plotting everything.
⦁ Filters for Quality (Conservative/Aggressive):
⦁ Conservative can require trend alignment (EMA), volume validation, wide-body candles, structure context, and optional liquidity sweep checks.
⦁ Aggressive relaxes filters for faster, more frequent zones (e.g., scalping).
⦁ Refinement & Styling: Zones can be refined by wick, body, or hybrid logic to avoid over-sized regions. Visuals support solid/gradient/border styles, fresh/retest labels, and a heat-map emoji for strength.
⦁ Lifecycle Management: Zones can auto-delete on touch, delete on break, shrink on retests, expire after X bars, and cap retests. Old/merged zones are cleaned up to keep charts responsive.
⦁ Multi-Timeframe (MTF) Logic: Detects and optionally normalizes HTF zones (e.g., 60/240/D). Overlapping zones are merged across TFs with the higher TF taking precedence and receiving a small strength bonus. This prevents duplication and emphasizes institutional levels.
⦁ Proximity & Interaction Alerts: Alerts can fire on approach, first entry, and break, with separate Supply/Demand variants and per-TF options. An internal tracker avoids duplicate alert spam.
On-chart tools
⦁ Zones: Supply (red) / Demand (green), with “Fresh” or “R#” labels and strength heat-map.
⦁ Dashboard: Counts zones per TF, shows nearest supply/demand (in pips), trend state, and mode.
⦁ Mini-Map: A compact list of the 10 closest zones with TF, freshness, strength, and distance.
⦁ Trend Line (optional): EMA for directional context.
⦁ Killzone Background (optional): Session emphasis for timing.
Inputs & Key Options
⦁ Detection Mode: Auto · Manual · Hybrid
⦁ Strictness: Aggressive (more zones) · Conservative (fewer, higher quality)
⦁ Catalysts: Engulfing, Imbalance (ATR + volume threshold), Swing strength
⦁ Filters: Volume multiplier, wide-body %, trend EMA, structure checks, liquidity sweep lookback
⦁ MTF: Up to 3 higher TFs, with normalization to prevent oversized zones and priority stacking
⦁ Management: Auto-delete on touch, delete on break, dynamic shrinking, expiry bars, max retests
⦁ Merging: Overlap threshold and cross-TF consolidation
⦁ Alerts: Proximity (distance in pips), First Entry (fresh touch), Break, per-TF toggles
⦁ Display: Labels, size, heat-map, merging tags, dashboard position, mini-map
How to use
1. Choose Strictness
⦁ Conservative for swing/HTF traders who prefer cleaner, stronger zones.
⦁ Aggressive for scalpers who want earlier, more frequent levels.
2. Enable MTF and set HTF1/HTF2(/HTF3). Turn on Normalization to avoid giant HTF boxes.
3. Pick Catalysts & Filters. Start with Engulfing + Imbalance + Swing. Add volume/EMA/liquidity filters for quality.
4. Watch the Dashboard: It highlights mode, counts per TF, nearest zones (with distance), and overall trend.
5. Trade the Interaction:
⦁ Proximity alert → prepare;
⦁ First entry (fresh touch) → your confirmation rules;
⦁ Break → consider flips or invalidation.
6. Manual Zones (Hybrid): Add precise institutional levels and let the engine manage them (shrink, expire, merge).
Alerts (titles you’ll see)
⦁ Zone Proximity – approach within X pips
⦁ Zone Entry / Supply Zone Entry / Demand Zone Entry – first touch
⦁ Zone Break / Supply Zone Break / Demand Zone Break – clean break
⦁ Current TF / HTF1 / HTF2 Zone Alert – timeframe-specific triggers
⦁ Any Zone Alert – catch-all for any interaction
Notes & Tips
⦁ Fresh > Retested: First touches generally score better and are labeled accordingly.
⦁ Context Matters: Combining HTF zones with trend and volume filters significantly improves selectivity.
⦁ Performance: Zone limits and periodic cleanup are built in. If you plot many HTFs with Aggressive mode, consider raising strictness or lowering max zones.
Disclaimer
This tool is for educational and analytical purposes only. It does not constitute financial advice, nor does it guarantee outcomes. Trading involves risk; use proper risk management and your own judgment.
Smart support and Resistancehelps you find out where smart money has done bulk buying/selling.
the levels can give you confidence on your existing views and find high reward low risk setups.

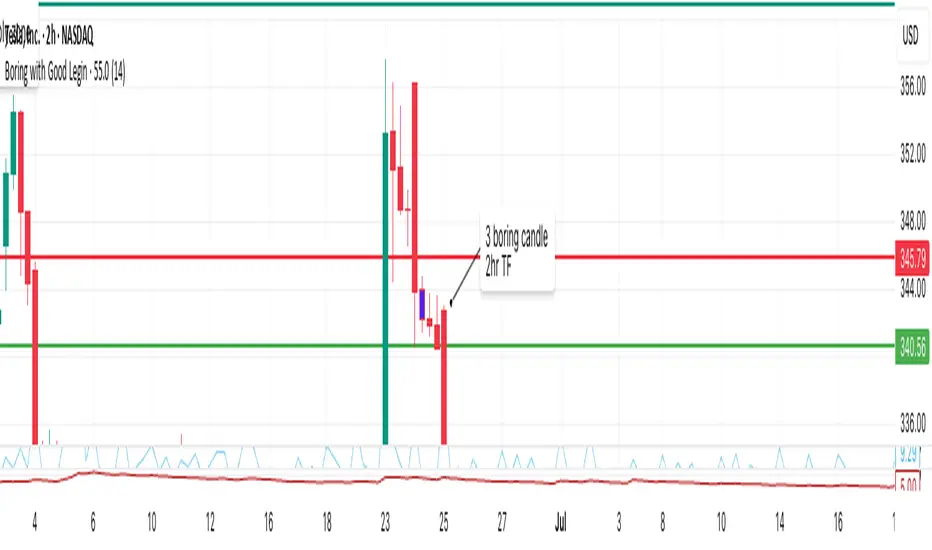
Boring w/Prev LeginThis TradingView Pine Script highlights “boring” candles that follow a specific “legin” candle, based on strict supply/demand zone and price action rules inspired by your trading strategy.
A candle will be highlighted if it meets all of these:
The current candle is “boring” (low volatility, small range).
The previous candle was a “legin” (high volatility, big move).
The previous “legin” was much larger than the current “boring” candle (by TR or size).
The boring candle has both upper and lower wicks (not a marubozu).
The legin candle had a strong body (≥70% of its size) and a wick on its close side (showing strong price rejection).
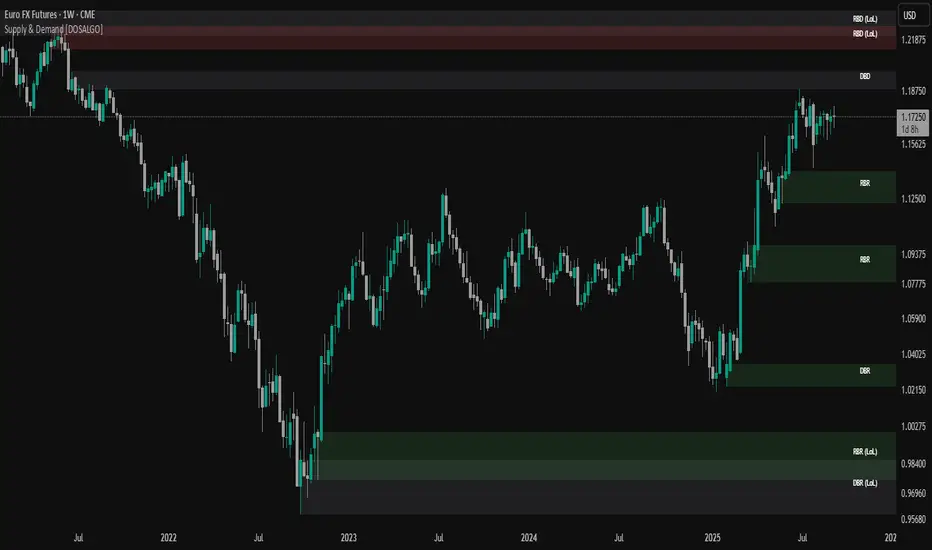
Supply & Demand (OTC)Supply & Demand - Advanced Zone Detection
Overview
This indicator is a sophisticated tool designed to automatically identify and draw high-probability supply and demand zones on your chart. It analyzes pure price action to find key areas where institutional buying and selling pressure has previously occurred, providing you with a clear map of potential market turning points.
Unlike basic supply and demand indicators, this script is built with a proprietary engine that intelligently defines zone boundaries and filters for the most relevant price action patterns. It's designed to be a clean, professional, and highly customizable tool for traders who use supply and demand as a core part of their strategy.
Features
Advanced Zone Detection: Automatically finds and draws supply and demand zones based on significant price imbalances.
Reversal & Continuation Patterns: Identifies all four major price action patterns: Rally-Base-Drop (RBD), Drop-Base-Rally (DBR), Rally-Base-Rally (RBR), and Drop-Base-Drop (DBD).
"Level on Level" (LoL) Analysis: Automatically detects and labels zones that are stacked closely together, highlighting areas of potentially high liquidity and significance.
Wider vs. Preferred Zones: Choose between two zone definition modes. "Wider" mode draws the zone based on the full range of the consolidation, while "Preferred" mode refines the entry line based on key price action within the base, offering more precision.
Smart Zone Display: Intelligently displays only the most relevant zones closest to the current price, keeping your chart clean and focused. Supply zones above the current price and demand zones below are automatically prioritized and displayed based on your settings.
Customizable Zone Interaction: Control how zones react after being tested. Zones can change color on a first touch and be automatically deleted after a significant violation, which you can define by a percentage.
Customizable Visuals & Alerts: Fully customize the colors of all zones and candles. Enable or disable alerts for new zone creation and zone touches to stay on top of market movements.
How to Use
Identify Zones: The indicator will automatically plot supply zones (red) above the price and demand zones (green) below the price. These are potential areas to look for trade entries.
Assess Zone Strength: The strongest zones are typically "fresh" (untouched) and are formed by a strong, explosive move away from a tight consolidation (a small number of base candles).
Use Labels for Context: The floating labels (RBD, DBR, RBR (LoL), etc.) provide immediate context about the price action structure that formed each zone. "LoL" indicates a "Level on Level" zone, which may be of higher importance.
Wait for Confirmation: For the highest probability setups, wait for the price to return to a zone and show signs of rejection (e.g., reversal candlestick patterns) before considering an entry.
Settings Overview
Zone Definition: Control the core logic, such as including continuation patterns, setting the max number of base candles, and choosing between Wider and Preferred zone types.
Zone Display & Limits: Toggle limits on or off, and specify the maximum number of supply and demand zones to show on the chart.
Zone Interaction: Define how zones react to being tested, including the percentage required to delete a zone.
Colors & Style: Fully customize the appearance of zones, labels, and price candles.
Alerts: Enable or disable alerts for key events.
Disclaimer
This indicator is a tool for market analysis and should not be considered financial advice or a signal provider. Always use proper risk management and conduct your own analysis before making any trading decisions. Past performance is not indicative of future results.
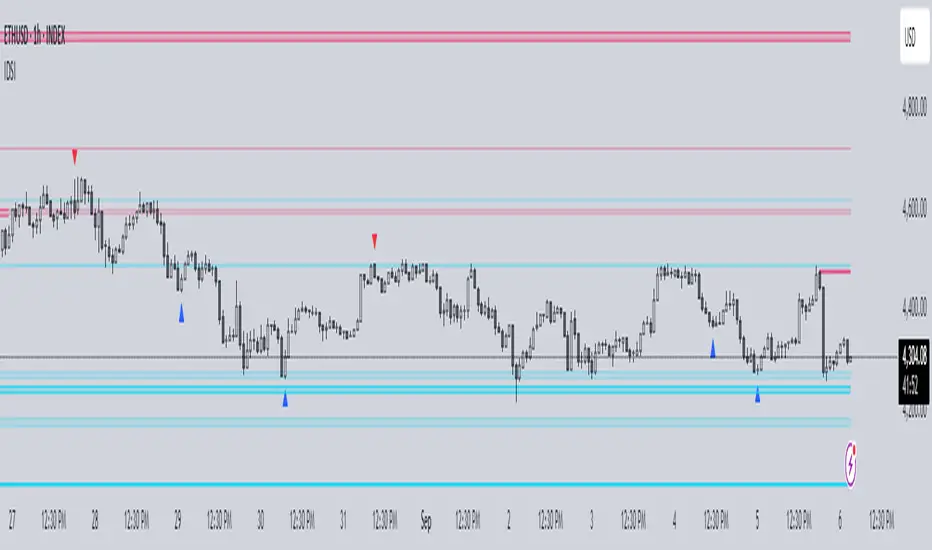
JJ Psychological Levels (125 Increments)Psychological Levels Indicator
Description:
The Psychological Levels Indicator is a versatile tool designed for traders to identify key price levels that often act as support or resistance zones in the market. These levels are plotted at regular intervals, customizable by the user, starting from a base price level. This is particularly useful for spotting psychological price points that traders and investors frequently monitor.
Key Features:
1.Dynamic Psychological Levels:
- The script calculates and displays horizontal lines at price levels separated by customizable increments (default: 125 points).
- These levels are dynamically adjusted to the visible range of the chart.
2. Customizable Inputs:
- Starting Level: Set the base level from which increments are calculated (e.g., 0 or 1000).
- Step Size: Define the interval between levels (e.g., 125 for indices like Bank NIFTY).
3. Visual Representation:
- Horizontal lines are drawn at each psychological level, helping traders quickly identify key zones.
- Labels are placed next to each level, displaying the corresponding price for easy reference.
4. Application Across Instruments:
- This indicator works seamlessly with various asset classes, including stocks, indices, forex, and cryptocurrencies.
How to Use:
1.Identify Key Price Zones:
- Use the plotted psychological levels to spot areas where price action is likely to react.
- Levels such as 1125, 1250, and 1375 (for a step size of 125) are visually highlighted.
2. Plan Trades Around Key Levels:
- These levels can act as support/resistance or breakout points, providing opportunities for entry, exit, and stop-loss placement.
3. Customizable Settings:
- Adjust the starting level and step size to tailor the indicator to your trading instrument or strategy.
Why Psychological Levels Matter:
Psychological levels are widely followed by traders and often coincide with key market turning points due to their significance in human behavior and market psychology. They are frequently used by institutional traders, making them valuable reference points for intraday and swing trading.
Custom Settings:
- **Starting Level:** Default: `0`
- **Step Size:** Default: `125`
Disclaimer:
This indicator is a technical analysis tool and is not intended to provide financial advice. Always combine it with other indicators and perform your due diligence before making trading decisions.

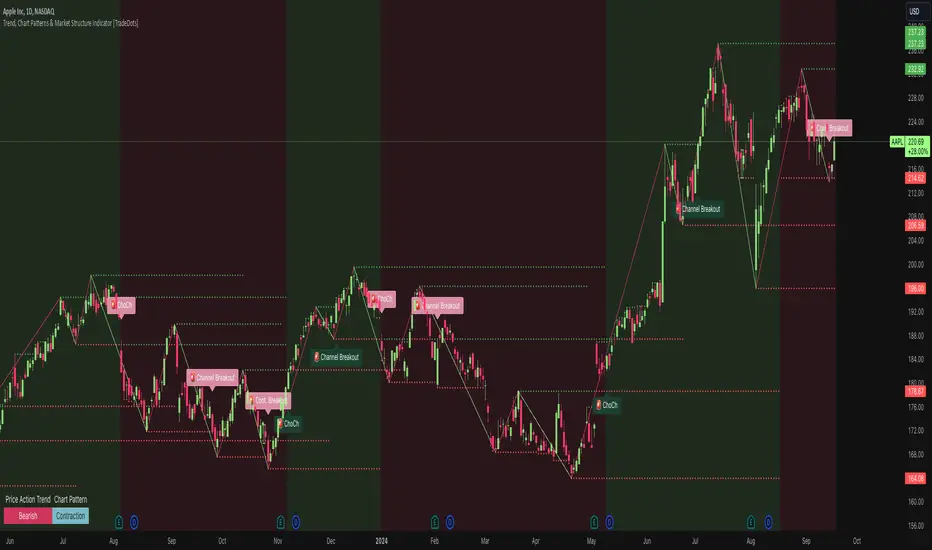
Trend, Chart Patterns & Market Structure Indicator [TradeDots]The "Trend, Chart Patterns & Market Structure Indicator" is engineered to identify pivotal price action points, revealing shifts in market dynamics. This tool aids traders to simplify any trading market in recognizing significant price levels, enhancing decision-making in diverse market conditions.
📝 HOW IT WORKS
Pivot Identification
The indicator detects pivots in price action using a complex mathematical model by analyzing a window of candlesticks to capture significant reversal patterns. It examines a series of bars, focusing on their open, high, low, close, and changes in these values, to pinpoint potential market turning points.
Support and Resistance Lines
Calculation: Automatically draws lines at key price pivots in bullish and bearish markets.
Significance: Aligning support and resistance levels highlights strong demand or supply zones, reinforcing trading biases. When multiple lines converge near a price level, it indicates robust support or resistance, as many traders focus on these levels for placing trades.
Chart Patterns Analysis
Formation: Utilizes four pivots to identify patterns such as ascending/descending channels, contraction, and expansion patterns.
Visualization: Background colors (green for bullish, red for bearish) help identify market trends.
Market Structure Shifts
Detection: Identifies price breakouts above or below previous support and resistance, indicating changes in market structure.
Confirmation: Highlights shifts in market character, aiding in trend reversal anticipation.
Types of Market Structure Shifts
Channel Breakout: The price breaks out from the current channel's resistance level.
Rev. Breakout: The price breaks out from a contraction pattern, moving in the opposite direction of the previous market trend.
Continuation Breakout: The price breaks out from a contraction pattern, continuing the previous market trend.
Change of Character (ChoCh): The price breaks out from either support or resistance, causing a change in the market trend.
🛠️ HOW TO USE
Chart Visualization
Color Coding: Background colors signify market trends, with green indicating bullish and red indicating bearish conditions.
Pattern Recognition: Identifies and labels patterns, providing insights into current market sentiment.
Reversal Signals
Signal Labels: Detects shifts in market structure indicating potential entry and exit points.
❗️LIMITATIONS
Market Noise: Accuracy may decrease in volatile and noisy markets.
Trend Confirmation Delay: Market trends are only confirmed once the price breaks out from support or resistance, potentially causing delays.
RISK DISCLAIMER
Trading involves substantial risk, and most traders may incur losses. All content, tools, scripts, articles, and education provided by TradeDots are for informational and educational purposes only.
Institutional Demand Supply IndicatorINTRODUCTION
Institutional demand and supply zones are key areas on a price chart where large institutional traders, such as banks and hedge funds, place significant buy or sell orders. These zones often act as strong support or resistance levels due to the substantial volume of trades executed by institutions.
There are various ways to identify these areas of interest on the charts, but the main goal is to study the price movements, especially significant ones. Large financial entities tend to operate in the same price areas repeatedly. Instead of chasing price movements and risking counter moves, it's better to wait for the price to return to these areas, expecting that these entities will buy or sell there again.
INDICATOR SETTINGS:
1. High Probability Zones (HPZ) - High Probability Zones (HPZ) are demand and supply zones identified using advanced calculations to highlight the most relevant and significant areas. These zones have a higher probability of impacting price movements. Better to keep it turned On.
2. Zone Extension? - Extending zones can be useful for identifying areas that have already been retraced as these zones may continue to influence market dynamics despite the retracement.
3. Zone Type - This option lets you select the zone layout type. 4 options are given which are self explanatory.
4. Directional Candle Count - This option keeps a count of number of consecutive bullish / bearish candle that you would like to set as qualifying parameter for demand / supply zone. For Example - If you keep the number 1, the script will draw a demand or supply zone by just checking if 1 candle has met all the criteria's and calculations.
5. Zone Validity Percentage - You can set the percent change for the number of candles mentioned in point 4 above.
6. HPZ - Keep the number between 6 to 10. As you move the number up, less number of zones will be displayed.
7. Zone Count - You can adjust the number of visible demand and supply zones on the chart. Increase this number if you want to display more zones, or decrease it if the chart becomes too cluttered.
D I S P L A Y
1. Background Color Demand / Supply Zone - This is the background color of demand and supply zone.
2. Channel Color Demand / Supply Zone - This is the color of channel.
3. Channel Line Style - Choose between Solid, dotted or dashed.
4. Background Color Transparency - Choose the transparency of background color
5. Channel Line Width - Choose Channel line width between 1 to 4.
6. Channel Line Transparency - Choose Channel Line Transparency and keep it between 1 to 100.
Sometimes, a level may be breached on one timeframe, but that doesn’t mean the indicator is not working. To understand the price action better, switch to a different timeframe to check why that level was breached and why it found support at a different zone on another timeframe. Look at the 2 screenshots below.
Demand Supply Zone AlertsDemand Supply Zone Alert Indicator
This indicator functions as a scanner/screener and is designed to identify symbols with potential demand and supply zones and generate alerts based on your customized settings. It does not visually plot anything on the chart but is used to place alerts.
Key Features:
1. Demand Supply Zone Patterns:
- Drop Base Rally
- Rally Base Rally
- Rally Base Drop
- Drop Base Drop
2. Zoning Methods:
- Wick to Wick: In a demand zone, this method uses the highest high of the basing as the proximal line. For supply zones, it uses the lowest low of the basing.
- Body to Wick: In a demand zone, this method uses the highest body of the basing as the proximal line. For supply zones, it uses the lowest body of the basing.
3. Legin Methods:
- Candle Type: Based on the candle's bullish or bearish structure.
- Candle Color: Uses the candle color to determine the legin, with green indicating a rally and red indicating a drop.
4. Additional Zone Options:
- Follow Through Pattern: Zones with one legout followed by another legout, based on user-defined strength settings.
- Overnight Gap Zones: Zones formed due to overnight gaps after the basing.
- All Demand Supply Zone Structures: Includes all zones, even if they are not considered quality zones.
5. Zone Settings:
- Number of Candles in Basing: Customize the number of candles in the basing phase. For example, setting it to 3 will only identify zones with 3 or fewer basing candles.
- Legout Strength for Single Legout Pattern: Defines how strong a legout candle must be to qualify as a zone.
- Legout Strength for Follow-Through Pattern: Specifies the strength required for two consecutive legout candles to qualify as a follow-through pattern.
Functionality:
The indicator identifies zones based on a three-component structure: legin, basing, and legout. It uses an algorithm that categorizes candles as legin, basing, or legout based on their range compared to the average candle on the chart. Quality zones are defined by legout candles that are significantly larger than the average candle, while basing candles are smaller.
Once a valid zone structure is identified, the indicator will generate an alert from the list of symbols provided in the settings. Alerts will notify users according to their alert notification settings.
Usage Recommendations:
- This indicator works as a real-time scanner or screener to shortlist symbols when a valid zone is formed based on user settings.
- It aids in identifying potential demand and supply zones, but does not provide explicit buy or sell signals.
- Users should integrate this tool with their own trading plan and thoroughly evaluate any identified symbols before making trades.
Limitations:
This indicator does not provide explicit buy or sell signals. It is intended to aid in identifying symbols where demand and supply zones are being created. Users should use this tool in conjunction with their own trade plan and thoroughly evaluate any identified symbols before making any trades.
Disclaimer:
Please ensure you thoroughly evaluate and qualify any identified symbols according to your individual trade plan before making any trades.

Indecisive CandlesAn Indecisive Candle, often referred to as a Base Candle, is a pivotal element in technical analysis, particularly for identifying institutional supply and demand zones. These candles are characterized by their small bodies and long wicks, reflecting a balance between buyers and sellers, indicating a potential pause or consolidation in the market.
To calculate whether a candle qualifies as an indecisive candle based on the criterion that its body (the absolute difference between its open and close prices) is less than or equal to 50% of the total range of the candle (the difference between its high and low prices).
Key Features:
Small Real Body: Signifies minimal movement from open to close, indicating market indecision.
Long Upper and Lower Wicks: Show that both bulls and bears attempted to control the price, but neither succeeded, leading to a standoff.
Formation Context: Typically found at the end of a strong trend or within a consolidation phase, hinting at a potential reversal or continuation pattern.
Usage in Identifying Institutional Supply and Demand:
Supply Zones: When an Indecisive Candle forms after a rally, it can mark the onset of an institutional supply zone, suggesting that large entities are starting to sell, leading to potential downward pressure.
Demand Zones: Conversely, when this candle appears after a downtrend, it often signals the emergence of a demand zone, where institutions begin to accumulate, anticipating a price increase.
Trading Strategies:
Zone Identification: Use Indecisive Candles to pinpoint key supply and demand zones on your chart, enhancing the accuracy of your support and resistance levels.
Confirmation: Look for confirmation from subsequent price action or volume spikes to validate the presence of institutional activity before making trading decisions.
Risk Management: Place stop-loss orders beyond the wicks of these candles to protect against false breakouts or continued indecision.
Conclusion:
Indecisive Candles are essential tools for traders looking to understand market sentiment and institutional behavior. By mastering their identification and interpretation, you can enhance your ability to spot high-probability trading opportunities and manage risks effectively.

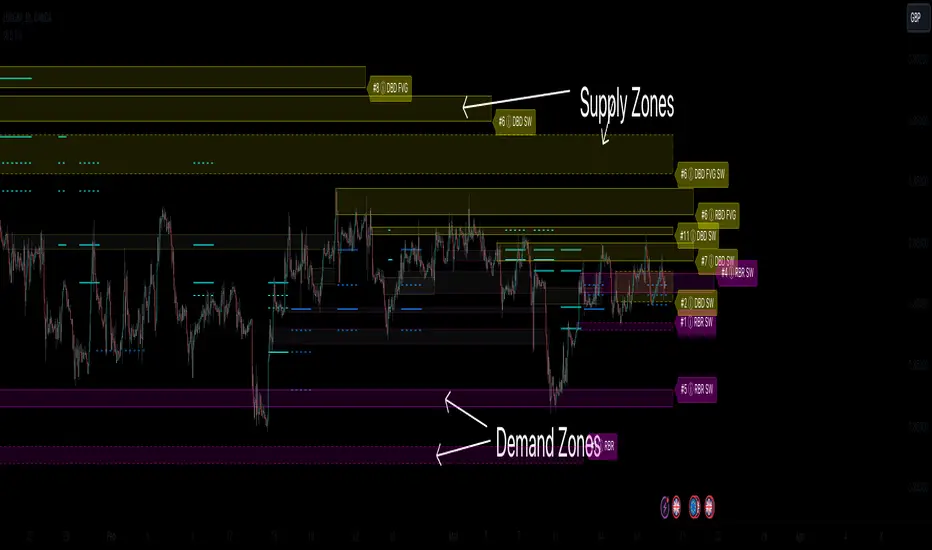
Supply & Demand Zones (Order Block) Pro [BacktestBot]Supply & Demand Zones (Order Block) Pro with DBD/RBR/RBD/DBR/FVG
This indicator helps to identify large price moves driven by banks and institutions. It can be used for any asset type (FOREX, crypto, commodities, indices) and any timeframe.
How to use this indicator
Message me to gain access. I try to reply within 24 hours.
Consider this as more of a visual aid to add to your confluences.
Use a side by side chart layout with different timeframes to see more zones.
(See example of use at the bottom)
Pullback trades are popular with zones.
⭑⭑⭑ Zones ⭑⭑⭑
How are zones created?
Supply zones are created when the price drops quickly, so are found above the price action.
Demand zones are created when the price rallies quickly, so are found below the price action.
The script uses a combination of quick price movements and user defined minimum price % changes. All user defined settings have default settings which vary depending on asset type and timeframe.
What is a strong zone?
The zones boxes have either a dashed border or a solid border. A solid border represents a strong zone which is when
the price has moved very quickly from it, or
the price has bounced off the zone multiple times.
What is a deactivated zone?
When the price has gone through the zone by a certain %, the zone is deactivated and displayed in a more transparant colour.
How are deactivated zones used for switch zones?
When a new zone is created, it is checked to see if it overlaps a recently deactivated zone.
e.g. If a new demand zone overlaps a recently deactivated supply zone, then the zone has switched from supply to demand. This might mean the new zone could be a strong one and the number of hits on the previous zone (also a potential indicator of strength) is displayed in the zone label tooltip.
Zone information
Basic zone information can be found in the zone label.
Users can choose what information is displayed in the label including the number of hits and prices.
More detailed information can be found in the zone label tooltip.
Hovering over the label will display more information including the zone start time and height %.
DBD/RBR/RBD/DBR/FVG
Zones are defined as drop base drop, rally base rally, rally base drop, drop base rally, and fair value gap.
Zone height
Users have the option of choosing
Wick to wick, or
Wick to body
The indicator does its best to meet the user preference but sometimes it is not possible. The information in the label tooltip will show if the preference was matched.
Minimum and maximum height default settings help to prevent zone boxes which might fill the whole chart.
⭑⭑⭑ Lines of Interest ⭑⭑⭑
Lines of interest are displayed as an added bonus.
Long wick
Long wicks might show areas of support or resistance. Very long and long wicks are defined by the % change in the wicks.
Very long wick lines are always displayed, and long wicks are displayed if they are not near a zone.
Possible Support / Resistance
After a big rally or drop, lines are displayed to show where the price might pullback to. These lines can act as possible support or resistance, and
are taken from recently deactivated zones. A solid line respresents a strong deactivated zone.
⭑⭑⭑ Alerts ⭑⭑⭑
Limit the number of alerts to the recommended ones. Consider this as more of a visual aid to add to your confluences.
Alert types
Early alerts happen immediately.
Bar end alerts happen when the bar closes.
Alert display
Alerts can be displayed on the chart with symbols. The most recent symbols have a tooltip which allow alert information to be displayed when hovering over them.
It is recommended to turn the alert display off, as it can clutter up the chart. The alerts will continue to work with the display off.
⭑⭑⭑ Example of use ⭑⭑⭑
Side by side chart with different timeframes
⭑⭑⭑ Disclaimer ⭑⭑⭑
Trading is very high risk. All content, tools and scripts provided by BacktestBot are for informational & educational purposes only. Past performance does not guarantee future results.
[AlbaTherium] OptiStruct™ Premium for Smart Money Concepts An Insight into Structure Mapping and Order Block Identification with Smart Money Concepts
Introduction:
Structure Mapping & Demands and Supplies Premium serves as a fundamental pillar in the realm of Smart Money Concepts . This indicator adeptly charts the market structure based on a refined version of SMC while identifying Order Blocks. All the concepts embedded in this method are meticulously defined, offering users the ability to chart the market structure with precision and heightened confidence. With this indicator, there is no need for excessive questioning of the accuracy of your markings; it diligently strives to perform this task effectively. There are no hidden 'magic' properties underlying this indicator, ensuring that our users can independently verify each and every feature. It is this commitment to transparency that sets us apart and makes us unique in the market.
In this discussion, we delve into the intricacies of Break of Structure, Change of Character , and SMART MONEY TRAP . We also introduce the concepts of Extreme Order Blocks, Decisional Order Blocks , and Smart Money Trap Order Blocks .
Chapter 1: Understanding Structure Mapping:
Let's begin with some definitions:
- Inside bars are candles that lie within the range of a preceding candle.
- Pullbacks occur in an uptrend when the low of a preceding candle's range (excluding inside bars ) is breached, and the price continues to rise.
- Inducements (IDM) are price levels defined as the low of the latest pullback before the most recent high. They often act as liquidity points that the market revisits before continuing its move.
Break of Structure (BoS):
In an uptrend, after surpassing an IDM , the most recent high becomes a Confirmed structure high, or a Major High . If the price then closes above this Major High, a Bullish Break of Structure (Bullish BoS) is confirmed. Similarly, the lowest point between these movements becomes a Confirmed structure low or Major Low in a downtrend.
Change of Character (ChoCh):
In an uptrend, if the price falls below a Major Low, it indicates a shift in market bias from Bullish to Bearish, or a Bearish Change of Character .
Example of a bullish ChoCh:
Chapter 2: The Significance of Order Blocks:
Order Blocks (OB) play a pivotal role in Smart Money Concepts during entry points. Understanding what they represent and how to identify them is essential. For a Bullish/Bearish Order Block to be confirmed, specific conditions, including price imbalance and breaching the previous candle's high or low, must be met. We will delve into the finer details of identifying and trading Order Blocks, with an emphasis on the fact that price often reacts from Decisional Order Blocks, Extreme Order Blocks , and Smart Money Trap Order Blocks .
An OB is the initial candle range of a pullback that creates a Fair value gap.
These are zones where proactive traders enter the market, resulting in significant price changes indicated by Fair value gaps. It is believed that when the price revisits these zones in the future, it tends to bounce back. This property makes Order Blocks excellent potential entry points.
Order Blocks are categorized as follows:
- Extreme OB : The first and lowest OB between the Major Low and Major High.
- Decisional OB : The most recent OB lower than the current IDM.
- Smart Money Traps : All OBs between Extreme and Decisional OB.
- Demand above IDM / Supply below IDM
Chapter 3: Understanding SMART MONEY TRAP (SMT):
SMART MONEY TRAP is a concept that brings clarity to the distinction between Structure and Order Blocks within Smart Money Concepts and is a unique feature of this indicator. While many Smart Money Traders base their trades on Structure and Order Blocks, it's crucial to recognize that Order Blocks serve as an additional confirmation for buy or sell decisions. Blindly trading based on Order Blocks is not advisable. Instead, traders should exercise patience and await other confirmations like inducement or Liquidity sweep before executing trades on Order Blocks. We will illustrate how this concept works in practice.
In the example above, the market made a high wick up, taking out the buy-side liquidity, then made a bearish ChoCh. We place our sell order on the order block above IDM. This presents a promising trading opportunity, with a stop loss placed above the OB and a take profit set at the low of previous structure.
Conclusion:
Structure Mapping & Demands and Supplies Premium as the epitome of Smart Money Concepts, presenting traders with a tool meticulously crafted for an exceptional user experience . This indicator integrates structural mapping and Order Blocks, providing not only a wealth of knowledge but a platform tailor-made for personalization to suit your unique style and preferences. By mastering the nuances of Impulsive Moves and Corrections, and expertly identifying and trading Order Blocks while considering the SMART MONEY TRAP, traders gain a distinct advantage in the ever-evolving financial markets.
This document serves as an enriching guide to Structure Mapping & Demands and Supplies Premium, accentuating its pivotal role within the Smart Money Concepts framework. We invite users to immerse themselves in an experience that transcends the ordinary, delving into the intricacies that define successful trading. As you navigate the complexities of the market, these detailed insights become your compass, providing a rich and customizable user experience that unlocks the full potential of Smart Money Concepts. Embrace these tools judiciously, and empower your daily analysis with a wealth of information that truly holds its weight in gold.

Demand and Supply Zones Lite [Afnan]Are you looking to level up your trading game and spot potential turning points in the stock market? Introducing the Smart Money Demand and Supply Zones indicator, a powerful tool designed to identify opportunities created by the Smart money.
The Smart Money Demand and Supply Zones indicator is built upon the principles of Rally Base Rally (RBR), Rally Base Drop (RBD), Drop Base Rally (DBR), Drop Base Drop (DBD).
🔍 Key Details 🔍
The "Smart Money" concept refers to large institutional investors and professional traders who possess significant financial resources and expertise. The importance of smart money lies in their influence on market trends and price movements. Their actions and positions often serve as signals for retail traders and investors to make informed decisions.
Formation of Smart Money: Smart money is attracted to areas in the market where they can find favourable risk-to-reward opportunities.
1. Rally Base Rally (RBR) Zones: These zones occur after a rally (upward price movement), followed by a period of consolidation (base formation), and then another rally. Smart money often forms positions here as it suggests a strong uptrend continuation.
2. Rally Base Drop (RBD) Zones: In this case, there is a rally, followed by a base formation, but instead of another rally, the price drops. Smart money may position themselves here in anticipation of a potential trend reversal.
3. Drop Base Rally (DBR) Zones: These zones form when there is a drop in price, followed by a base formation, and then a rally. Smart money may take positions here, expecting a trend reversal to the upside.
4. Drop Base Drop (DBD) Zones: In this scenario, the price drops, then forms a base, but subsequently continues to drop. Smart money might take bearish positions here, anticipating further downward movement.
🚀 Pending Orders from Smart Money Zones: 🚀
When the price approaches these smart money zones, institutional investors often place remaining pending orders to enter the market.
By identifying RBR/DBR zones as potential buying opportunities and RBD/DBD zones as potential selling opportunities on price charts, retail traders can align their trades with smart money activities. Implementing proper risk management and confirming signals enhances the likelihood of successful trades by following the footsteps of institutional investors.
💡 Key Features of the Indicator 💡
This indicator includes the following features:
Customizable Zone Length: Adjust the number of base candles in a zone to suit your preferences and strategy.
Candle Body Size Customization: Personalize the body size of candles for fine-tuning visual representation.
Base Candle Selection: Choose between the body of the candle or narrow range candles as the base candle for zone plotting.
Colour Customization For Candles: Customize Drop, Base, Rally, and Zone colours to match your visual preferences.
Number of Zones: This feature is flexible, allowing you to customize the quantity of zones displayed on the chart for improved visibility.
Zone Colours: You have the option to personalize the colours for both fresh and tested zones based on your preferences.
Zone Strength Customization: Adjust candle sensitivity for better control.
Swing High and Swing Low: Enable or disable support and demand lines based on Swing High and Swing Low.
Wick of Candle: Customize zone plotting using the body or wicks of candles for flexible analysis.
Previous Zones: You can choose to display or disable previous zones on the chart that have been deleted and utilized before. This option helps you maintain a clutter-free chart while retaining valuable historical information.
Moving Averages: Utilize four (4) customizable Moving Averages to enhance analysis from any time frame.
💎 Employing a Top-Down Approach and Multiple Time Frame Analysis: 💎
Let's delve into the concept of adopting a top-down approach combined with multiple time frame analysis in trading scenarios. It is consistently recommended to trade with the trend because, as the saying goes, "the trend is your friend." If you identify a demand zone on the chart but the overall trend is downward, it's crucial to confirm the stock's trend in higher timeframes. Avoid purchasing from the demand zone in such a scenario as you would be going against the trend. To consider buying from the demand zone, ensure that the overall trend is upward by checking the higher timeframe.
Similarly, if the higher timeframe trend is upward but the price is approaching a higher timeframe supply zone, refrain from buying in the lower timeframe. If the price reaches a higher timeframe supply zone, there is a likelihood that the price will face rejection from this zone.
If the price is significantly extended from the EMA 20 on a higher timeframe, for instance, if you plan to trade on a 30-minute timeframe and the price is considerably extended from the daily EMA 20, consider trading from zones that are closer to the daily EMA 20. When the price is extended from the higher timeframe EMA 20, it implies that the price is expensive, and there may be a tendency for it to return to the EMA 20. Therefore, it is advisable to trade from zones that are closer to the higher timeframe EMA 20 and avoid zones that are extended from the higher timeframe EMA 20.
For instance, imagine you're considering purchasing a stock that has reached a demand zone known as Rally Base Rally (RBR). If you identify a corresponding demand zone in a higher time frame located at the same position, and concurrently observe that the intermediate time frame indicates an upward trend, your potential for a successful trade is enhanced.
Conversely, if you spot a buying zone in a lower time frame, but notice a supply zone in the higher time frame at that exact position, the likelihood of a profitable trade decreases significantly. In such cases, it's prudent to steer clear of the lower time frame zone. This emphasizes the critical significance of employing a top-down approach or conducting a multiple time frame analysis.
Note: By Doing top down approach you can easily follow the footprints of smart money in the stock market or any other market by using this indicator and make well-informed trading decisions.
Remember, don't make decisions based only on one time frame. Check the overall trend of the stock and look at buying and selling points on bigger time scales. If you only use one time scale, your chances of making successful trades will be lower.
💎 To execute these comprehensive analyses and optimize your trading outcomes, you can make use of my indicator called "Demand & Supply Zone Scoring: Rally Base & Drop Concept."💎
This indicator is thoughtfully crafted to assess the strength of trade setups based on demand and supply zones through a scoring mechanism. It serves as your guide for correct top-down and multiple time frame analysis, eliminating the possibility of overlooking any strategic parameters. To gain deeper insights, you can learn more about how to use this indicator in its description.
Lastly, Thank you for your support, your likes & comments." Feel free to ask if you have questions.
Let's conquer the markets together! 🚀

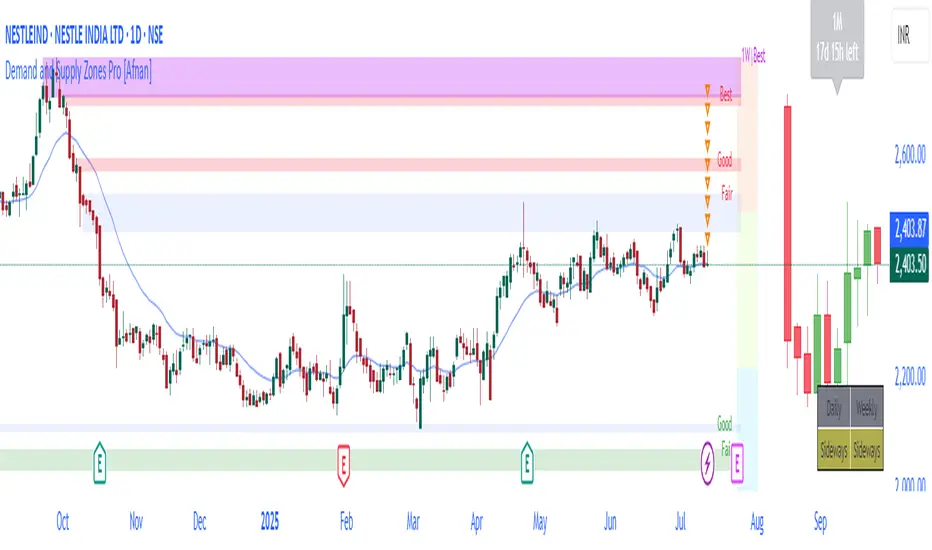
Demand and Supply Zones Pro [Afnan]Are you looking to level up your trading game and spot potential turning points in the stock market? Introducing the Smart Money Demand and Supply Zones indicator, a powerful tool designed to identify opportunities created by the Smart money.
The Smart Money Demand and Supply Zones indicator is built upon the principles of Rally Base Rally (RBR), Rally Base Drop (RBD), Drop Base Rally (DBR), Drop Base Drop (DBD).
🔍 Key Details 🔍
The "Smart Money" concept refers to large institutional investors and professional traders who possess significant financial resources and expertise. The importance of smart money lies in their influence on market trends and price movements. Their actions and positions often serve as signals for retail traders and investors to make informed decisions.
Formation of Smart Money: Smart money is attracted to areas in the market where they can find favourable risk-to-reward opportunities.
1. Rally Base Rally (RBR) Zones: These zones occur after a rally (upward price movement), followed by a period of consolidation (base formation), and then another rally. Smart money often forms positions here as it suggests a strong uptrend continuation.
2. Rally Base Drop (RBD) Zones: In this case, there is a rally, followed by a base formation, but instead of another rally, the price drops. Smart money may position themselves here in anticipation of a potential trend reversal.
3. Drop Base Rally (DBR) Zones: These zones form when there is a drop in price, followed by a base formation, and then a rally. Smart money may take positions here, expecting a trend reversal to the upside.
4. Drop Base Drop (DBD) Zones: In this scenario, the price drops, then forms a base, but subsequently continues to drop. Smart money might take bearish positions here, anticipating further downward movement.
🚀 Pending Orders from Smart Money Zones: 🚀
When the price approaches these smart money zones, institutional investors often place remaining pending orders to enter the market.
By identifying RBR/DBR zones as potential buying opportunities and RBD/DBD zones as potential selling opportunities on price charts, retail traders can align their trades with smart money activities. Implementing proper risk management and confirming signals enhances the likelihood of successful trades by following the footsteps of institutional investors.
💡 Key Features of the Indicator 💡
This indicator includes the following features:
Customizable Zone Length: Adjust the number of base candles in a zone to suit your preferences and strategy.
Candle Body Size Customization: Personalize the body size of candles for fine-tuning visual representation.
Alert Feature: The alert feature can notify you when the price reaches a demand or supply zone, with the ability to customize the risk-to-reward parameters.
Base Candle Selection: Choose between the body of the candle or narrow range candles as the base candle for zone plotting.
Colour Customization For Candles: Customize Drop, Base, Rally, and Zone colours to match your visual preferences.
Number of Zones: This feature is flexible, allowing you to customize the quantity of zones displayed on the chart for improved visibility.
Zone Colours: You have the option to personalize the colours for both fresh and tested zones based on your preferences.
Zone Strength Customization: Adjust candle sensitivity for better control.
Swing High and Swing Low: Enable or disable support and demand lines based on Swing High and Swing Low.
Wick of Candle: Customize zone plotting using the body or wicks of candles for flexible analysis.
Previous Zones: You can choose to display or disable previous zones on the chart that have been deleted and utilized before. This option helps you maintain a clutter-free chart while retaining valuable historical information.
Moving Averages: Utilize four (4) customizable Moving Averages to enhance analysis from any time frame.
💎 Employing a Top-Down Approach and Multiple Time Frame Analysis: 💎
Let's delve into the concept of adopting a top-down approach combined with multiple time frame analysis in trading scenarios. It is consistently recommended to trade with the trend because, as the saying goes, "the trend is your friend." If you identify a demand zone on the chart but the overall trend is downward, it's crucial to confirm the stock's trend in higher timeframes. Avoid purchasing from the demand zone in such a scenario as you would be going against the trend. To consider buying from the demand zone, ensure that the overall trend is upward by checking the higher timeframe.
Similarly, if the higher timeframe trend is upward but the price is approaching a higher timeframe supply zone, refrain from buying in the lower timeframe. If the price reaches a higher timeframe supply zone, there is a likelihood that the price will face rejection from this zone.
If the price is significantly extended from the EMA 20 on a higher timeframe, for instance, if you plan to trade on a 30-minute timeframe and the price is considerably extended from the daily EMA 20, consider trading from zones that are closer to the daily EMA 20. When the price is extended from the higher timeframe EMA 20, it implies that the price is expensive, and there may be a tendency for it to return to the EMA 20. Therefore, it is advisable to trade from zones that are closer to the higher timeframe EMA 20 and avoid zones that are extended from the higher timeframe EMA 20.
For instance, imagine you're considering purchasing a stock that has reached a demand zone known as Rally Base Rally (RBR). If you identify a corresponding demand zone in a higher time frame located at the same position, and concurrently observe that the intermediate time frame indicates an upward trend, your potential for a successful trade is enhanced.
Conversely, if you spot a buying zone in a lower time frame, but notice a supply zone in the higher time frame at that exact position, the likelihood of a profitable trade decreases significantly. In such cases, it's prudent to steer clear of the lower time frame zone. This emphasizes the critical significance of employing a top-down approach or conducting a multiple time frame analysis.
Note: By Doing top down approach you can easily follow the footprints of smart money in the stock market or any other market by using this indicator and make well-informed trading decisions.
Remember, don't make decisions based only on one time frame. Check the overall trend of the stock and look at buying and selling points on bigger time scales. If you only use one time scale, your chances of making successful trades will be lower.
💎 To execute these comprehensive analyses and optimize your trading outcomes, you can make use of my indicator called "Demand & Supply Zone Scoring: Rally Base & Drop Concept."💎
This indicator is thoughtfully crafted to assess the strength of trade setups based on demand and supply zones through a scoring mechanism. It serves as your guide for correct top-down and multiple time frame analysis, eliminating the possibility of overlooking any strategic parameters. To gain deeper insights, you can learn more about how to use this indicator in its description.
Lastly, Thank you for your support, your likes & comments." Feel free to ask if you have questions.
Let's conquer the markets together! 🚀
Professional Zones - Institutional Demand and Supply Imbalances
Intro to Supply and Demand Zone Technical Analysis
Supply and demand is an increasingly common strategy among day and swing traders in equity, forex, and the futures markets. The goal of analyzing supply and demand zones is to pre-determine where price action may pivot before that pivot happens, thus giving us an edge over the market. There are many unique charting/trading strategies that fit under the supply and demand umbrella, however we are going to focus primarily on Institutional Zones of Demand and Supply Imbalances, as this is what our TradingView indicator actively displays.
What are Institutional Zones of Demand and Supply Imbalances?
First, let’s break down the phrase above. The first word is ‘institutional’, which is a key aspect in our trading. As a retail trader, you must understand that retail traders (individual traders like you and I) have very little control and very little effect on price action in the major markets. The price action that we see everyday is caused by large institutions and hedge funds buying and selling equities in massive quantities.
This chart displays the price action for ES, which is the S&P500 E-mini futures .
At the time this guide was created, that chart for ES displays the low of this year (2022). You can see major highs and major lows, as well as steep drops and momentous runs.
Price action like this appears random to the naked eye, however it is all controlled by major institutions. These institutions place large buy and sell orders for markets such as the S&P 500 Index which causes these moves.
Our Institutional Demand and Supply Analysis attempts to discover the price zones where institutions have placed their buy/sell orders. Their buy orders create “demand zones”. And their sell orders create “supply zones”. Knowing where these zones exist allows us to anticipate price trend reversals so we can profitably participate in them alongside the major institutions when these key moves take place.
We are looking for areas in the chart where institutions have created major imbalances (more buy orders than sell orders or vice versa) which creates demand and supply zones that impact price action and trend reversals in predictable ways.
What Causes These Supply and Demand Zones?
Understanding that institutions control the price of the markets is crucial for understanding how these zones of supply and demand imbalances are formed, and it can be derived from historical price action.
There are two types of price action, balanced and imbalanced. Balanced price action is flat, consolidatory price action where the overall direction is sideways. Imbalanced price action is an exaggerated move in price either up or down. Now here is the key: institutional supply and demand imbalances are formed when price action goes from balanced to imbalanced. Below is an example of balanced price action .
There are clearly areas of institutional buy and sell orders that are causing price action to oscillate between the areas of demand and supply. The longer price action consolidates and moves sideways, the larger the volume profile will be in this range. In other words, more institutional orders will build up as price remains relatively the same for a longer period of time.
Here is how a demand zone is formed :
Due to bullish CPI news, price action went from balanced to imbalanced by exploding to the upside. This bullish price action filled all of the sell orders and broke past the previous area of supply. Because price moved up so fast, the buy orders did not get a chance to fill, essentially leaving an area with a high concentration of buy orders remaining. Hence, a new demand zone is formed which is shown here .
Our state-of-the-art indicator automatically scans for these historical shifts in price action (balanced to imbalanced) via our supply and demand zone detection formula, and displays them on your chart instantly. Remember the first image sent of blank price action? Here it is below:
The image below shows the exact same chart of ES, however, our advanced Professional Zones - Institutional Demand and Supply Imbalances indicator has been applied to the chart.
Just like that, price action has been transformed from unexplainable chaos to an orderly sequence of demand bounces and supply rejections.
Yes, all of these zones may be charted manually if one were to acquire the knowledge required to chart them by hand, and spend numerous hours going back in time to find all these zones. Additionally, these charts would then have to be constantly monitored and updated, which would require hours of work each day. This powerful indicator automates all of that work to give you more precious time to analyze and trade these zone-driven pivots in the markets.
How To Measure the Strength of Supply and Demand Zones?
The longer the consolidation takes place, the larger the demand/ supply zone will be. This strength is measured by the time frame of the origin of the zone.
Each zone may be formed on a different time frame, the biggest being the 1 Month time frame, and the smallest being the 30 Minute. Each supply and demand zone is automatically labeled based on the time frame from which the zone originated.
The weakest zones are derived from the 30 minute time frame. This means the zone only took two 30 minute candles to form, which is not a lot of time for institutions to place large orders. This means that the bounces and rejections off of these zones will usually be smaller, and usually won’t last more than a few days.
Larger zones such as 1 Day, 1 Week, and 1 Month often cause large swings in the market lasting weeks, months and even years. So pay attention not just to where the demand and supply zones currently appear, but also to the strength of that zone. You can see below that the demand zone that the market bottomed in and reversed out of in 2022 was in fact, a very strong weekly zone.
What is the Significance of Supply and Demand Zone Breaks?
These zones are order-based. This means that a supply zone level doesn’t turn into demand when price action breaks above it, and demand doesn’t turn into supply when price action breaks below it. It is unlike standard trend-based support and resistance levels. If price action breaks below demand by even $0. 01 , all of the buy orders have been filled and the demand must be deleted from the chart (and vice versa for a supply zone ).
While it is possible to play these zone breaks as continuation plays off of current momentous price action, it is unpredictable how far price will go up or down after breaking supply or demand during that leg.
However, in my years of supply and demand experience, I have noticed that if demand breaks, the market will eventually come down to the next viable demand zone . This is because without a pivot caused by an institutional-created demand or supply imbalance, there is often not enough participation to cause a sustainable trend reversal for a long period of time. Below is an example of this:
Above is the 4 Hour chart of TSLA bouncing up off of a demand zone . We call this a bounce in “no man's land”, as there is no major demand bounce to support this reversal to the upside. So in theory, price action should return lower to the next major historical zone of demand before it has a chance of pulling off a solid reversal. Here is what happened:
As you can see above, TSLA did indeed end up heading back down into the next major demand zone before getting a sustainable reversal to the upside. So you may play these supply and demand zone breaks as continuation trades, either long or short, with a price target at the next major zone. Just make sure to use proper risk management and position sizing, as timing the trigger of a price target can be difficult.
How Might I Place a Trade Using the Indicator?
Now that the basics of institutional supply and demand zones have been discussed, there will come a time that this strategy must be actively applied to personal trading with a goal of becoming profitable. Here is a step-by-step process to place a trade using supply and demand paired with an example of a day trade from the 1 minute time frame.
Step 1: Find a highly institutionally traded stock that is currently in supply or demand as shown by our indicator. For example, AAPL:
Step 2: Look for an above-average (exaggerated) volume spike. Because we are in one of the green zones at the bottom of the chart, we know that we are in demand where large institutional buy orders reside. We need to wait for some of these orders to actually fill before we take our trade. This is known as volume confirmation. The color of the volume usually does not matter in this situation.
Step 3: Now that we have a volume spike which is confirmation of large orders being filled, we need more confirmation that the institutional orders are not only a buy, but large enough to actually reverse the current trend.
This is ultimately a judgment call. A few green candles may be good enough to dictate a reversal, or a trend break. It comes down to personal preference and how aggressive you would like to be. Keep in mind, the longer you wait, the more confirmation your trade has, but also, the longer you wait, the greater the risk of missing the new trend. In this example, we will use a trend line to confirm our trend reversal.
Step 4: Enter the trade. Now that you have proper demand confirmation, you may place your trade. Be sure to determine your stop loss, price target, position size, and all other risk management factors along the way.
In this example, AAPL ran all the way up to supply before rejecting; making for a perfect demand to supply call trade. Also, more short trade entries could have been taken based off of the multiple supply rejections AAPL had.
The Bottom Line
There are many ways one may go about trading the stock market. However in my years of trading and teaching, there has never been a strategy that has not only changed my career, but improved the trading careers of my students, more dramatically than Institutional Zones of Demand and Supply Imbalances.
Though charting new zones and deleting broken ones everyday was time consuming and repetitive, the results of trading these zones made it well-worth the hours of charting. However, after months of development and fine-tuning, the painful charting process has been automated by this powerful indicator, completely replacing the tedious charting work for myself and my students.
While numerous other indicators include the name “Supply and Demand Zones”, we believe that no supply and demand indicator remotely this advanced and accurate available on TradingView. I am very blessed to finally bring this revolutionary tool to the market.
Introduction to the Aurora Demand and Supply Indicator for TradingView and its Functionality
This page is dedicated to providing a thorough walk-through of our Professional Zones - Institutional Demand and Supply Imbalances indicator. The settings functionality, customizability, and purpose will be discussed to give you an in-depth understanding of the indicator. Understanding the purpose of the different functions and settings is crucial to utilizing this powerful tool at its full potential.
First Look Upon Indicator Addition
After purchasing the indicator, your chart may initially appear cluttered, zoomed out, and hard to read. But do not worry, it just means the indicator settings must be fine-tuned to optimize your experience. Tt may appear overwhelming. However this page will discuss each major customizable setting and the functionality behind it to streamline your TradingView set up.
Filter Options Settings Category
This is the first customizable feature that appears when accessing the settings of the indicator. What Filter Zone Ranges does is allow you to filter the range at which zones appear both above and below the current asset price. With this setting unchecked, every single demand and supply zone within the 5k candle limit (or 20k limit if you have a premium TradingView account) will appear on your chart. This causes chart clutter which limits the visibility of price action.
If you have this setting activated, you can choose exactly the range of zones visible to you. This range is percent based and is measured both above and below the current market price. For example, if you activate Filter Zone Ranges and set the Filter Percentage at 7%, only zones within the range of 7% above, and 7% below the current asset price will be shown.
Demand/ Supply Zone Options Settings Category
The next two categories contain the majority of the customizability for supply and demand zones. The first option in both the Demand/ Supply Zone Options is Create Demand/Supply Zones. This toggle is very straight forward, you may choose whether or not to display all demand zones, or all supply zones.
The next two options are Demand/ Supply Zone Border and Demand/ Supply Zone Fill. Again, these are straight forward. The border setting allows you to edit both the color and opacity of the zones’ border lines. The fill setting allows you to edit the color and opacity of the interior of the supply/demand boxes.
Following the first pair of visual settings, you will see Demand/ Supply Zone Box Offset. This allows you to toggle how much the indicator offsets each zone from its origin point. In other words, move it to the left or right from the point in time at which the zone was created. The 0 offset is the base setting which is actually a slight offset to the right of the origin point to ensure that the candlesticks remain unobstructed visually.
After the offset options, you will find Demand/ Supply Zone ERC Multiple. This is a key setting which inputs the value our formula utilizes to scan the areas of institutional supply and demand imbalances. Unless you are extremely experienced with supply and demand analysis or you are running backtesting, it is highly recommended this value is left at ‘2’ for both the demand and supply options.
The next two options you will see in your indicator settings are Extend Demand/ Supply Zone and Demand/ Supply Zone Size. This feature allows you to customize exactly how far your zones will extend from the point of origin into the future.
The three options on the drop down menu are Extend, Fixed, and Dynamic. Each of these options extend your zones in a different fashion. It is important to note that the value inputted in the size option is the amount of units the zones will extend to the right for both Fixed and Dynamic options. The larger this input is, the further out the zones will extend into the future, and vice versa.
The final setting in the Demand/ Supply Zone Options category is Broken Zones to Keep and Broken Demand/ Supply Zone Fill. The Broken Zones to Keep input allows you to see recent supply or demand zones that have been broken and deleted from your chart. This may be useful for a trader in a few different ways. The Broken Demand/ Supply Zone Fill setting allows you to customize the number of broken zones displayed as well as their color and opacity. The most prominent example of this option’s utility is for traders that do not observe price action during the entirety of the market open.
If an individual left their charts for a few hours and missed a demand break, it may give the illusion that there was never a demand there and price action has been in “no-man's land” all day. However if that individual inputted ‘1’ in the Broken Zones to Keep setting, they would be able to see that a demand has broken. This may be useful as the trader may have an altered sentiment after knowing that a zone did in fact break.
Note: the value inputted is the amount of previously broken zones that will appear on your chart. For example, if the value ‘3’ is inputted, the three most recently broken zones will appear on your chart.
Time Frame Options Settings Category
Time Frame Options Settings allows you to toggle which supply and demand zones appear on your chart by time frame. For example, if you are analyzing a chart on a larger time frame such as the daily or weekly, the small 30 minute and 45 minute zones will often clutter your chart. By deselecting the weaker and smaller time frame zones, it will clean your chart up, allowing you to only see the zones that assist your analysis.
However the first two options in the category are unique.The first is Show Forming Zones. This option is extremely useful if you are watching price action play out live, when seeing the possibility of a supply or demand zone forming may be of benefit during your day trading. By toggling this setting ON, you will see all possible supply and demand zones forming in real time. However, this could cause clutter if multiple zones are forming at once in which case, toggling it off may be more beneficial.
The second option in the Timeframe Options category is the Show Zones Inside toggle, which controls the table at the top right of your screen (you may get rid of this table by deselecting tables in display settings).
This setting simply is a “yes” or “no” as to whether or not the table located at the top right of your screen will display the number of zones price action is currently sitting in. This setting is useful as zones may sometimes pile up on top of one another, making it hard to know exactly how many zones price action is currently sitting in.
Gap Options Settings Category
Just below the Timeframe Options category, is the Gap Options category. Gaps appear when two daily candles highs and lows do not overlap. These are often created when a catalyst is released into the market overnight causing a large move, resulting in a “gap” up or down the next morning.
A Gap often forms due to a strong move to the upside, and the indicator highlights this gap with a gray box. Gaps are important to many traders as there is often a large lack of liquidity inside the gap area, which often acts as a magnet that attracts future price action to fill it. If toggled on, the indicator displays the gap among the supply and demand zones seamlessly. The rest of the settings for this category are options to customize the color, opacity, size, and offset. These have the same effect as the options in the Demand/ Supply Zone Options category.
Text Options Settings Category
The final category in the indicator input settings is Text Options. This category allows you to toggle zone labeling on or off, and to specify how you would like the zone labels to appear. It’s strongly recommended that zone labeling is left ON because knowing the time frame a supply or demand zone originated from is a massive indicator of its strength. Top right alignment causes labeling such as “3H” to appear at the top right of each zone.
Indicator Data Limitations
There are a few limitations of TradingView which impact the Professional Zones - Institutional Supply and Demand Imbalances indicator. The first is the data TradingView provides to its users. With a basic TradingView account, a user only has access to 5,000 candles of data. So if a user is on the 1 minute time frame, that user can only see 5,000 candles before that current point. This is important because our advanced indicator scans historical price action that has formed supply and demand zones and displays it on your chart. This means that if a user is on a 1 minute time frame chart, they will only be able to see zones formed within the last 5,000 candles. Older supply and demand zones can not be displayed. However if a user has the Premium TradingView subscription, they can access up to 20,000 candles, which greatly increases the potential zones the user may see on the smaller time frames.
To counter this, we strongly recommend checking the larger time frames before starting your trading day, as there could be an old zone lurking behind the scenes. Once you spot it on the 30 minute time frame, for example, you may easily take note of the demand zone and its location.
The Bottom Line
This indicator has been intricately and powerfully designed to not only display institutional supply and demand imbalances more accurately and efficiently than any other TradingView indicator, but it has also been designed to give the user full control. Full control means the user has the ability to customize the appearance and inputs, as well as toggle specific objects visible to the trader.
We have meticulously designed the Professional Zones - Institutional Supply and Demand Imbalances indicator to be extremely valuable as a stand-alone strategy, as well as versatile enough to incorporate multiple other trading strategies on top of supply and demand .
However, in order for this indicator to be utilized by you at its full potential, it is important that you understand all of its features, capabilities and configuration options before you dive into trading.
RSI based support resistance levelsThis indicator draws support line and resistance lines in the price chart.
How ?
For drawing the support/resistance line we need to first determine the demand and supply.
We are using too-familiar indicator RSI to determine when the script is oversold and overbought.
Now oversold (in RSI) is not a point, it’s a zone. The RSI indicator comes below 30, stays there and goes up above 30. Similarly for overbought.
Now if you carefully look at the oversold region – the lowest point of the oversold region is the place where the demand came (for surety) and push the indicator (and price) up.
Similarly: the highest point of overbought is the place where (for surety) the supply came and push the indicator (and price) down.
So that’ the supply / demand line (for surety).
In this indicator, based on the RSI we are just drawing support and resistance lines in the chat. That’s all.
What is unique ?
Trendline concept is not new. RSI is not new. RSI overbought/oversold is not new.
There are indicators exist to draw trendlines. Some of them works beautifully.
However, none of these, we are aware of, uses RSI to determine it. And, we believe, the most logical way to determine support/resistance is RSI.
Note: We are not responsible for any trading/investment decision you are taking out of the outcome of this indicator.

Next Gen Auto S/RThis indicator will automatically plot support and resistance levels and will also allow you to overlay multi time frame support and resistance on any time frame that you are currently conducting analysis on. In addition you can also set alerts when a support and resistance level is tested, fine tune how many levels you would like to view on your charts, option to input how many candlesticks minimum you would like between support and resistance levels. You can also select breakout mode which will turn old support into resistance by a colour change and turn old resistance into support. NEW you can now use extended levels and change your zones into lines.
