Smart Money Flow - Exchange & TVL Composite# Smart Money Flow - Exchange & TVL Composite Indicator
## Overview
The **Smart Money Flow (SMF)** indicator combines two powerful on-chain metrics - **Exchange Flows** and **Total Value Locked (TVL)** - to create a composite index that tracks institutional and "smart money" movement in the cryptocurrency market. This indicator helps traders identify accumulation and distribution phases by analyzing where capital is flowing.
## What It Does
This indicator normalizes and combines:
- **Exchange Net Flow** (from IntoTheBlock): Tracks Bitcoin/Ethereum movement to and from exchanges
- **Total Value Locked** (from DefiLlama): Measures capital locked in DeFi protocols
The composite index is displayed on a 0-100 scale with clear zones for overbought/oversold conditions.
## Core Concept
### Exchange Flows
- **Negative Flow (Outflows)** = Bullish Signal
- Coins moving OFF exchanges → Long-term holding/accumulation
- Indicates reduced selling pressure
- **Positive Flow (Inflows)** = Bearish Signal
- Coins moving TO exchanges → Preparation for selling
- Indicates potential distribution phase
### Total Value Locked (TVL)
- **Rising TVL** = Bullish Signal
- Capital flowing into DeFi protocols
- Increased ecosystem confidence
- **Falling TVL** = Bearish Signal
- Capital exiting DeFi protocols
- Decreased ecosystem confidence
### Combined Signals
**🟢 Strong Bullish (70-100):**
- Exchange outflows + Rising TVL
- Smart money accumulating and deploying capital
**🔴 Strong Bearish (0-30):**
- Exchange inflows + Falling TVL
- Smart money preparing to sell and exiting positions
**⚪ Neutral (40-60):**
- Mixed or balanced flows
## Key Features
### ✅ Auto-Detection
- Automatically detects chart symbol (BTC/ETH)
- Uses appropriate exchange flow data for each asset
### ✅ Weighted Composite
- Customizable weights for Exchange Flow and TVL components
- Default: 50/50 balance
### ✅ Normalized Scale
- 0-100 index scale
- Configurable lookback period for normalization (default: 90 days)
### ✅ Signal Zones
- **Overbought**: 70+ (Strong bullish pressure)
- **Oversold**: 30- (Strong bearish pressure)
- **Extreme**: 85+ / 15- (Very strong signals)
### ✅ Clean Interface
- Minimal visual clutter by default
- Only main index line and MA visible
- Optional elements can be enabled:
- Background color zones
- Divergence signals
- Trend change markers
- Info table with detailed metrics
### ✅ Divergence Detection
- Identifies when price diverges from smart money flows
- Potential reversal warning signals
### ✅ Alerts
- Extreme overbought/oversold conditions
- Trend changes (crossing 50 line)
- Bullish/bearish divergences
## How to Use
### 1. Trend Confirmation
- Index above 50 = Bullish trend
- Index below 50 = Bearish trend
- Use with price action for confirmation
### 2. Reversal Signals
- **Extreme readings** (>85 or <15) suggest potential reversal
- Look for divergences between price and indicator
### 3. Accumulation/Distribution
- **70+**: Accumulation phase - smart money buying/holding
- **30-**: Distribution phase - smart money selling
### 4. DeFi Health
- Monitor TVL component for DeFi ecosystem strength
- Combine with exchange flows for complete picture
## Settings
### Data Sources
- **Exchange Flow**: IntoTheBlock real-time data
- **TVL**: DefiLlama aggregated DeFi TVL
- **Manual Mode**: For testing or custom data
### Indicator Settings
- **Smoothing Period (MA)**: Default 14 periods
- **Normalization Lookback**: Default 90 days
- **Exchange Flow Weight**: Adjustable 0-100%
- **Overbought/Oversold Levels**: Customizable thresholds
### Visual Options
- Show/Hide Moving Average
- Show/Hide Zone Lines
- Show/Hide Background Colors
- Show/Hide Divergence Signals
- Show/Hide Trend Markers
- Show/Hide Info Table
## Data Requirements
⚠️ **Important Notes:**
- Uses **daily data** from IntoTheBlock and DefiLlama
- Works on any chart timeframe (data updates daily)
- Auto-switches between BTC and ETH based on chart
- All other crypto charts default to BTC exchange flow data
## Best Practices
1. **Use on Daily+ Timeframes**
- On-chain data is daily, most effective on D/W/M charts
2. **Combine with Price Action**
- Use as confirmation, not standalone signals
3. **Watch for Divergences**
- Price making new highs while indicator falling = warning
4. **Monitor Extreme Zones**
- Sustained readings >85 or <15 indicate strong conviction
5. **Context Matters**
- Consider broader market conditions and fundamentals
## Calculation
1. **Exchange Net Flow** = Inflows - Outflows (inverted for index)
2. **TVL Rate of Change** = % change over smoothing period
3. **Normalize** both metrics to 0-100 scale
4. **Composite Index** = (ExchangeFlow × Weight) + (TVL × Weight)
5. **Smooth** with moving average
## Disclaimer
This indicator uses on-chain data for analysis. While valuable, it should not be used as the sole basis for trading decisions. Always combine with other technical analysis tools, fundamental analysis, and proper risk management.
On-chain data reflects blockchain activity but may lag price action. Use this indicator as part of a comprehensive trading strategy.
---
## Credits
**Data Sources:**
- IntoTheBlock: Exchange flow metrics
- DefiLlama: Total Value Locked data
**Indicator by:** @iCD_creator
**Version:** 1.0
**Pine Script™ Version:** 6
---
## Updates & Support
For questions, suggestions, or bug reports, please comment below or message the author.
**Like this indicator? Leave a 👍 and share your feedback!**
DEFI

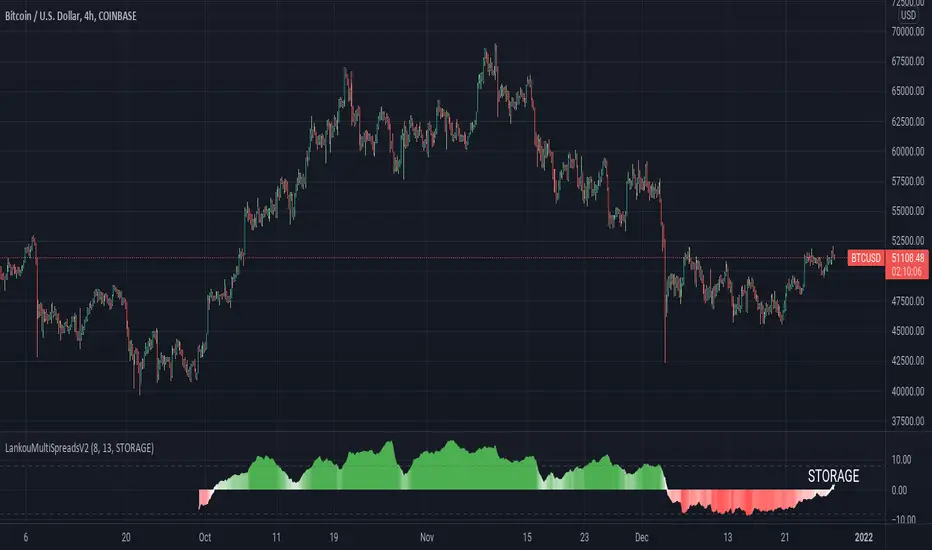
LankouMultiSpreadsV2 AllThis script is calculating the spread between a token and it's relative counterpart on the PERPETUAL FUTURES contract
It's focus on exchange / defi / Tokens / metaverse / storage
for exchange tokens
It uses future from FTX because Binance does not have PERP contractc for other exchanges
If it's red, the price on PERP is lower than SPOT
If it's green, the price on PERP is HIGHER than SPOT meaning people are bullish on this asset
Price DEFI Categories against BTC & ETH/* Work in progress. The indicator is not finished. *\
The indicator shows the pricing of 3 DEFI categories against 2 possible baselines, BTC and ETH.
To do:
* Make a simple array in the source code to enter and remove new projects to the category. -> Maybe can also make it so that the source code does not have to be altered (projects can be added through input etc.)
* Adjust weightings depending on project data but this is not as important since weightings are being priced in by the market.
* Try to find a way to update input to string instead of booleans. As of currently, I could not seem to use input strings into plot functions because of an error.
* and more. Leave some feedback, that would be highly appreciated!

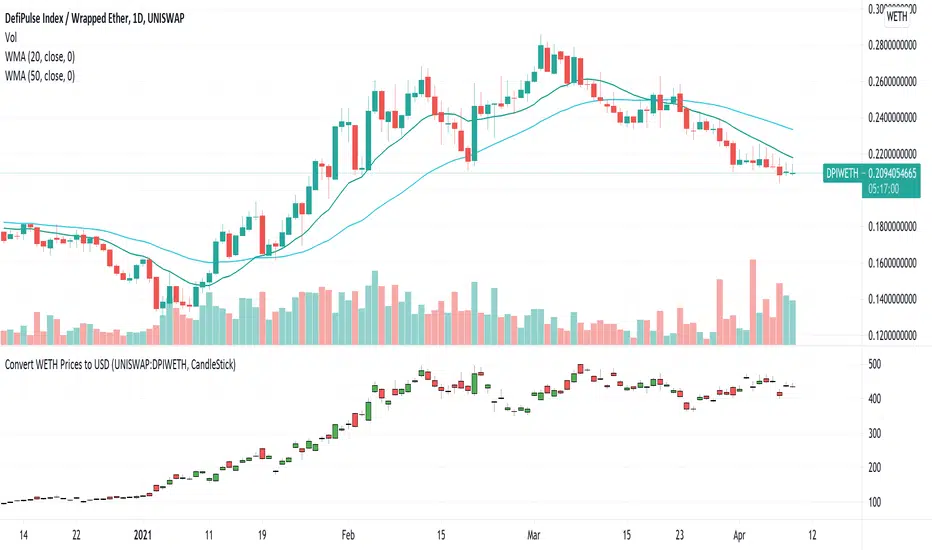
USD Prices for Uniswap Token/WETHUniswap instrument prices are in WETH. This indicator translates the series to USD prices and plots the series as candles or as a line. Data is translated by using corresponding series data for ETHUSD. The reference ETHUSD price is from Coinbase.
Any token listed as a ETH/WETH pair could be specified as an input parameter. The default instrument value is set to UNISWAP: DPIWETH, an index created by indexcoop and tracking the DEFI basket.
The script is simple and easy to understand. It allows for quick conversion and comparisons and something we had to do in a custom way prior to this script. The crypto and DEFI community would benefit from it immensely. There is even a feature request for something like this on the tradingview subreddit.
Sushi Stock To Flow RainbowHello everyone,
as always, I hope you are doing well.
To sum up:
The stock-to-flow is the number we get when we divide the total stock by the annual production (flow).
It indicates how many years are required, at the current production rate, to produce what is in the current stock.
The stock is simply the total in circulation, in our case, the number of Sushi in circulation.
On the other hand, the flow is the total number of Sushi created each year.
In our case:
- The number of new sushi issued is reduced every month
- The total number of sushi in circulation is set at 250 million
- The last reduction will take place in October 2023
The empirical formula of the stock to flow is, in our case: total number of sushi in circulation / number of sushi produced each month.

PIPT | Power Index Pool Token | DeFi indexPowerPool provides a DeFi index that has too many components to be used as a chart ticker.
So here is an indicator to bypass the ticker limit.
From the PowerPool docs : app.powerpool.finance
The chart shows it in comparison to other DeFi indexes, quite a difference as you can see!
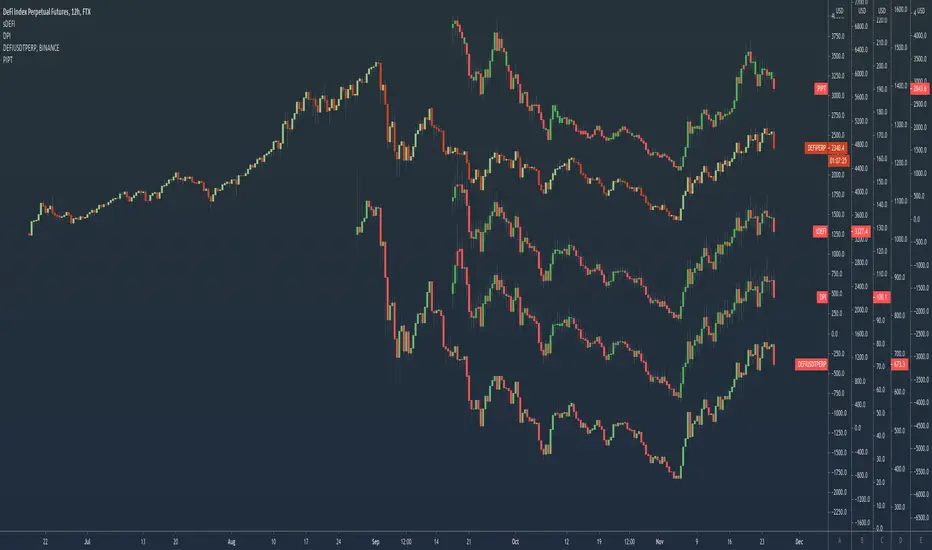
DPI | DeFi Pulse IndexTokenSets and DeFi Pulse provide a DeFi index that has too many components to be used as a chart ticker.
So here is an indicator to bypass the ticker limit.
From the TokenSets docs : www.tokensets.com
The chart shows it in comparison to other DeFi indexes, quite a difference as you can see!

sDEFI IndexThe Synthetix Exchange provides a DeFi index that has too many components to be used as a chart ticker.
So here is an indicator to bypass the ticker limit.
From the Synthetics docs : docs.synthetix.io
DeFi Index (sDEFI)
Contract: 0xe1aFe1Fd76Fd88f78cBf599ea1846231B8bA3B6B
Token | Initial Weight
---------------------------
Aave | 15%
Synthetix Network Token | 15%
yearn.finance | 15%
Uniswap | 10%
Compound | 7.50%
Maker | 7.50%
Balancer | 5%
Curve DAO Token | 5%
Kyber Network | 5%
Ren | 5%
UMA | 5%
Wrapped Nexus Mutual | 5%
The chart shows it in comparison to FTX's DeFi index, quite a difference as you can see!
