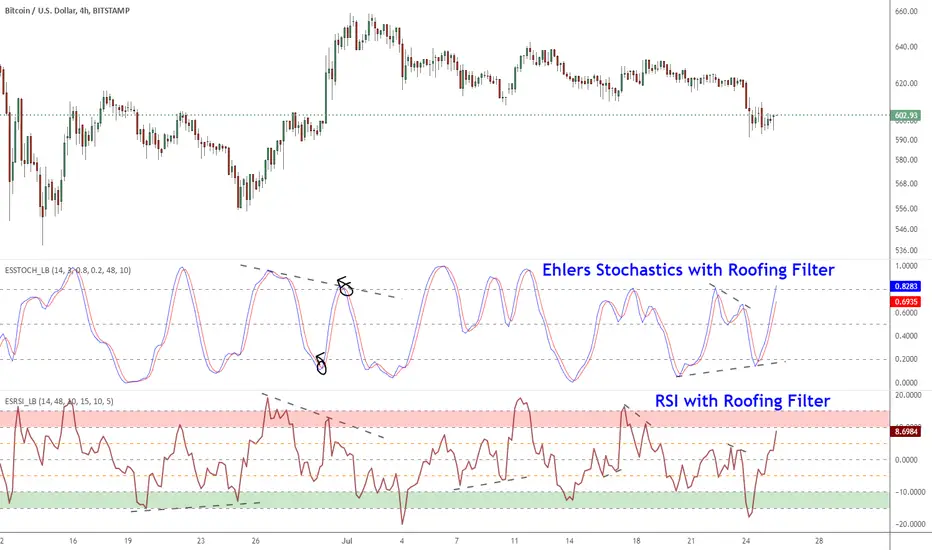
CM Time Based Lines Requested by codetrader to Visually Show Day Change on Intra-Day Charts. Custom Indicator: Ability To Plot Recurring Time Lines On Chart! Example of Uses: Plot Lines at Midnight to Show Daily Change. Plot Lines at Opening of Different Sessions. Plot Lines at Opening and Closing of Sessions. Plot Lines Every 4 Hours (Forex) To See 4-Hour...
As we know, %b is a measure of where prices are in relation to the outer Bollinger bands and therefore strongly related to volatility. This can get choppy, though. Vervoort smoothed this using Zero lag TEMA of custom Heiken-ashi recalculated prices. According to Vervoort, "Smoothed Vervoort %b is often a leading indicator making smooth moves with clear turning...
The CCT Bollinger Band Oscillator (CCTBO), developed by Steve Karnish of Cedar Creek Trading, reconfigures John Bollinger's classic Bollinger Bands (envelopes plotted at two Standard Deviations above and below a moving average) by drawing two parallel lines replacing the envelopes. The parallel lines represent a measurement of two Standard Deviations from the mean...
Elastic Volume Weighted Moving Average (eVWMA) is a statistical measure using the volume to define the period of the moving average. The eVWMA can be looked at as an approximation to the average price paid per share. Multiplier is usually the number of shares, but it can be approximated using cumulative sum of volume (Enable it via "Use Cumulative Volume" option)...
These levels are based on price around earnings day. I have implemented support for 2 calculation modes: Mode 1: Level = (low of 1 day prior to earnings + high of 1 day after earnings) / 2.0 Mode 2: Level = (hl2 of 1 day prior to earnings + hl2 of 1 day after earnings + close from earnings day) / 3.0 Chart above shows "Mode 1". Mode can be changed via options...
This a modified MAC-Z using Z-VWAP. Since this uses VWAP, the signals are derived indirectly from both volume and price action. I have also included a way to smooth MACZ-VWAP, you can enable it via options page. Note that this will not work on any FX pair, as volume is not available. Referenced indicators: Z-distance from VWAP: MAC-Z Indicator: Z-Score:...
The Enhanced Index (EIDX) is a modified William %R that behaves much like the original, to indicate overbought and oversold market conditions. EIDX has the advantage of - Reacting more quickly to changes in buying power. - Predicting market turning points better than other oscillators. Divergences are more pronounced. List of my other indicators:
Full Credit goes to LazyBear for publishing Original Code. I added: Threshold lines that changes the color of Histogram based on if it exceeds Threshold lines. Ability to turn off and on. Ability to Turn Histogram Off/On Ability to turn Twiggs Money Flow Line Off/On
Edgar Kraut proposed this simple colored volume bars strategy for swing trading. This is how the colors are determined: - If today’s closing price and volume are greater than 'n' days ago, color today’s volume bar green. - If today’s closing price is greater than 'n' days ago but volume is not, color today’s volume bar blue. - Similarly, if today’s closing...
This calculates normal distance of price from VWAP. This is a mean reverting idea (something like ZScore), but using both "volume" and "close". Useful for finding OB/OS areas and potential turning points. Complete list of my indicators:
The Intraday Momentum Index (IMI), developed by Tushar Chande, is a cross-breed between RSI and candlestick analysis. IMI determines the candle type that dominated the recent price action, using that to pinpoint the extremes in intraday momentum. As the market tries to bottom after a sell off, there are gradually more candles with green bodies, even though...
This module is meant to act as a framework and platform over which to develop other indicators. On its own it does essentially nothing, yet simplifies the work of adding basic customizations and flexibility to ideas immediately. The chart on this post is not a demo, so its better to just try adding the indicator to a test chart — you may find it more convenient to...
Roofing filters, first discussed by Mr.John Ehlers, act as a passband, filtering out unwanted noise from market data and accentuating turning points. I have included 2 indicators with filters enabled. Both support double smoothing via options page. All the parameters are configurable. Info on Roofing Filter and Ehlers Super...
Heard this story from Larry Williams…the trader who holds the record for winning the U.S. Trading Championship by turning $10K in to 2 Million. A trader named Owen Taylor developed this formula as a Floor Trader before to calculate the Projected High and Low of the next day. The formula worked so well…Owen charged other Traders 1K to get it. I was pretty...
This indicator takes market volume and organizes it into wave charts, clearly highlighting inflection points and regions of supply/demand. Try tuning this for your instrument (Forex not supported) by adjusting the "Trend Detection Length". This "clubs together" minor waves. If you like an oscillator-kind-of display, enable "ShowDistributionBelowZero" option....
This is Mr. Sylvian Vervoort's take on improving some well-known indicators (%B and Stoch) using smoothing techniques. A combination of TEMA and WMA does a nice job smoothing out %B, derived from zero-lag “Rainbow” data series. The same Rainbow series, averaged with the typical price, smooth the Stochastic K oscillator to produce slowStoch. Vervroot's strategy...
RSI bands provide an intuitive way of visualizing how the price movement causes RSI to move with in its range (0-100). Upper/Lower bands signify overbought and oversold levels respectively (Default: 70/30, you can customize them via options page). These bands closely match what Constance Brown explains in her book "Technical Analysis for the Trading Professional"....
*** *** Bollinger Bands (BB) usually expand quickly after a volatility increase but contract more slowly as volatility declines. This extended time it takes for BB to contract after a volatility drop can make trading some instruments using BB alone difficult or less profitable. In the October 1998 issue of "Futures" there is an article written by Dennis...