DCT - Liquidity Heatmap - ProDCT - Liquidity Heatmap - Pro
Overview
This indicator maps liquidity concentration zones by analyzing volume distribution across price levels. It identifies areas where significant trading activity has accumulated, potentially indicating zones of interest for future price interaction.
Methodology
Volume Intensity Calculation
Each price level accumulates a normalized volume score calculated as:
- Volume Intensity = Current Bar Volume / SMA(Volume, lookback period)
- This normalization allows comparison across different volatility regimes and trading sessions
Level Construction
- Price levels are distributed symmetrically above and below current price using percentage-based spacing
- Each level maintains cumulative volume data, tracking both raw volume and normalized intensity
- Levels are visualized as zones with height proportional to the spacing parameter
Sweep Detection Logic
A level is marked as "swept" when price action crosses through it:
- Condition: Low ≤ Level Price AND High ≥ Level Price
- Swept levels stop accumulating new volume and can be styled differently (fade, hide, or preserve)
Color Intensity Grading
Zones are color-coded based on their normalized volume relative to the maximum observed:
- Purple: < 25% of max intensity
- Yellow: 25-50% of max intensity
- Orange: 50-75% of max intensity
- Red: > 75% of max intensity
Optional CVD (Cumulative Volume Delta) Mode
When enabled, directional volume is estimated using candle structure:
- Bullish candles: Buy pressure weighted by (Close - Open) / (High - Low)
- Bearish candles: Sell pressure weighted by (Open - Close) / (High - Low)
- Levels display green/red bias based on accumulated directional volume ratio
Adaptive System
The indicator includes a three-layer adaptive system:
1. Timeframe adaptation: Spacing, level count, and retention automatically adjust for M5 through Daily charts
2. Volatility adaptation: ATR-based adjustments widen spacing during high volatility and tighten during consolidation
3. Market type adaptation: Different imbalance thresholds for BTC/ETH, large altcoins, and small caps
Imbalance Detection
Buy/sell imbalance markers appear when the ratio of accumulated buy volume to sell volume exceeds a configurable threshold (default 1.5x for BTC/ETH, 2.0x for small caps).
What Makes This Implementation Unique
- Dollar-denominated liquidity display: Labels show estimated liquidity in USD (K/M/B format) rather than abstract values
- Three-layer adaptive logic: Combines timeframe, volatility (ATR), and asset-class adjustments simultaneously
- Memory-optimized architecture: Automatic cleanup of old swept levels prevents performance degradation on extended charts
- Forward projection: Active levels extend into future bars for cleaner visualization
- Granular visibility controls: Each intensity tier can be toggled independently
Settings Guide
- Dynamic: Enable adaptive adjustments (recommended)
- Spacing: Distance between levels as % of price
- Levels: Number of levels above/below price
- CVD: Enable directional volume analysis
- Forward: Project levels ahead by specified bars
Usage Notes
- Works on both Perpetual and Spot crypto markets
- Optimized for crypto assets; results may vary on other instruments
- Higher timeframes show broader liquidity structure; lower timeframes show granular detail
- Combine with your own analysis framework
Disclaimer
This indicator visualizes historical volume distribution and does not predict future price movement. Not financial advice. Use appropriate risk management.
Cryptos

FVG Maxing - Fair Value Gaps, Equilibrium, and Candle Patterns
What this script does
This open-source indicator highlights 3-candle fair value gaps (FVGs) on the active chart timeframe, draws their midpoint ("equilibrium") line, tracks when each gap is mitigated, and optionally marks simple candle patterns (engulfing and doji) for confluence. It is intended as an educational tool to study how price interacts with imbalances.
3-candle bullish and bearish FVG zones drawn as forward-extending boxes.
Equilibrium line at 50% of each gap.
Different styling for mitigated vs unmitigated gaps.
Compact statistics panel showing how many gaps are currently active and filled.
Optional overlays for bullish/bearish engulfing patterns and doji candles.
1. FVG logic (3-candle gaps)
The script focuses on a strict 3-candle definition of a fair value gap:
Three consecutive candles with the same body direction.
The wick of candle 3 is separated from the wick of candle 1 (no overlap).
A bullish gap is created when price moves up fast enough to leave a gap between candle 1 and 3. A bearish gap is the mirror case to the downside.
In Pine, the core detection looks like this:
// Three candles with the same body direction
bull_seq = close > open and close > open and close > open
bear_seq = close < open and close < open and close < open
// Wick gap between candle 1 and candle 3
bull_gap = bull_seq and low > high
bear_gap = bear_seq and high < low
// Final FVG flags
is_bull_fvg = bull_gap
is_bear_fvg = bear_gap
For each detected FVG:
Bullish FVG range: from high up to low (gap below current price).
Bearish FVG range: from low down to high (gap above current price).
Each zone is stored in a custom FVGData structure so it can be updated when price later trades back inside it.
2. Equilibrium line (0.5 of the gap)
Every FVG box gets an optional equilibrium line plotted at the midpoint between its top and bottom:
eq_level = (top + bottom) / 2.0
right_index = extend_boxes ? bar_index + extend_length_bars : bar_index
bx = box.new(bar_index - 2, top, right_index, bottom)
eq_ln = line.new(bar_index - 2, eq_level, right_index, eq_level)
line.set_style(eq_ln, line.style_dashed)
line.set_color(eq_ln, eq_color)
You can use this line as a neutral “fair value” reference inside the zone, or as a simple way to think in terms of premium/discount within each gap.
3. Mitigation rules and styling
Each FVG stays active until price trades back into the gap:
Bullish FVG is considered mitigated when the low touches or moves below the top of the gap.
Bearish FVG is considered mitigated when the high touches or moves above the bottom of the gap.
When that happens, the script:
Marks the internal FVGData entry as mitigated.
Softens the box fill and border colors.
Optionally updates the label text from "BULL EQ / BEAR EQ" to "BULL FILLED / BEAR FILLED".
Can hide mitigated zones almost completely if you only want to see unfilled imbalances.
This allows you to distinguish between current areas of interest and zones that have already been traded through.
4. Candle pattern overlays (engulfing and doji)
For additional confluence, the script can mark simple candle patterns on top of the FVG view:
Bullish engulfing — current candle body fully wraps the previous bearish body and is larger in size.
Bearish engulfing — current candle body fully wraps the previous bullish body and is larger in size.
Doji — candles where the real body is small relative to the full range (high–low).
The detection is based on basic body and range geometry:
curr_body = math.abs(close - open)
prev_body = math.abs(close - open )
curr_range = high - low
body_ratio = curr_range > 0 ? curr_body / curr_range : 1.0
bull_engulfing = close > open and close < open and open <= close and close >= open and curr_body > prev_body
bear_engulfing = close < open and close > open and open >= close and close <= open and curr_body > prev_body
is_doji = curr_range > 0 and body_ratio <= doji_body_ratio
On the chart, they appear as:
Small triangle markers below bullish engulfing candles.
Small triangle markers above bearish engulfing candles.
Small circles above doji candles.
All three overlays are optional and can be turned on or off and recolored in the CANDLE PATTERNS group of inputs.
5. Inputs overview
The script organizes settings into clear groups:
DISPLAY SETTINGS : Show bullish/bearish FVGs, show/hide mitigated zones, box extension length, box border width, and maximum number of boxes.
EQUILIBRIUM : Toggle equilibrium lines, color, and line width.
LABELS : Enable labels, choose whether to label unmitigated and/or mitigated zones, and select label size.
BULLISH COLORS / BEARISH COLORS : Separate fill and border colors for bullish and bearish gaps.
MITIGATED STYLE : Opacity used when a gap is marked as mitigated.
STATISTICS : Toggle the on-chart FVG statistics panel.
CANDLE PATTERNS : Show engulfing patterns, show dojis, colors, and the body-to-range threshold that defines a doji.
6. Statistics panel
An optional table in the corner of the chart summarizes the current state of all tracked gaps:
Total number of FVGs still being tracked.
Number of bullish vs bearish FVGs.
Number of unfilled vs mitigated FVGs.
Simple fill rate: percentage of tracked FVGs that have been marked as mitigated.
This can help you study how a particular market tends to treat gaps over time.
7. How you might use it (examples)
These are usage ideas only, not recommendations:
Study how often your symbol mitigates gaps and where inside the zone price tends to react.
Use higher-timeframe context and then refine entries near the equilibrium line on your trading timeframe.
Combine FVG zones with basic candle patterns (engulfing/doji) as an extra visual anchor, if that fits your process.
Hope you enjoy, give your feedback in the comments!
- officialjackofalltrades

ATM PROThe world’s strongest indicator that combines multiple indicators together, providing you with entry points, targets, and stop-loss levels with extreme accuracy. You can adjust its inputs to suit Forex and crypto pairs according to your needs. It contains these tools, and you can modify them based on your requirements.
المؤشر الاقوى عالميا الذي جمع عدة مؤشرات معا , من خلاله سيعطيك نقاط ( دخول واهداف وايقاف خسارة ) بدقة متناهية وتستطيع ان تعدل المدخلات ليتناسب مع ازواج الفوركس والكريبتو بشكل يتناسب مع ما تحتاجه
يحتوي على هذه الادوات ويمكنك تعديلها حسب متطلباتك
SHORT EMA
LONG EMA
TREND EMA
MACD SHORT
MACD LONG
MACD SIGNAL
RSI LENGTH
ATR LENGTH
VOLUME MULTIPLIER
ATR TARGET 1.2.3.4.5
STOP LOSS MULTIPLIER
BY ATM TEAM

FusionFlow Pro – Trend & Regime🌀 FusionFlow Pro — Trend & Regime
Introduction
FusionFlow Pro is a visual trend-and-regime map designed for traders who prefer clarity over noise.
It blends multiple concepts—trend direction, volatility, volume behavior, higher-timeframe bias, and a smooth neon-gradient ribbon—into a single, readable structure.
This tool was built over many revisions and experiments, and it’s offered freely for the community. The goal is simple: provide a clean way to understand market context without overwhelming the chart.
About the Indicator
FusionFlow Pro combines several market components into one display:
• Trend Engine
Two adaptive moving averages form the core directional structure. Their separation, strength, and interaction define whether the market is leaning bullish, bearish, or neutral.
• Regime Classifier
The script can interpret either ADX or Choppiness Index to determine whether conditions favor trending behavior or range-bound phases.
• Volume & Momentum Influence
Volume expansion and short-term momentum add additional context, helping highlight when market participation is rising or cooling.
• Higher-Timeframe Bias (HTF)
The option to reference a larger timeframe gives users a broader directional backdrop while still trading on their preferred interval.
• Neon Ribbon Visualization
The slow MA forms the backbone of a multi-gradient, distance-based ribbon.
When price hugs the ribbon, the fill becomes subtle and transparent; as price moves away, the ribbon becomes more visible.
This creates an intuitive sense of distance, pressure, and trend engagement.
• HUD Panel
A compact top-right panel summarizes the current trend state, regime, volume condition, HTF bias, and most recent event.
It acts as a quick reference so the chart stays readable even at fast timeframes.
Color Interpretation
FusionFlow Pro uses color to convey structure at a glance:
Ribbon Line:
• Uptrend: green-cyan tone
• Downtrend: soft red-magenta tone
• Neutral: cool gray-blue
Ribbon Fill:
A neon gradient cycles from lime → aqua → blue → violet → soft red.
The specific color is determined by the slow MA’s position inside a 50-bar normalization window.
Opacity Behavior:
• Near the ribbon: color is more pronounced
• Approaching the candles: the fill fades smoothly
• At the extremes: almost fully transparent
This tapered fade is intentional—it helps the shape remain visible without overwhelming the candles underneath.
HUD Colors:
Each HUD value shifts based on conditions—bullish, bearish, neutral, trending, choppy, strong volume, etc.—making it easy to read with peripheral vision.
Settings & Customization
FusionFlow Pro allows users to customize its behavior without assuming any specific market or style.
Different symbols—indices, crypto, commodities, forex, individual stocks—can have very different volatility and rhythm. Because of that, many traders tweak the MA lengths, ATR multiplier, volume factor, and regime settings depending on the symbol or timeframe they prefer.
Shorter lengths generally create a more reactive environment; longer lengths smooth out noise. ATR buffer and volume requirements can be increased or reduced depending on how tightly or loosely the user wants FusionFlow Pro to respond.
Instead of prescribing “best settings,” FusionFlow Pro stays neutral and flexible.
Experimenting with adjustments is part of the workflow, and finding a comfortable configuration is encouraged.
Disclaimer
This script is published purely for chart visualization and educational use.
It does not provide financial advice, does not guarantee outcomes, and should not be used as a sole basis for trading decisions.
Users remain responsible for their own analysis and risk management.

Trendviewer_Auctheo.Trendviewer 240 is built for traders who want clearer structure and fewer false starts. It reads higher-timeframe trend strength and turns it into a simple visual map on your active chart. You get precise directional bias, dynamic stop zones that adapt to current volatility, and optional filters that help you stay aligned with momentum instead of fighting it.
The script highlights areas where the trend is shifting, shows you when conditions are supportive for entries, and manages exits using a mix of adaptive levels and tiered targets. Everything is designed to keep your decision-making clean without cluttering the chart or revealing unnecessary details.
If you trade with the higher timeframe in mind but want the execution on the lower timeframe to feel controlled and confident, this tool will fit right in.
Please for free to contact us @theauctiontheorist@gmail.com

Spot-Futures SpreadSpot-Futures Spread Indicator
A comprehensive indicator that automatically calculates and visualizes the percentage spread between spot and perpetual futures prices across multiple exchanges.
Key Features:
Automatic Exchange Detection - Automatically detects your current exchange and finds the corresponding spot/futures pair
Smart Fallback System - If the counterpart isn't available on your exchange, it automatically searches across 7+ major exchanges (Binance, Bybit, OKX, Gate.io, MEXC, KuCoin, HTX) and uses the first valid match
Multi-Exchange Support - Works with 14 exchanges including Binance, Bybit, OKX, MEXC, BitGet, Gate.io, KuCoin, and more
Clear Exchange Attribution - Shows exactly which exchanges are providing spot and futures data in the statistics table
Configurable Moving Average - Track the average spread with customizable period
Standard Deviation Bands - Identify unusual spread conditions with Bollinger-style bands
Built-in Alerts - Get notified when spread crosses bands or zero (parity)
Statistics Table - Real-time stats showing current spread, MA, std dev, and bands
Manual Override Options - Advanced users can manually specify exchanges and symbols
How It Works:
The indicator calculates the spread as: (Futures Price - Spot Price) / Spot Price × 100
Positive spread = Futures trading at a premium (contango)
Negative spread = Futures trading at a discount (backwardation)
Zero = Parity between spot and futures
Use Cases:
Funding Rate Analysis - Correlates with perpetual funding rates
Arbitrage Opportunities - Identify significant spot-futures divergences
Market Sentiment - Premium/discount indicates bullish/bearish positioning
Cross-Exchange Analysis - Compare spreads when spot and futures are on different exchanges
Smart Features:
Works whether you're viewing a spot or futures chart
Automatically handles exchange-specific perpetual contract naming (.P, PERP, SWAP, etc.)
Color-coded visualization (green for premium, red for discount)
Customizable colors and display options
Background shading based on spread direction
Perfect For:
Crypto traders monitoring funding rates, arbitrage traders, market makers, and anyone interested in spot-futures dynamics across multiple exchanges.
Getting Started:
Simply add the indicator to any spot or perpetual futures chart. It will automatically detect the exchange and find the corresponding pair. The statistics table shows which exchanges are being used for maximum transparency.
Note: The indicator automatically ignores invalid symbols, so you'll never see errors even if a specific pair doesn't exist on a particular exchange.
Kudos to @AlekMel that made the "Spot - Fut Spread v2" indicator that I enhance the Automatic detection feature which was not working in some case.

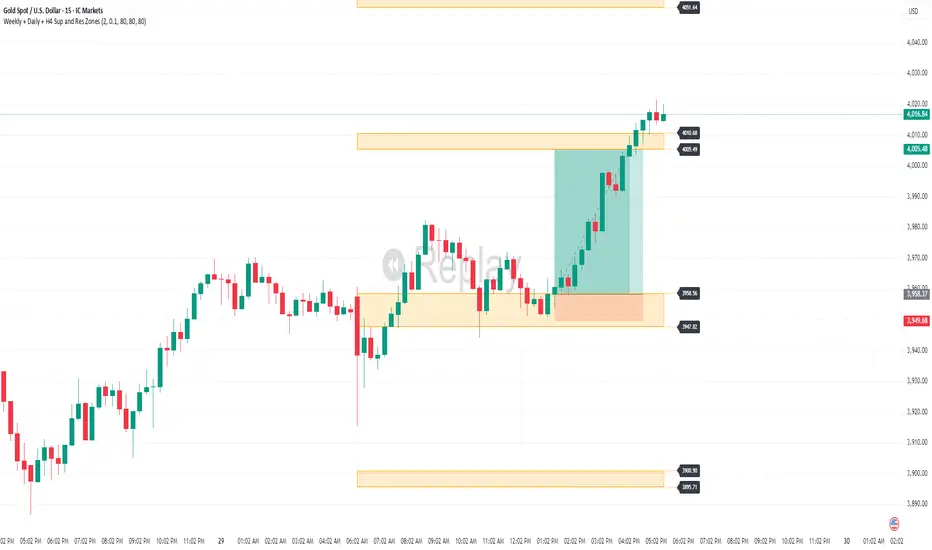
Weekly + Daily + H4 Sup and Res ZonesEveryday price move at a set range. Just wait at the zone for candle reversal/continuation pattern formation before entry. Always keep it simple. Patience is key. Just Pick your preferred tf zone. Daily zone highly recommended for less than 100 pips target. H4 for scalpers and Weekly for swingers.
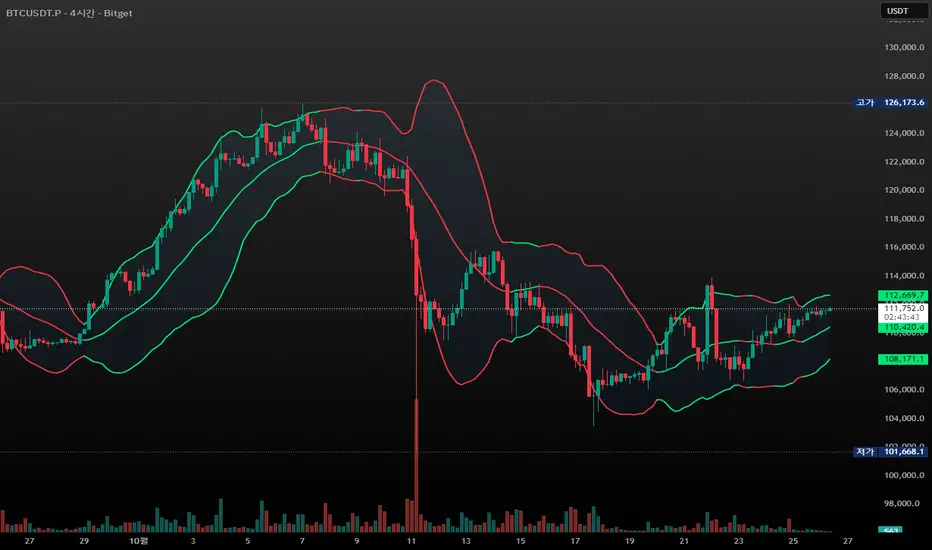
CandleFlow — Adaptive-Colored Bollinger BandsEN — What it is
Classic Bollinger Bands with adaptive color. Bands turn green when the basis slope is rising and red when it is falling. Same BB math; only visuals adapt. Two-state only.
Features
• Works on any timeframe; built with daily crypto in mind
• Inputs: Length 20, Multiplier 2.0, MA Type (SMA/EMA/WMA), Slope Length, Up/Down thresholds, Band fill
• Alerts: Trend state turns Up / turns Down
Notes
• Invite-only access. Source code not provided.
• No profit guarantee; this is not financial advice.
KR — 요약
표준 볼린저 계산은 그대로, 기준선이 상승하면 초록/하락하면 빨강으로 자동 색상 전환. 일봉 크립토에 최적화. 입력값(기간 20, 배수 2.0, MA 타입, 기울기 길이, 상/하 임계값, 밴드 채우기), 알림(상승/하락 전환) 제공. 초대전용, 코드 비공개. 수익 보장 없음.
Trademark
Bollinger Bands® is a registered trademark of John Bollinger. Not affiliated or endorsed.
VAGANZA Swings V1 LITE1. Introduction: The Philosophy Behind VAGANZA Swings
The VAGANZA Swings V1 LITE was developed to solve a common problem faced by swing traders: getting caught in low-probability trades during choppy, sideways markets. Many indicators can identify a trend, but few can effectively measure its quality and pinpoint optimal, low-risk entry points within that trend.
This script is not merely a "mashup" of existing indicators. It is a structured, multi-layered filtering system where each component is specifically chosen to address the weaknesses of the others. The core philosophy is to trade only when there is a clear market consensus, confirmed by trend, strength, momentum, and volume. This results in fewer signals, but each signal is designed to be of significantly higher quality.
2. The VAGANZA Confirmation Engine: A Deeper Look at the Logic
A signal is only generated when four distinct market conditions align. This sequential confirmation process is what makes the script unique and robust.
Layer 1: The Trend Regime Filter
What it does: The indicator first establishes the dominant market bias using a dual-speed baseline system. A faster-reacting baseline is compared against a slower, more stable baseline to determine if the market is in a long-term bullish or bearish "regime."
Why it's important: This foundational step ensures we are never fighting the primary market current. BUY signals are disabled during a bearish regime, and SELL signals are disabled during a bullish regime, instantly eliminating 50% of potentially bad trades.
Layer 2: The Trend Strength & Conviction Qualifier
What it does: This is the script's core intelligence. After confirming the trend's direction, this layer uses a directional volatility engine to measure the trend's strength or conviction. It analyzes the expansion between bullish and bearish price movements.
Why it's important: A simple moving average crossover can occur in a weak, drifting market, leading to false signals. This filter requires the trend to be demonstrably powerful (above a predefined strength threshold of 25) before allowing the system to even look for an entry. It's the primary filter for avoiding sideways market traps.
Layer 3: The Dynamic Pullback & Entry Trigger
What it does: Instead of chasing price at its peak, the script waits for a natural "breather" or pullback. It employs a momentum cycle oscillator to identify when the price has become temporarily oversold within a strong uptrend, or overbought within a strong downtrend. The signal is triggered at the precise moment momentum appears to be rejoining the primary trend.
Why it's important: This ensures a more favorable risk-to-reward ratio. By entering on a pullback, traders can avoid buying the top or selling the bottom of a short-term swing, which is a common mistake.
Layer 4: The Volume Participation Check
What it does: As a final confirmation, the script checks the volume on the signal candle. It requires the volume to be higher than its recent average.
Why it's important: A price move without significant volume can be a trap. This final check confirms that there is genuine market participation and conviction behind the signal, suggesting that larger market players are supporting the move.
3. The Synergy of the System (Why This Combination is Original)
The originality of VAGANZA Swings lies not in its individual components, but in their synergistic interaction:
The Trend Regime Filter sets the stage.
The Trend Strength Qualifier prevents signals when the stage is poorly lit (i.e., a weak trend).
The Pullback & Entry Trigger tells the actor exactly when to enter the stage for maximum impact.
The Volume Check ensures the audience is actually watching.
Without the strength filter, the trend filter would fail in ranging markets. Without the pullback trigger, entries would have poor risk-reward. This interdependent, sequential logic provides a unique and useful tool that goes beyond what a single indicator can offer.
4. How to Use This Script
Timeframe: Optimized for the 4-Hour (H4) chart, as this provides a balance between meaningful swings and actionable signals. It can also be used on the Daily (D1) chart for longer-term analysis.
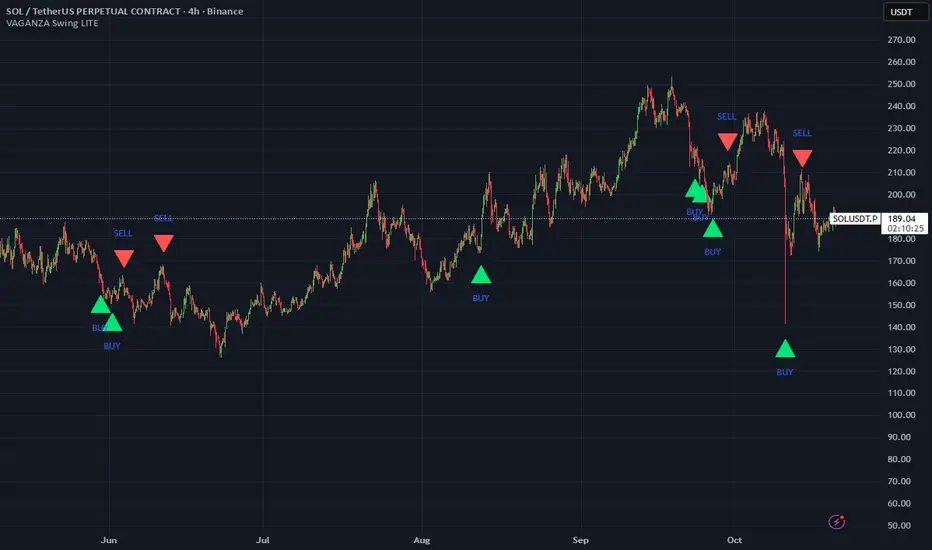
BUY Signal (Green "BUY" Arrow): Appears only when a strong, confirmed uptrend experiences a temporary, oversold pullback and volume confirms renewed buying interest. This is a high-probability signal to consider a long position.
SELL Signal (Red "SELL" Arrow): Appears only when a strong, confirmed downtrend experiences a temporary, overbought rally and volume confirms renewed selling pressure. This is a high-probability signal to consider a short position.
Risk Management: This indicator provides entry signals only. It is crucial that you apply your own risk management rules. Always use a stop-loss and have a clear take-profit strategy for every trade.
Disclaimer: This tool is for decision-support and does not constitute financial advice. All trading involves risk. Past performance is not indicative of future results. Please backtest thoroughly before using this script with real capital.
12/21 x 50-100-200 MA - [RZ]👁️ - 12/21 x 50-100-200 MA
A comprehensive moving average overlay indicator designed to identify trend direction and key support/resistance levels using a dual fast/slow MA crossover system combined with three major moving averages.
⛓️ - FEATURES
Dual MA Crossover System: Configurable short (default 12) and long (default 21) period moving averages that change color based on trend direction
Triple Major MAs: 50, 100, and 200 period moving averages displayed in blue, yellow, and red respectively for identifying key market structure levels
Multiple MA Types: Choose from SMA, EMA, DEMA, TEMA, LSMA, WMA, or HMA for all calculations
Customizable Source: Apply the indicator to any price source (close, open, high, low)
Optional Bar Coloring: Visualize trend direction directly on price bars
Built-in Alerts: Automated alerts for trend reversals (Trend Up/Trend Down)
🎮 - HOW TO USE
Bullish Signal: When the short MA crosses above the long MA, both MAs turn green
Bearish Signal: When the short MA crosses below the long MA, both MAs turn red
The 50/100/200 MAs serve as dynamic support/resistance levels and help confirm overall market trend
Use bar coloring for quick visual identification of current trend state
🧰 - OPTIONS
Adjustable lengths for all moving averages
Color customization for bullish/bearish trends
Toggle bar coloring on/off
Select preferred MA calculation method
⚠️ - DISCLAIMER
This indicator is provided for educational and informational purposes only and should not be considered financial advice.
Trading and investing in financial markets involves substantial risk of loss and is not suitable for every investor.
Past performance is not indicative of future results.
The signals and information generated by this indicator do not guarantee profits and may result in losses.
Users should conduct their own research and due diligence, and consult with a qualified financial advisor before making any investment decisions.
The creator of this indicator assumes no responsibility for any financial losses incurred through the use of this tool.
By using this indicator, you acknowledge that you are solely responsible for your trading decisions and their outcomes.
👑 - CREDITS
@profmichaelg for Michael's EMA indicator

12/21 EMA STRAT - [RZ]12/21 EMA Strategy with Performance Analytics
👁️ - OVERVIEW
This indicator implements a simple yet effective exponential moving average (EMA) crossover strategy that compares a 12-period EMA against a 21-period EMA. The system generates long signals when the 12 EMA is positioned above the 21 EMA, and moves to cash when the 12 EMA falls below the 21 EMA.
🧠 - STRATEGY LOGIC
Signal Generation:
Long Position: Activated when 12 EMA > 21 EMA
Cash Position: Activated when 12 EMA < 21 EMA
Technical Implementation:
Uses perpetual condition checks instead of crossover/crossunder functions to prevent signal misgeneration and ensure reliability
Implements barstate.isconfirmed validation to eliminate repainting issues and ensure all signals are confirmed on closed bars
Provides clean, reliable signals suitable for both backtesting and live trading
⚙️ - FEATURES
The indicator includes a comprehensive table displaying real-time performance metrics comparing the strategy against a buy-and-hold approach:
Sharpe Ratio: Risk-adjusted return measurement
Sortino Ratio: Downside risk-adjusted return measurement
Omega Ratio: Probability-weighted ratio of gains versus losses
Maximum Drawdown %: Largest peak-to-trough decline
Visual Components
Equity Curves: Plots both strategy equity and buy-and-hold equity for visual comparison
Status Table: Real-time display of current position (Long/Cash) and performance metrics
Clean Chart Interface: Easy-to-read visualization of strategy performance
Alert System
Long signal triggers
Cash signal triggers
📝 - How to Use
Add the indicator to your chart
Review the performance metrics table to compare strategy vs. buy-and-hold
Monitor the equity curves to visualize strategy performance
Set up alerts for long and cash signals if desired
Use the current position indicator to track strategy status
📊 - Multi-Timeframe Compatibility
This indicator works across multiple timeframes, however, performance characteristics vary significantly depending on the timeframe selected:
Different timeframes will produce different results
Strategy performance may be optimal on certain timeframes and underperform on others
DYOR (Do Your Own Research): Users are strongly encouraged to backtest the strategy on their preferred timeframes and market conditions before use
Test extensively with historical data to understand the strategy's behavior in your specific use case
ETH
SOL
⚠️ - DISCLAIMER
This indicator is provided for educational and informational purposes only. It is NOT financial advice, investment advice, or a recommendation to buy or sell any security or financial instrument.
Past performance does not guarantee future results
Trading involves substantial risk of loss and is not suitable for all investors
You should carefully consider your financial situation and risk tolerance before making any trading decisions
Always conduct your own research and consult with a qualified financial advisor before making investment decisions
The creator of this indicator assumes no responsibility for any financial losses incurred through the use of this tool
Use this indicator at your own risk


GT PancakeSwap Fair Value Model v1This is not financial advice...is just for educational purposes.
This indicator estimate the Fair Value Price of PancakeSwap token CAKE utilizing different proprietary formulas that i develop, it consider a fair value when the price is within +10% to -10% of target price.
You can apply this indicator to any CAKE/"Stable Pair" in daily timeframe or lower for more precise results.
Hope it helps you and If you have any feedback, please leave in the comments section, thanks.

Weekend Hunter Ultimate v6.2 Weekend Hunter Ultimate v6.2 - Automated Crypto Weekend Trading System
OVERVIEW:
Specialized trading strategy designed for cryptocurrency weekend markets (Saturday-Sunday) when institutional traders are typically offline and market dynamics differ significantly from weekdays. Optimized for 15-minute timeframe execution with multi-timeframe confluence analysis.
KEY FEATURES:
- Weekend-Only Trading: Automatically activates during configurable weekend hours
- Dynamic Leverage: 5-20x leverage adjusted based on market safety and signal confidence
- Multi-Timeframe Analysis: Combines 4H trend, 1H momentum, and 15M execution
- 10 Pre-configured Crypto Pairs: BTC, ETH, LINK, XRP, DOGE, SOL, AVAX, PEPE, TON, POL
- Position & Risk Management: Max 4 concurrent positions, -30% account protection
- Smart Trailing Stops: Protects profits when approaching targets
RISK MANAGEMENT:
- Maximum daily loss: 5% (configurable)
- Maximum weekend loss: 15% (configurable)
- Per-position risk: Capped at 120-156 USDT
- Emergency stops for flash crashes (8% moves)
- Consecutive loss protection (4 losses = pause)
TECHNICAL INDICATORS:
- CVD (Cumulative Volume Delta) divergence detection
- ATR-based dynamic stop loss and take profit
- RSI, MACD, Bollinger Bands confluence
- Volume surge confirmation (1.5x average)
- Weekend liquidity adjustments
INTEGRATION:
- Designed for Bybit Futures (0.075% taker fee)
- WunderTrading webhook compatibility via JSON alerts
- Minimum position size: 120 USDT (Bybit requirement)
- Initial capital: $500 recommended
TARGET METRICS:
- Win rate target: 65%
- Average win: 5.5%
- Average loss: 1.8%
- Risk-reward ratio: ~3:1
IMPORTANT DISCLAIMERS:
- Past performance does not guarantee future results
- Leveraged trading carries substantial risk of loss
- Weekend crypto markets have 13% of normal liquidity
- Not suitable for traders who cannot afford to lose their entire investment
- Requires continuous monitoring and adjustment
USAGE:
1. Apply to 15-minute charts only
2. Configure weekend hours for your timezone
3. Set up webhook alerts for automation
4. Monitor performance table in top-right corner
5. Adjust parameters based on your risk tolerance
This is an experimental strategy for educational purposes. Always test with small amounts first and never invest more than you can afford to lose completely.

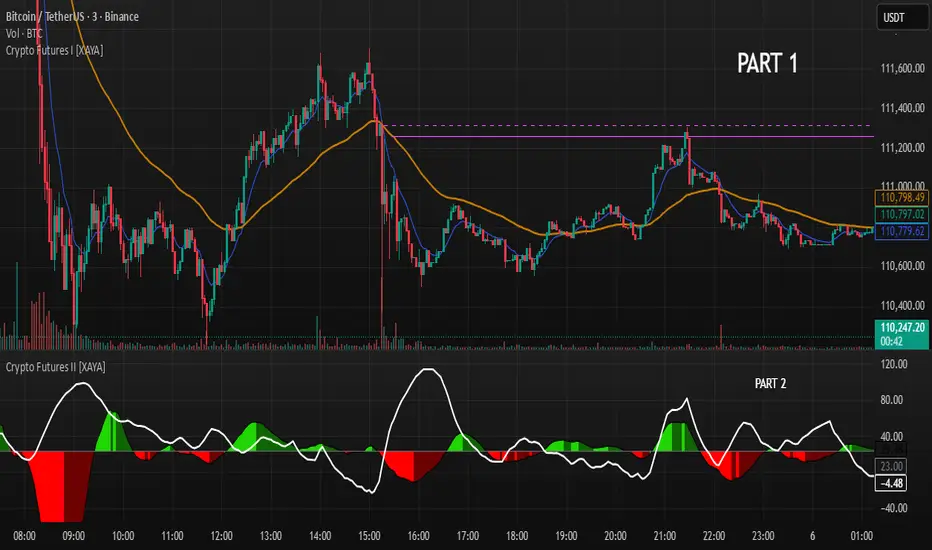
Crypto Futures I [XAYA]Crypto Futures Indicator, by XAYA.
PART 1.
Crypto Futures Indicator it's a full build-in strategy used to trade top 200 Crypto Tokens in any Time Frame from 1H to 1D.
The full strategy uses 5 separated indicators:
- Price Action
- 2 EMAS, 10 and 55
- Volume
- Squeeze Momentum
- ADX
PART 1 of Crypto Futures Indicator plots 2 EMAs (10 and 55) and an horizontal line at the cross of them, to use as areas of future interest. This cross lines that are named "Chris Cross" in honor to my mentor, come in 2 variations:
- Dashed line indicates a cross of EMAS in the present Time Frame.
- Solid line indicates a cross of EMAs in the Higher Time Frame above the present TF.
"Chris Cross" lines are hidden by default since are not needed to execute strategy, but they are good areas or Support and Resistence that can be use in confluence with the rest of the strategy as Buy or Sell points.
XAYA 2025

Crypto Futures II [XAYA]Crypto Futures Indicator, by XAYA.
PART 2.
Crypto Futures Indicator it's a full build-in strategy used to trade top 200 Crypto Tokens from, in any Time Frame from 1H to 1D. The full strategy uses 5 separated indicators:
- Price Action
- 2 EMAS, 10 and 55
- Volume
- Squeeze Momentum
- ADX
PART 2 of Crypto Futures Indicator plots the Squeeze Momentum Indicator in conyunction with ADX+ Levels, to find better entry points based on TIME (squeeze momentum) and STRENGHT (ADX). Used in confluence with Crypto Futures Indicator PART 1, can unleash the reading for a full strategy based on the 5 indicators previously mentioned.
XAYA 2025

Crypto Futures I [XAYA]Crypto Futures Indicator, by XAYA.
PART 1.
Crypto Futures Indicator it's a full build-in strategy used to trade top 200 Crypto Tokens from, in any Time Frame from 1H to 1D. The full strategy uses 5 separated indicators:
- Price Action
- 2 EMAS, 10 and 55
- Volume
- Squeeze Momentum
- ADX
PART 1 of Crypto Futures Indicator plots 2 EMAs (10 and 55) and an horizontal line at the cross of them, to use as areas of future interest. This cross lines that are named "Chris Cross" in honor to my mentor, come in 2 variations:
- Dashed line indicates a cross of EMAS in the present Time Frame.
- Solid line indicates a cross of EMAs in the Higher Time Frame above the present TF.
"Chris Cross" lines are hidden by default since are not needed to execute strategy, but they are good areas or Support and Resistence that can be use in confluence with the rest of the strategy as Buy or Sell points.
XAYA 2025
Crypto Perp Calc v1Advanced Perpetual Position Calculator for TradingView
Description
A comprehensive position sizing and risk management tool designed specifically for perpetual futures trading. This indicator eliminates the confusion of calculating leveraged positions by providing real-time position metrics directly on your chart.
Key Features:
Interactive Price Selection: Click directly on chart to set entry, stop loss, and take profit levels
Accurate Lot Size Calculation: Instantly calculates the exact position size needed for your margin and leverage
Multiple Entry Support: DCA into positions with up to 3 entry points with customizable allocation
Multiple Take Profit Levels: Scale out of positions with up to 3 TP targets
Comprehensive Risk Metrics: Shows dollar P&L, account risk percentage, and liquidation price
Visual Risk/Reward: Color-coded boxes and lines display your trade setup clearly
Real-time Info Table: All critical position data in one organized panel
Perfect for traders using perpetual futures who need precise position sizing with leverage.
---------
How to Use
Quick Start (3 Clicks)
1. Add the indicator to your chart
2. Click three times when prompted:
First click: Set your entry price
Second click: Set your stop loss
Third click: Set your take profit
3. Read the TOTAL LOTS value from the info table (highlighted in yellow)
4. Use this lot size in your exchange when placing the trade
Detailed Setup
Step 1: Configure Your Account
Enter your account balance (total USDT in account)
Set your margin amount (how much USDT to risk on this trade)
Choose your leverage (1x to 125x)
Select Long or Short position
Step 2: Set Price Levels
Main levels use interactive clicking (Entry, SL, TP)
For multiple entries or TPs, use the settings panel to manually input prices and percentages
Step 3: Read the Results
The info table shows:
TOTAL LOTS - The position size to enter on your exchange
Margin Used - Your actual capital at risk
Notional - Total position value (margin × leverage)
Max Risk - Dollar amount you'll lose at stop loss
Total Profit - Dollar amount you'll gain at take profit
R:R Ratio - Risk to reward ratio
Account Risk - Percentage of account at risk
Liquidation - Price where position gets liquidated
Step 4: Advanced Features (Optional)
Multiple Entries (DCA):
Enable "Use Multiple Entries"
Set up to 3 entry prices
Allocate percentage for each (must total 100%)
See individual lot sizes for each entry
Multiple Take Profits:
Enable "Use Multiple TPs"
Set up to 3 TP levels
Allocate percentage to close at each level (must total 100%)
View profit at each target
Visual Elements
Blue lines/labels: Entry points
Red lines/labels: Stop loss
Green lines/labels: Take profit targets
Colored boxes: Visual risk (red) and reward (green) zones
Info table: Can be positioned anywhere on screen
Alerts
Set price alerts for:
Entry zones reached
Stop loss approached
Take profit levels hit
Works with TradingView's alert system
Tips for Best Results
Always verify the lot size matches your intended risk
Check the liquidation price stays far from your stop loss
Monitor the account risk percentage (recommended: keep under 2-3%)
Use the warning indicators if risk exceeds margin
For quick trades, use single entry/TP; for complex strategies, use multiple levels
Example Workflow
Find your trade setup using your analysis
Add this indicator and click to set levels
Check risk metrics in the table
Copy the TOTAL LOTS value
Enter this exact position size on your exchange
Set alerts for key levels if desired
This tool bridges the gap between TradingView charting and exchange execution, ensuring your position sizing is always accurate when trading with leverage.
Disclaimer, this was coded with help of AI, double check calculations if they are off.

Advanced Crypto Trading Dashboard📊 Advanced Crypto Trading Dashboard
🎯 FULL DESCRIPTION FOR TRADINGVIEW POST:
🚀 WHAT IS THIS DASHBOARD?
This is an advanced multi-timeframe technical analysis dashboard designed specifically for cryptocurrency trading. Unlike basic indicators, this script combines 8 essential metrics into a single visual table, providing a 360º market overview across 4 simultaneous timeframes.
📈 ANALYZED TIMEFRAMES:
- 15M: For scalping and precise entries
- 1H: For short-term swing trades
- 4H: For intermediate analysis and confirmations
- 1D: For macro view and main trend
🎯 ADVANCED METRICS EXPLAINED:
1. 📊 MOMENTUM
- Calculation: Combines RSI (40%) + MACD (30%) + Volume (30%)
- Ratings: Bullish | Neutral ↗ | Neutral ↘ | Bearish
- Use: Identifies the strength of the current movement
2. 📈 TREND
- Calculation: Alignment of EMAs (8, 21, 55) + ADX for strength
- Signals: Strong ↗ | Strong ↘ | Trending | Ranging
- Use: Confirms trend direction and intensity
3. 💰 MONEY FLOW
- Calculation: Money Flow Index (MFI) - advanced RSI with volume
- States: Bullish | Bearish | Overbought | Oversold
- Use: Detects real buying/selling pressure (not just candle color)
4. 🎯 RSI
- Calculation: Traditional 14-period RSI
- Zones: > 70 (Overbought) | < 30 (Oversold) | Neutral
- Use: Identifies price extremes and opportunities
5. ⚡ VOLATILITY
- Calculation: ATR in percentage + state classification
- States: High | Medium | Low + exact %
- Use: Assesses risk and movement potential
6. 🔔 BB SIGNAL
- Calculation: Price position in Bollinger Bands
- Signals: Overbought | Oversold | Neutral
- Use: Confirms extremes and reversal points
7. 🎲 SCORE
- Calculation: Composite score from 0-100 based on all indicators
- Colors: Green (>75) | Yellow (40-75) | Red (<40)
- Use: Quick overall assessment of asset strength
🎨 VISUAL FEATURES:
🌈 SMART COLOR SYSTEM:
- Green: Bullish signals/buy opportunities
- Red: Bearish signals/sell opportunities
- Yellow: Neutral zones/wait for confirmation
- Blue: Neutral technical information
📍 FULL CUSTOMIZATION:
- Position: Left | Center | Right
- Size: Small | Normal | Large
- Emojis: On/Off for professional settings
- Parameters: All periods adjustable
📋 HOW TO INTERPRET:
✅ STRONG BUY SIGNAL:
- Momentum: Bullish
- Trend: Strong ↗
- Money Flow: Bullish
- RSI: 30-70 (healthy zone)
- Score: >60
❌ STRONG SELL SIGNAL:
- Momentum: Bearish
- Trend: Strong ↘
- Money Flow: Bearish
- RSI: >70 or <30 (extremes)
- Score: <40
⚠️ CAUTION ZONE:
- Conflicting signals across timeframes
- Money Flow vs. Trend divergence
- RSI at extremes with average Score
💡 USAGE STRATEGIES:
🎯 SCALPING (15M-1H):
- Check alignment between 15M and 1H
- Enter when both show the same signal
- Use Stop Loss based on volatility
📈 SWING TRADING (1H-4H):
- Confirm trend on 4H
- Enter on pullbacks in 1H
- Target based on overall Score
🏦 POSITION TRADING (4H-1D):
- Focus on 1D analysis
- Use 4H for entry timing
- Hold position until Score reverses
🔧 RECOMMENDED SETTINGS:
👨💼 FOR PROFESSIONAL TRADERS:
- Position: Center
- Size: Normal
- Emojis: Off
- Chart Timeframe: 1H
🎮 FOR BEGINNERS:
- Position: Right
- Size: Large
- Emojis: On
- Chart Timeframe: 4H
⚡ ADVANTAGES OVER OTHER DASHBOARDS:
✅ Precise Calculations: Real MFI vs. "fake buyer volume"
✅ Multi-Timeframe: 4 simultaneous analyses
✅ Composite Score: Overall view in one number
✅ Intuitive Visuals: Clear colors and symbols
✅ Fully Customizable: Adapts to any setup
✅ Zero Repaint: Reliable and stable data
✅ Optimized Performance: Doesn’t lag the chart
🎓 PRACTICAL EXAMPLE:
Asset: BTCUSDT | Timeframe: 1H
| TF | Momentum | Trend | Money Flow | RSI | Score |
|------|----------|------------|------------|-----|-------|
| 15M | Bullish | Strong ↗ | Bullish | 65 | 78 |
| 1H | Neutral↗ | Strong ↗ | Bullish | 58 | 68 |
| 4H | Neutral↘ | Trending | Bearish | 45 | 52 |
| 1D | Bearish | Strong ↘ | Bearish | 35 | 32 |
📊 Interpretation:
- Short-term: Bullish (15M-1H aligned)
- Mid-term: Conflict (4H neutral)
- Long-term: Bearish (1D negative)
- Strategy: Short-term bullish trade with tight stop
🚨 IMPORTANT NOTES:
- This indicator is a support tool, not an automated system
- Always combine with traditional chart analysis
- Test in paper trading before using real money
- Always manage risk with appropriate stop loss
- Not a holy grail - no indicator is 100% accurate
📞 SUPPORT AND FEEDBACK:
Leave your rating and comments! Your feedback helps continuously improve this tool.

Multi-Factor Crypto SignalsMulti-Factor Crypto Signals - Advanced Technical Indicator**
📊 **General Description**
The Multi-Factor Crypto Signals is an advanced technical indicator designed specifically for cryptocurrency analysis. This system combines 6 independent technical factors to generate more accurate and reliable buy and sell signals, significantly reducing the false positives common in simpler indicators.
🎯 **Technical Methodology**
**Theoretical Foundation**
This indicator is built on the principles of multi-factor technical analysis, where multiple independent indicators must align before generating a signal. This approach is widely recognized in financial literature as more effective than standalone indicators.
**Analyzed Factors**
1. **Time Momentum Oscillator (TMO)**
- **Function**: Detects overbought and oversold conditions
- **Calculation**: Based on the sum of price movements relative to the previous period
- **Application**: Identifies potential reversal points
- **Settings**: Length (14), Calculation Period (5), Smoothing (3)
2. **Customized MACD**
- **Function**: Analyzes momentum and trend changes
- **Modifications**: Optimized periods for crypto (8, 21, 5)
- **Application**: Detects bullish/bearish crossovers and histogram momentum
- **Advantage**: More responsive than traditional MACD (12, 26, 9)
3. **Volume Analysis**
- **Function**: Confirms the strength of price movements
- **Method**: Current volume vs. moving average with a multiplier
- **Application**: Filters signals without volume support
- **Settings**: MA Period (20), Multiplier (1.5)
4. **DXY Filter (U.S. Dollar Index)**
- **Function**: Considers the strength/weakness of the U.S. dollar
- **Correlation**: Weak DXY → bullish for crypto / Strong DXY → bearish for crypto
- **Data**: Uses TVC:DXY as the source
- **Settings**: 21-period EMA to determine trend
5. **Stochastic RSI**
- **Function**: A more sensitive version of RSI for reversals
- **Advantage**: Anticipates movements before traditional RSI
- **Levels**: Oversold < 20, Overbought > 80
- **Settings**: %K (14), %D (3)
6. **Precision Indicators**
- **Williams %R**: Momentum in volatile markets (-80/-20)
- **Money Flow Index (MFI)**: RSI with volume incorporation (20/80)
- **Bollinger Bands**: Price extremes with reversal (20, 2.0)
⚙️ **Settings and Parameters**
**Basic Settings**
- **TMO Length**: 14 (periods for TMO calculation)
- **TMO Calc Length**: 5 (periods for momentum)
- **TMO Smoothing**: 3 (line smoothing)
- **TMO Overbought/Oversold**: 6/-6 (entry levels)
**MACD Settings**
- **Fast Length**: 8 (fast EMA)
- **Slow Length**: 21 (slow EMA)
- **Signal Length**: 5 (signal line)
**Volume Settings**
- **Volume MA Length**: 20 (volume moving average)
- **High Volume Threshold**: 1.5 (multiplier for high volume)
**DXY Settings**
- **Use DXY Filter**: true/false (enable/disable filter)
- **DXY EMA Length**: 21 (EMA periods)
**Precision Settings**
- **Stochastic %K**: 14 (stochastic period)
- **Williams %R Length**: 14 (Williams period)
- **MFI Length**: 14 (MFI period)
- **BB Length/Multiplier**: 20/2.0 (Bollinger Bands)
**Main Setting**
- **Minimum Factors Required**: 3-6 (minimum factors to generate a signal)
🎨 **Visual Interpretation**
**Main Signals**
- 🚀 **Strong Buy (Large Green Arrow)**: 5+ factors aligned for a buy
- 🟢 **Buy Signal (Normal Green Arrow)**: 3-4 factors aligned for a buy
- 💥 **Strong Sell (Large Red Arrow)**: 5+ factors aligned for a sell
- 🔴 **Sell Signal (Normal Red Arrow)**: 3-4 factors aligned for a sell
**Warning Signals**
- ⚠️ **Yellow Triangle**: 2 bullish factors (approaching a buy signal)
- ⚠️ **Orange Triangle**: 2 bearish factors (approaching a sell signal)
📈 **How to Use**
**Step 1: Initial Setup**
- Add the indicator to the chart
- Adjust "Minimum Factors Required" (recommended: 3 for beginners, 4-5 for experienced traders)
- Configure periods based on your trading style
**Step 2: Signal Interpretation**
- **Strong Signals**: Wait for large arrows (5+ factors) for higher reliability
- **Normal Signals**: Normal arrows (3-4 factors) for frequent opportunities
- **Confirmation**: Check the status table to see which factors are active
**Step 3: Risk Management**
- **Stop Loss**: Place stops below/above supports/resistances
- **Take Profit**: Use Fibonacci levels or technical resistances
- **Timeframes**: Test across multiple timeframes for confirmation
**Recommended Settings by Profile**
- **Conservative Trader**:
- Minimum Factors: 4-5
- Use DXY Filter: true
- Use Volume Confirmation: true
- **Aggressive Trader**:
- Minimum Factors: 3
- Shorter indicator periods
- Focus on higher-frequency signals
- **Scalper**:
- TMO shorter periods (10, 3, 2)
- Faster MACD (5, 13, 3)
- Timeframes: 1m, 5m, 15m
🔔 **Available Alerts**
- 🟢 **Multi-Factor Buy**: Normal buy signal
- 🔴 **Multi-Factor Sell**: Normal sell signal
- 🚀 **Strong Buy**: Strong buy signal (5+ factors)
- 💥 **Strong Sell**: Strong sell signal (5+ factors)
Usage Recommendations**
- **Combine with Fundamental Analysis**: Use as a complement, not a standalone tool
- **Test in Paper Trading**: Practice before using real capital
- **Adjust Parameters**: Optimize for specific assets and timeframes
- **Risk Management**: Always use stops and size positions appropriately
📚 **Scientific Basis and References**
**Academic Foundation**
- **Multi-Factor Technical Analysis**: Based on studies by Murphy (1999) and Pring (2002)
- **Momentum Oscillators**: Grounded in Wilder (1978) and Lane (1984)
- **Confirmation Theory**: Dow Theory and convergence/divergence principles
- **Volume Analysis**: Concepts from Granville (1963) and Williams (1973)
**Implemented Innovations**
- **Crypto-Specific Combination**: Parameters optimized for high volatility
- **DXY Filter**: Incorporates crypto-dollar inverse correlation
- **Scoring System**: Quantitative approach to reduce subjectivity
- **Advanced Visual Interface**: Real-time feedback on factor status
💡 **Advanced Tips**
**Market Optimization**
- **Bitcoin/Ethereum**: Use default settings
- **Low-Cap Altcoins**: Increase sensitivity (shorter periods)
- **Stablecoins**: Not recommended (low volatility)
**Combination with Other Indicators**
- **Supports/Resistances**: Use for entry/exit timing
- **Moving Averages**: Combine with long-term trend
- **Volume Profile**: Confirm with high-activity levels
**Backtesting**
- Test in periods of high and low volatility
- Compare performance across different timeframes
- Adjust parameters based on historical results

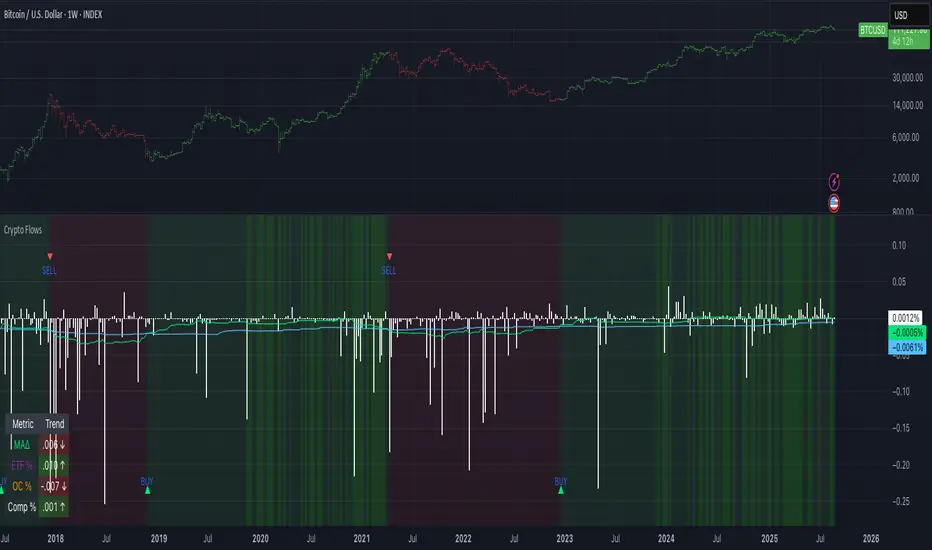
Crypto Flows [ETF|On-chain]The surge in Bitcoin and Ethereum spot ETFs has transformed how crypto is held and traded. By mid‑2025, U.S. spot Bitcoin ETFs already controlled roughly 1.28 million BTC, or about 6.5 percent of the circulating supply (Fosque, 2025). This accumulation has coincided with sharp price rallies and signals that regulated vehicles are absorbing a meaningful share of supply (Fosque, 2025; Wright, 2025). At the same time, on‑chain analytics show that exchange flows still influence markets: large inflows to exchanges often precede sell‑offs, whereas withdrawals to private wallets signal accumulation and reduced sell pressure (Singh, 2024; CryptoQuant, 2024). IntoTheBlock’s large‑holder inflow indicator even notes that spikes in whale buying frequently mark major bottoms (IntoTheBlock, 2022). I wanted to weave these pieces together, so I created this indicator.
Essence and logic
The script draws from two data streams: net flows into ETFs and net on‑chain flows from large holders, both scaled by the asset’s circulating market cap. ETF flows are aggregated across the ten largest INDEX:BTCUSD Bitcoin ETFs, the ten largest Ethereum INDEX:ETHUSD ETFs and the first CRYPTOCAP:SOL Solana ETF; each fund has its own checkbox and colour selection. On‑chain data uses IntoTheBlock’s large‑holder inflows and outflows, with dozens of coins available( CRYPTO:XRPUSD CRYPTOCAP:AVAX CRYPTOCAP:ADA CRYPTOCAP:LINK CRYPTO:DOGEUSD CRYPTOCAP:OTHERS ; if your coin isn’t shown in the dropdown you can manually enter its symbol. For each component, daily flows are converted into either a Z‑score or, by default, a percent‑of‑market‑cap series; users choose the weighting between ETF and on‑chain signals. These weighted series are summed into a composite, smoothed, and then two moving averages (a fast and a slow one) are applied to define bullish or bearish regimes. Because ETFs are a recent phenomenon, the early part of the composite is dominated by on‑chain flows; as ETF history lengthens, the fund‑flow component will become more influential. Trade signals are generated via moving‑average crossovers and optional dip triggers, and a trend table summarises current values and directions.
Why these components?
ETF flows reflect institutional adoption and supply absorption. Funds such as IBIT already hold about 744 000 BTC (roughly 3.3 percent of total supply), and cumulative ETF holdings have been growing faster than new coins are mined (Wright, 2025). Net inflows into these vehicles have tended to accompany rising prices and signal long‑horizon capital (Fosque, 2025). On‑chain flows, meanwhile, capture exchange liquidity dynamics. High inflows to exchanges often indicate that investors are preparing to sell, increasing tradable supply (Singh, 2024; CryptoQuant, 2024). Outflows into self‑custody suggest accumulation and reduced sell pressure, providing a bullish signal (Singh, 2024; CryptoQuant, 2024). IntoTheBlock points out that spikes in large‑holder inflows—whales moving coins into cold storage—have historically preceded price bottoms (IntoTheBlock, 2022). By weighting and standardising these flows relative to market cap, the composite aims to offer a more objective lens on risk‑on versus risk‑off regimes than price alone.
Limitations and outlook
ETFs a pretty new, so the data history is short. The list of tracked funds is currently limited to U.S. and European products; adding Asian or Canadian vehicles could provide a fuller picture. On‑chain flows can be noisy and occasionally give conflicting signals, and large‑holder data is not available for every crypto asset. The ETF and on‑chain components are also correlated through market cap, so equal weighting may amplify common trends. As macro conditions evolve and ETF redemption mechanisms change, the usefulness of fund flows could vary. I see this indicator as one tool among many, and I’m considering adding stablecoin flows, derivatives funding rates, or halving‑cycle adjustments. Suggestions are welcome.
Personal note
I’m a student who enjoys exploring the intersection of macro flows, on‑chain analytics and market psychology. This script is free to use. You can enable or disable each component, adjust weights, change the display mode and lookback, and select individual ETF tickers. If it brings you value, feel free to follow my work or reach out with feedback. I appreciate your support. Please remember that this indicator is for educational purposes and not investment advice. I built this indicator in addition to my Liquidity indicator, where I use Global M2, the yield curve, and the high-yield spread to define risk-on/risk-off regimes. If you are interested, you can find it here:
References
CryptoQuant Team. (2024). Exchange in/outflow and netflow user guide.
Fosque, J. (2025). Bitcoin ETFs pull $17.8 billion in 90 days as price surges past $118 K. The Digital Chamber.
IntoTheBlock. (2022). Large holders inflow indicator description.
Singh, O. (2024). Crypto exchange inflows and outflows explained: What they reveal about market trends. CCN.
Wright, L. (2025). Bitcoin ETFs to lock up 1.5 million BTC by New Year as supply squeeze tightens grip. CryptoSlate.
Signalgo Strategy ISignalgo Strategy I: Technical Overview
Signalgo Strategy I is a systematically engineered TradingView strategy script designed to automate, test, and manage trend-following trades using multi-timeframe price/volume logic, volatility-based targets, and multi-layered exit management. This summary covers its operational structure, user inputs, entry and exit methodology, unique technical features, and practical application.
Core Logic and Workflow
Multi-Timeframe Data Synthesis
User-Defined Timeframe: The user chooses a timeframe (e.g., 1H, 4H, 1D, etc.), on which all strategy signals are based.
Cross-Timeframe Inputs: The strategy imports closing price, volume, and Average True Range (ATR) for the selected interval, independently from the chart’s native timeframe, enabling robust multi-timeframe analysis.
Price Change & Volume Ratio: It calculates the percent change of price per bar and computes a volume ratio by comparing current volume to its 20-bar moving average—enabling detection of true “event” moves vs. normal market noise.
Hype Filtering
Anti-Hype Mechanism: An entry is automatically filtered out if abnormal high volume occurs without corresponding price movement, commonly observed during manipulation or announcement periods. This helps isolate genuine market-driven momentum.
User Inputs
Select Timeframe: Choose which interval drives signal generation.
Backtest Start Date: Specify from which date historical signals are included in the strategy (for precise backtests).
Take-Profit/Stop-Loss Configuration: Internally, risk levels are set as multiples of ATR and allow for three discrete profit targets.
Entry Logic
Trade Signal Criteria:
Price change magnitude in the current bar must exceed a fixed sensitivity threshold.
Volume for the bar must be significantly elevated compared to average, indicating meaningful participation.
Anti-hype check must not be triggered.
Bullish/Bearish Determination: If all conditions are met and price change direction is positive, a long signal triggers. If negative, a short signal triggers.
Signal Debouncing: Ensures a signal triggers only when a new condition emerges, avoiding duplicate entries on flat or choppy bars.
State Management: The script tracks whether an active long or short is open to avoid overlapping entries and to facilitate clean reversals.
Exit Strategy
Take-Profits: Three distinct profit targets (TP1, TP2, TP3) are calculated as fixed multiples of the ATR-based stop loss, adapting dynamically to volatility.
Reversals: If a buy signal appears while a short is open (or vice versa), the existing trade is closed and reversed in a single step.
Time-Based Exit: If, 49 bars after entry, the trade is in-profit but hasn’t reached TP1, it exits to avoid stagnation risk.
Adverse Move Exit: The position is force-closed if it suffers a 10% reversal from entry, acting as a catastrophic stop.
Visual Feedback: Each TP/SL/exit is plotted as a clear, color-coded line on the chart; no hidden logic is used.
Alerts: Built-in TradingView alert conditions allow automated notification for both entries and strategic exits.
Distinguishing Features vs. Traditional MA Strategies
Event-Based, Not Just Slope-Based: While classic moving average strategies enter trades on MA crossovers or slope changes, Signalgo Strategy I demands high-magnitude price and volume confirmation on the chosen timeframe.
Volume Filtering: Very few MA strategies independently filter for meaningful volume spikes.
Real Market Event Focus: The anti-hype filter differentiates organic market trends from manipulated “high-volume, no-move” sessions.
Three-Layer Exit Logic: Instead of a single trailing stop or fixed RR, this script manages three profit targets, time-based closures, and hard adverse thresholds.
Multi-Timeframe, Not Chart-Dependent: The “main” analytical interval can be set independently from the current chart, allowing for in-depth cross-timeframe backtests and system runs.
Reversal Handling: Automatic handling of signal reversals closes and flips positions precisely, reducing slippage and manual error.
Persistent State Tracking: Maintains variables tracking entry price, trade status, and target/stop levels independently of chart context.
Trading Application
Strategy Sandbox: Designed for robust backtesting, allowing users to simulate performance across historical data for any major asset or interval.
Active Risk Management: Trades are consistently managed for both fixed interval “stall” and significant loss, not just via trailing stops or fixed-day closes.
Alert Driven: Can power algorithmic trading bots or notify discretionary traders the moment a qualifying market event occurs.

Dual Custom Index with SpreadDual Custom Index with Spread
Create powerful custom indices from any instruments and analyze their relative strength dynamics
Overview
This advanced indicator allows you to build two completely customizable indices from your choice of instruments and analyze their spread relationship. Perfect for inter-market analysis, sector rotation strategies, currency strength comparisons, and sophisticated relative performance studies.
Key Features
🔧 Fully Customizable Index Construction
Build each index from up to 6 instruments with individual weightings
Enable/disable instruments on the fly without losing settings
Automatic weight validation ensures mathematically accurate calculations
Invert functionality for instruments that move opposite to index strength
📊 Advanced ADX-Based Methodology
Uses sophisticated ADX +DI/-DI directional bias calculations
Normalized bias calculation for consistent scaling across different instruments
Optimized default settings for intraday trading with full customization options
Professional-grade smoothing and filtering options
📈 Dual Analysis Modes
Difference Mode: Shows absolute strength difference (Index1 - Index2)
Ratio Mode: Shows relative performance ratio (Index1 / Index2)
Additional spread smoothing for cleaner signals
🎨 Professional Display Options
Custom labels with full color, size, and positioning control
Dynamic "Follow Line" labels that move with your data
Static corner positioning for reference displays
Clean error messaging and validation feedback
Use Cases
Gold Trading: Create gold strength vs USD strength indices for precise market timing
Sector Analysis: Compare technology vs financial sector strength for rotation strategies
Currency Strength: Build custom currency baskets for advanced forex analysis
Commodity Spreads: Analyze relative strength between different commodity groups
Regional Markets: Compare strength between different geographical market indices
Crypto Analysis: Track relative performance between different cryptocurrency sectors
Technical Specifications
Instruments per Index: Up to 6 with individual enable/disable
Weight Validation: Automatic 100% total weight enforcement
Calculation Method: ADX-based directional bias with trend strength weighting
Smoothing Options: Multiple levels of customizable smoothing
Error Handling: Professional validation with clear user feedback
Optimization Tips
Intraday Trading: Use DI Length 3-7 for faster response
Daily Analysis: Use DI Length 10-14 for smoother signals
Noisy Markets: Increase Final Smoothing for cleaner signals
Trending Markets: Lower smoothing values for faster reaction
Perfect for traders who need sophisticated inter-market analysis tools beyond standard indicators. Whether you're analyzing gold vs dollar dynamics, sector rotation opportunities, or custom currency strength relationships, this indicator provides institutional-grade analysis capabilities with complete customization flexibility.
