HISTORY AND CREDITS Used by John Carter in his indicator’s toolbox. The ATR channels or the Keltner Channels represent the railroads or the natural movement of stocks. WHAT IT DOES Movements between the the The first multiplier lines (white) represent standard movement for the timeframe you are trading. Movements between the second multiplier (green/red...
This is zigzag based double top/bottom indicator. Code is same as : Double-Top-Bottom-Ultimate But, republishing it to make it available open source. Double Top: Recognition - Checks on Zigzag if LH is followed by HH Confirmation - When low crosses under last lower pivot point on zigzag Invalidation - When high crosses over HH Double Bottom: ...
I may not be able to spend much time on the harmonic patterns and realized that there are not much open source scripts on them either. Hence, decided to release open source version which can be used by other developers for reference and build things on top of it. Original script is protected and can be found here: Logical ratios of patterns are coded as below:...
Here is an attempt to identify double top/bottom based on pivot high/lows. Logic is simple. Double Bottom: Last two pivot High Lows make W shape Last Pivot Low is higher than previous Last Pivot Low. Last Pivot High is lower than previous last Pivot High. Price has not gone below Last Pivot Low Price breaks out of last Pivot High to complete W...
This tool is used to draw wedges. Traders can choose which pivot points to draw lines from in settings. Wedge Maker does not automatically detect current wedge and is required to be tweaked in settings.
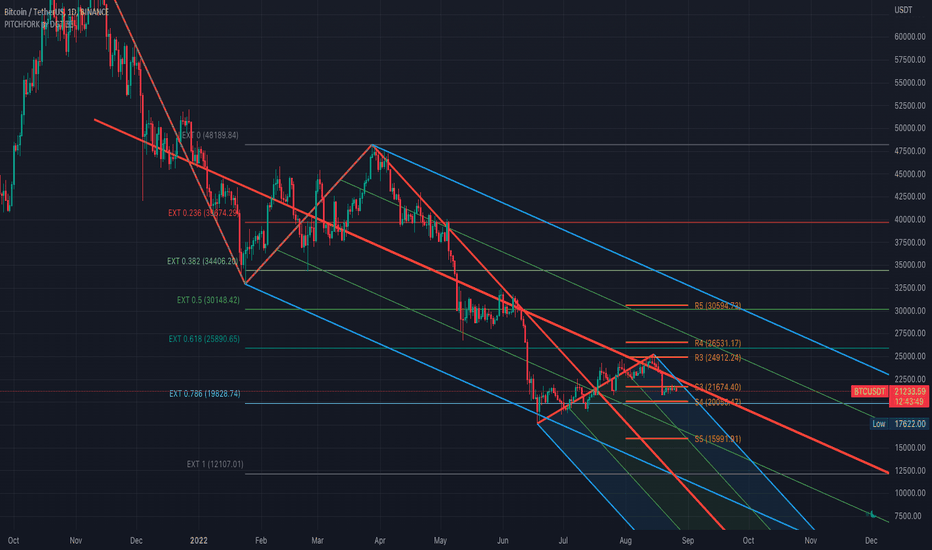
Aᴜᴛᴏ PɪᴛᴄʜFᴀɴ, Fɪʙ Exᴛᴇɴꜱɪᴏɴ/Rᴇᴛʀᴀᴄᴇᴍᴇɴᴛ ᴀɴᴅ ZɪɢZᴀɢ This study aim to automate PitchFan drawing tool and combines it with Fibonacci Extentions/Retracements and ZigZag. Common setting options, applied to all components of the study Deviation , is a multiplier that affects how much the price should deviate from the previous pivot in order for the bar to...
Combination of RSI and EMAs, useful in predicting momentum switches and defining overbought/oversold conditions on all time frames.
Pitchfork is a technical indicator for a quick and easy way for traders to identify possible levels of support and resistance of an asset's price. It is presents and based on the idea that the market is geometric and cyclical in nature Developed by Alan Andrews, so sometimes called Andrews’ Pitchfork It is created by placing three points at the end of...
This script looks for two entry signals. Long is when the previous breakout of the donchian channels was a low, price is above the input EMA, current price is equal or higher than the upper band and we're not in a position yet. Short is the other way around, so previous breakout of the donchian channels was a high, price is below the input EMA, current price is...
Release Note: This indicator setup highly inspired by Donchian Channel and Hull Moving Average. Big thanks to both Richard Donchian and Alan Hull. Back test and live test it and come to conclusion of how to use this indicator for live trading. 200 HMA: 200 Hull Moving Average plays major role in deciding the right trades using Donchian Channel. As part of...
100/200 EMAs, along with Keltner Bands based off them. Colors correspond to actions you should be ready to take in the area. Use to set macro mindset. Uses the security function to display only the 1D values. Red= Bad Orange = Not as Bad, but still Bad. Yellow = Warning, might also be Bad. Purple = Dip a toe in. Blue = Give it a shot but have a little...
Return a linear regression channel with a window size within the range (min, max) such that the R-squared is maximized, this allows a better estimate of an underlying linear trend, a better detection of significant historical supports and resistance points, and avoid finding a good window size manually. Settings Min : Minimum window size value Max :...
Fit a line at successive intervals, where the interval period is determined by a user-selected time frame, this allows the user to have an estimate of the intrinsic trend within various intervals. Settings Timeframe : Determine the period of the interval, if the timeframe is weekly then a new line will be fit at the start each weeks, by default "Daily" ...
**DESIGNED FOR ES/MES** This script provides an easy visualization of potential reversion zones to take trades back to the intraday midline. A common use would be to enter a position once price reached the outer yellow zones and retreats to either the red zone (for a short toward the midline) or a green zone (for a long back to the midline).
**DESIGNED FOR NQ/MNQ** This script provides an easy visualization of potential reversion zones to take trades back to the intraday midline. A common use would be to enter a position once price reached the outer yellow zones and retreats to either the red zone (for a short toward the midline) or a green zone (for a long back to the midline).
This is written as a system to replace the BB strategy. I think it will work well. It looks pretty stylish. Description / Usage: Adjust the length and multiplier based on your location with Bollinger Bands. The multiplier of 1 provides you with a basic channel with high and low-source EMA (or SMA). And with the 8-day exponential moving average, you can observe...
Introduction The efficient trend-step indicator is a trend indicator that make use of the efficiency ratio in order to adapt to the market trend strength, this indicator originally aimed to remain static during ranging states while fitting the price only when large variations occur. The trend step indicator family unlike most moving averages has a boxy...
EXPERIMENTAL: Half way murrey's lines, gann square inspired auto drawn channel.
![[TTI] ATR channels GOOGL: [TTI] ATR channels](https://s3.tradingview.com/k/kUiAg989_mid.png)


![[RS]Price cage GBPUSD: [RS]Price cage](https://s3.tradingview.com/7/7QqzgJ59_mid.png)
