[BERA] Momentum AvgHey BULAS & BERAS!
Momentum Avg is my new creation.
Simple trend following script using Momentum and Moving Average criterias.
Work with every timeframe. Hope you like ok
GREEN BARS = UPTREND
RED BARS= DOWNTREND
LIKE it because i am a member of bera council ok, like my hard work.
Buy

Pro Ribbon Multi MAPro Ribbon Multi MA
- A simple way to see the movements of several MA
- Ribbon of many types of MA: sma , ema , dema , smma , hull, etc
- Trend Color
- Custom Period of 10 MA

Simple TrendSimple Trend
- Show levels to continue on Trend
- Trend Indicator for Long and Short entries
- It can be used as a trend indicator or as a trailing stop loss
- Long and Short Labels and Alerts
- Configurable in Periods and the type of MA for the calculation

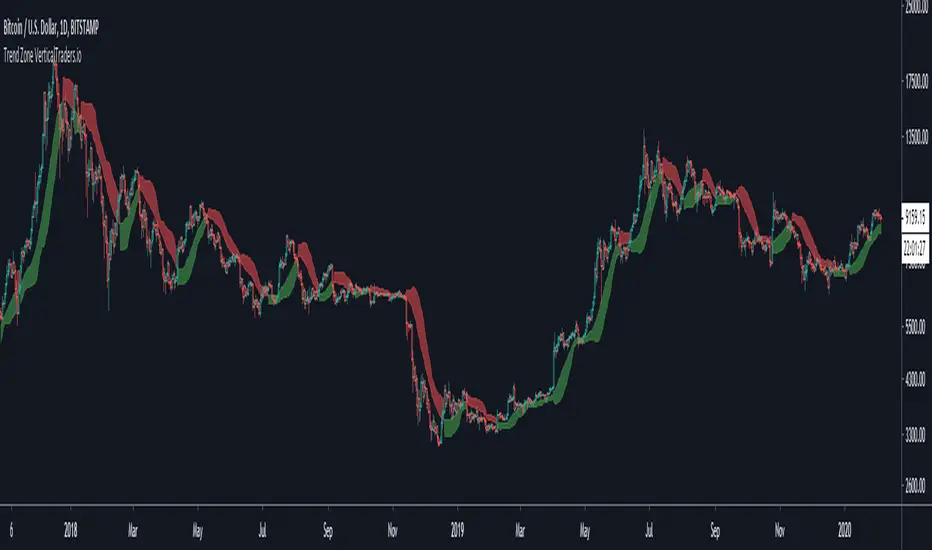
Trend ZoneTrend Zone
- Shows the risk areas to continue in a trend
- Trend Indicator for Long and Short entries
- It can be used as a trend indicator or as a trailing stop loss
- Long and Short Labels and Alerts
- Configurable in Periods and the type of MA for the calculation
Trend ProTrend Pro
- Trend Indicator for Long and Short entries
- It can be used as a trend indicator or as a trailing stop loss
- Long and Short Labels and Alerts
- Configurable in volatility values and periods

Scalping BerkinAlex 1
--------Inglés---------
Updated to Pine Script v4. 👌
Added labels (indicators) of Purchase and Sale according to moving averages for scalping and intraday. 🤑
Fusion of the "Scalping BerkinAlex 3" indicator with the "Scalping BerkinAlex 1", so as not to occupy a slot of indicators unnecessarily if you have a free account. 😜
Alert system designed, now you can create an alert in free mode according to the possibility of buying or selling an asset.🔔
Errors found fixed.💪
---------Español---------
Actualizado a Pine Script v4. 👌
Añadidas etiquetas (indicadores) de Compra y Venta según medias móviles para scalping e intradía. 🤑
Fusión del indicador "Scalping BerkinAlex 3" con el "Scalping BerkinAlex 1", para así no ocupar un slot de indicadores innecesariamente en caso de disponer cuenta gratuita. 😜
Sistema de alertas diseñado, ahora podrás crear una alerta en modo gratuito según exista la posibilidad de comprar o vender un activo.🔔
Errores encontrados solucionados.💪

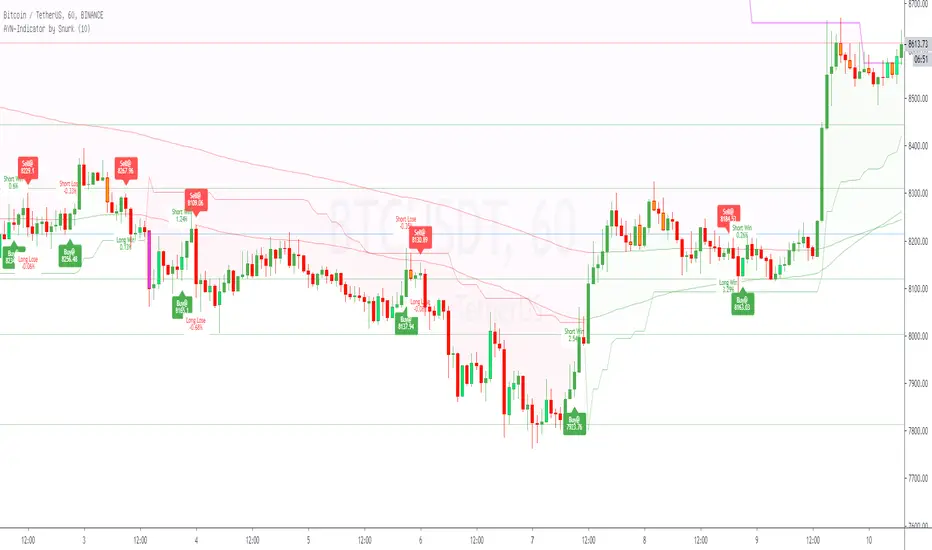
AYN: Buy-, Sell-, Trend- and SwingSignals incl. AutoFibo
Hi,
i want to introduce you to my AllYouNeed-Indicator. I calculate the buy sell signals within different timeframes independent in wich timeframe you are, therefore Pinescript suppose the Signal could be repainted. I was not able to fix this error, but after frequent checks of the result i haven't found a single repaint. Please try it out and let me know me, if you still get caught by a repaint.
Features:
- Short, Mid and Longterm-Trends
- Buy and Sell Signals and Results as well with Labels (Prices, Percentage, Win/Lose)
- Length Multiplier for different Marketsituations
- Trend-Signals with Barcolors (Lime=Uptrend, Fuchsia=Downtrend)
- Swing-Signals with Barcolors (Lime=Upswing, Orange=Downswing)
- Auto-Fibonacci with changing Linecolors as Support(green) / Resistance(red)
Hope you like it, feel free to contact me for further informations.
Please leave a comment on what I can do better, thanks.
Best regards,
snurk
EURUSD 5 Minute Binary Strategy by Emiliano Mesa 73% Win RatioEURUSD Binary Strategy 73% Win Ratio.
-----Free 5 Day Trial-----
¿How it works?
This is a binary indicator, meaning it may be only
used for EURUSD options. Its use is simple:
1) Wait for the blue background to appear, this
means a possible trade may be upcoming
2) Wait for the purple background to appear, this
is our entry. And enter in the suggested direction
by the arrows after the close of the bar
3) Establish your expiration bar the # of
bars missing in the white area (which are 3 bars
per area) + 1 bar of the yellow area
for instance:
- Each background color both blue and yellow, have
the same ammount of bars in between (3), and so
does the white space between them, each bar is 5
minutes. In this case we are given an entry 1 bar
later, so 5 miutes inside our whitespace. Saying
so there are 2 bars left inside our white area, plus
one yellow bar, which means our expiration time
is 15 minutes since Entry to exit!
Wohooo! PROFIT!
Go ahead and send me a PRIVATE MESSAGE or EMAIL
if you are intrested in trying my Binary Strategy FREE
for 5 DAYS!
¿WANT ALERTS?
If you purchase the EURUSD Binary Strategy
Ill add up the EURUSD Binary Indicator! For you
not to miss a trade!
-----------------------
Contact:
emilianomesauribe2000@live.com

[BERA] SUper BOSSHey beras and bulas, this is another gift for you! work in sync with KNIFE CUT script
Please message me if you like my indicators. Thanks you.
This indicator work in sync with KNIFE CUT, check it.
SUper BOSS
Is a special indicator with 2 metrics you can use for be a better trade and stop losing money entering useless positions.
using also KNIFE CUT you will get up to 4 parameters you can compare, for enter only good trades.
This indicator can:
Supports and resistances area as point of reference.
OverBought, Oversold candles
Green line is a LONG, Red line is a SHORT.
4H example, work with all timeframes also for excellent 15m scalping.
SEE? many opportunities.
Tried this with 15m timeframe trading ALGO MOON or DOOM and the result is incredible.
With SUper BOSS and KNIFE CUT, you will earn money in any timeframe!
I may find 15 trades a day with this system.
See price history.
You not believe? i believe.


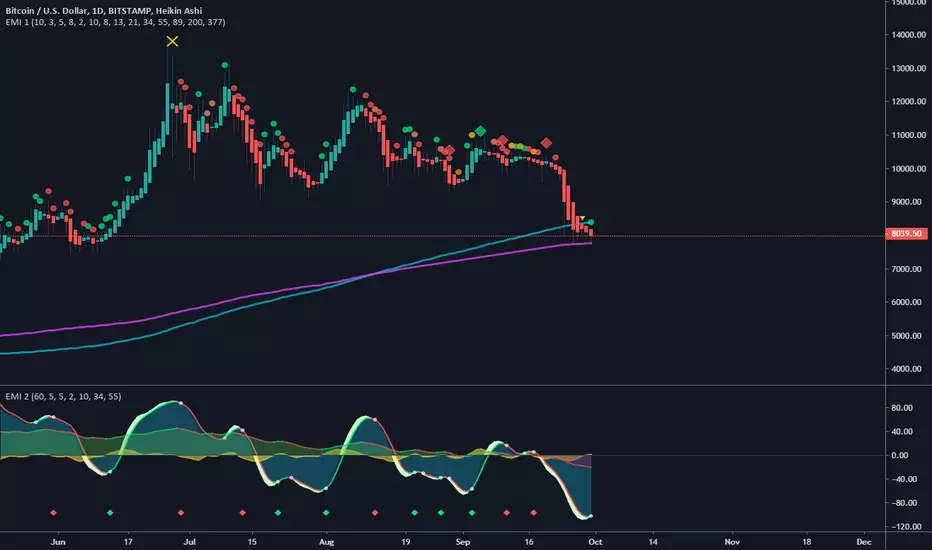
(EMI 1) Epic Market Indicator v2.2Had to release a new version, due to house rules.
This indicator is usable for every market and I do suggest to use it in combination with EMI 2.
Green = buy/long, Red = sell/short
Orange = Price action divergence/convergence.
Yellow X = Manipulation, you might to be careful when you see this, most of the time dumps happens afterwards.
Always wait for the candle/bar to close and if possible wait for another confirmation. No confirmation most of the time means, trend continuation.
Diamonds are the strongest signal, you might want to to buy/long or sell/short when you see this signals.
Cirles/Dots are trend continuation, shows which way the trend. More of the same color in a row the stronger the prediction. But once you see an orange colored signal then it's possibly going to diverge.
Longer the term/period the more accurate prediction signals will be.
You can enable/disable other tools in the settings:
EMA's, SMA , Bollinger Bands and Pivots .
But also trend colors
Setup your own configurations the way you like. I recommend using Fibonacci seq . Keep in mind, sooner the prediction signals become the more riskier.
update:
- Added bollinger bands with trend color. You can disable or enable this in the settings.
- Modified manipulation conditions.
- Modified buy and sell conditions.

AlgoNinja RSI/MACDAlgoNinja buy/sell signal based on MADC/RSI/StochRSI data. BETA - Use at your own risk!

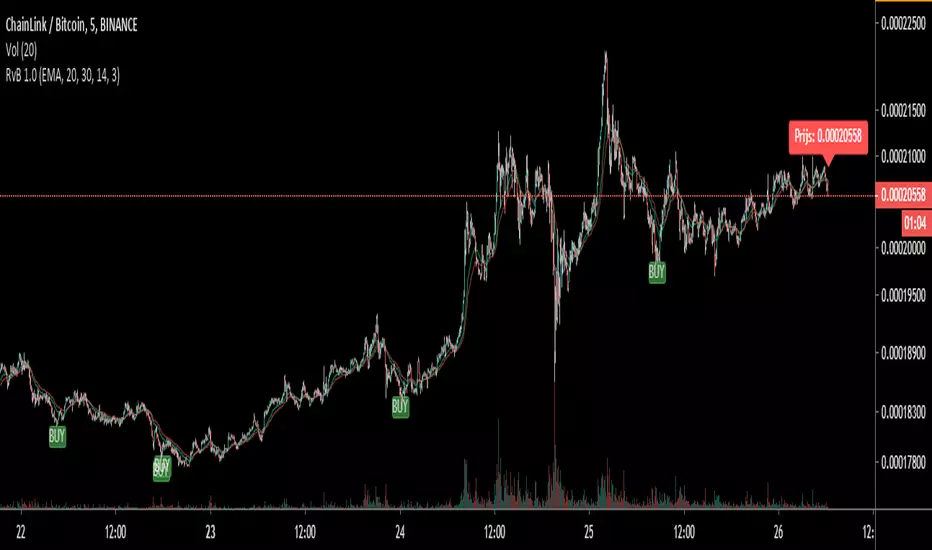
BUY SIGNALS (R-V-B)BUY SIGNALS
Get free buy signals that help you make a choice to step in. This is meant to quickly book small profits between 0.75% and 1%. Keep a close eye on the BTC at all times, take a good look at the history of the coin to see how the buy signals went. Good luck!
This module does not give you a guarantee that you will always make a profit, so it can also happen that it is not always successful. possibly also analyze the coin, be careful at all times. Happy trading!
Buy and Sell Indicator - OnePunchOne of the Top Class Breakout, Buy and Sell Strategy for Long Term, Day Traders and Short Term Holder.
With This Script;
You Can Get Breakout Signals
You Can Get Buying Points
You Can Get Selling Points
You Can Find Out If a Stock Over Sold
You Can Find Out If a Stock Over Bought

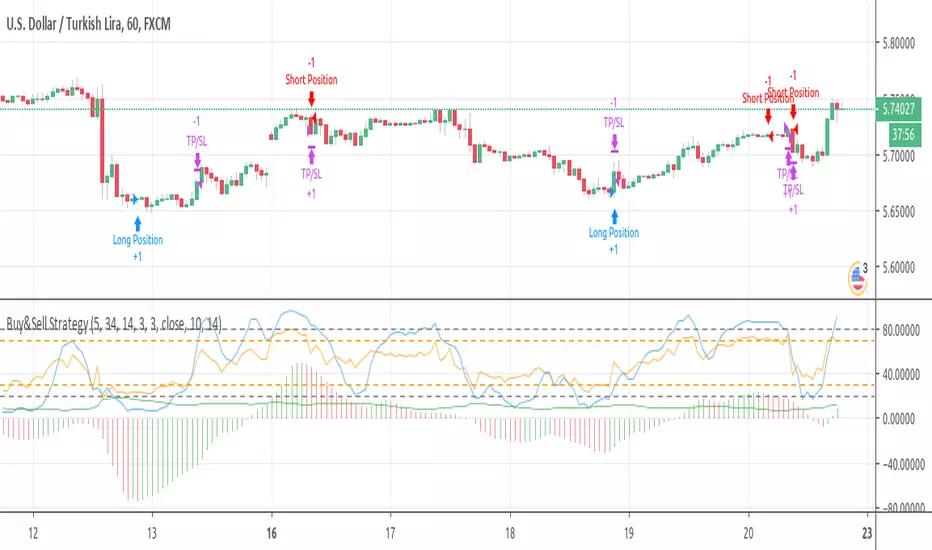
Buy&Sell Strategy depends on AO+Stoch+RSI+ATR by SerdarYILMAZThis strategy is just for training, its purpose is just learning code in pine script.
Don't make buy or sell decision with this strategy.
Turkish/Turkce
Bu strateji sadece pine script'te kodlamanın nasıl yapildigini ogrenmek icindir.
Bu stratejiye dayanarak, kesinlikle al-sat islemleri yapmayin.
How it works?
When RSI and Stoch are in oversold area and if awesome osc. turns positive, take long position. Stop loss and take profit levels were defined with ATR ind.
When RSI and Stoch are in overbought are and if awesome osc. turns negative, take short position. Stop loss and take profit levels were defined with ATR ind.
Turkish/Turkce
RSI ve Stoch asiri satım bölgesinde iken awesome pozitife döner ise long pozisyon açar, zarar kes ve kar al seviyeleri ATR indikatoru ile tanımlandı.
RSI ve Stoch asırı alım bölgesinde iken awesome negatife döner ise short pozisyon açar, zarar kes ve kar al seviyeleri ATR indikatoru ile tanımlandı.
Buy NyzoHere's something I've been working on. If anyone wants to give it a go, go for it. Signals themselves made by me, the basis of this shit is all written by others (none of who I know personally so suck it). The signals print after candle close
Obviously not finished so couple it with other stuff, if you find it useful coupled with something else then lmk

[astropark] Long-Short Strategy V2 [alarms]This indicator is not an holy grail, but it is an amazing trend finder and works nicely between 30m and 4h timeframes :)))
This is a modified version of the following strategy:
After the great success of V2, as a lot of people around asked me about, I decided to publish a new version which will let you set alarms on Buy and Sell , so each time a signal is triggered you will be notified accordingly and FAST!
HOW TO USE THIS INDICATOR
Buy/Long at next candle's open price when you see a green "B" label on the chart , trying to buy as low as possible near or below the green cloud, considering it as moving support for more buys/longs. The bigger the cloud, the stronger the bull-trend and so the stronger the support.
Sell/Short at next candle's open price when you see a red "S" label on the screen , trying to sell as high as possible near or over the red cloud, considering it as moving resistance for more sells/shorts. The bigger the cloud, the stronger the bear-trend and so the stronger the resistance.
Keep in mind that the lower the timeframe you work on, the easier is the trend to change rapidly, so always set a -2% / -5% stop-loss on trades and follow the trend with a good trailing stop strategy . If you need help, just send me a direct message.
This is not a free indicator, so send me a private message in order to get access to this script .
Do you like my scripts? Offer me a coffee, a beer, a pizza or whatever :)
BTC jar: 1K5kuYQPEqoNo6GRmJbHWMPmqwKM5S3oRR
ETH jar: 0x091b541a6dd6fe08c4e7bd909baafb2fce9b975e
LTC jar: LSVoAChsZrVsvbNyUfdpxtFpDAUSaUTUig
XRP jar: (XRP deposit tag) 103997763 (XRP deposit address) rEb8TK3gBgk5auZkwc6sHnwrGVJH8DuaLh
PS: Do you need a customization or do you need a dev who implements your strategy? send me a private message ;-)

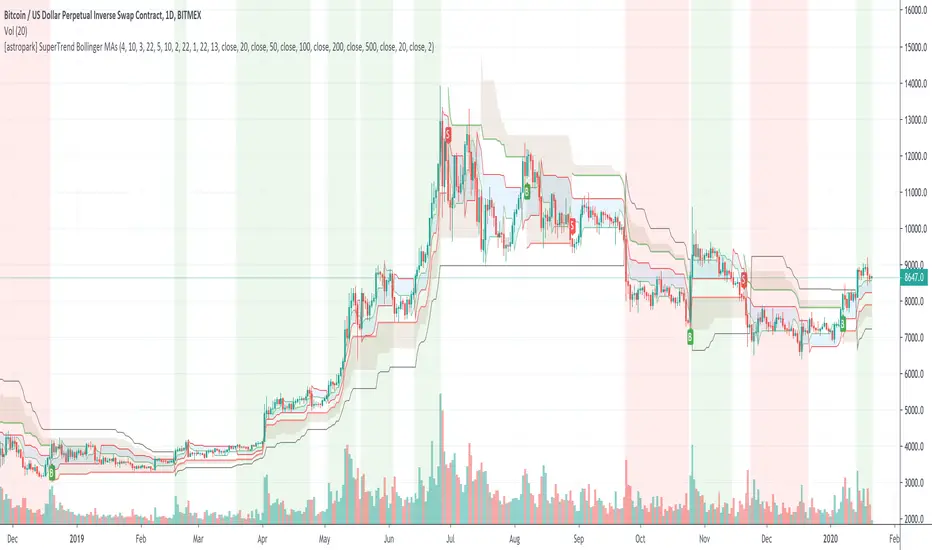
[astropark] SuperTrend Bollinger MAsHi Followers,
here it is a new script, based on SuperTrend indicator!
As plus you will be able to activate Bollinger Bands and 6 simple moving averages.
What's the SuperTrend?
As you can see from the chart, the SuperTrend Indicator
defines moving support & resistance levels for price action with its clouds and trendlines
catches trend changes when black line (the Slow SuperTrend) switches from staying upper price action to down and viceversa
shows you on background bearish momentum in red
shows you on background bullish momentum in green
This is not a free indicator, so send me a private message in order to get access to this script.
Do you like my scripts? Offer me a coffee, a beer, a pizza or whatever :)
BTC jar: 1K5kuYQPEqoNo6GRmJbHWMPmqwKM5S3oRR
ETH jar: 0x091b541a6dd6fe08c4e7bd909baafb2fce9b975e
LTC jar: LSVoAChsZrVsvbNyUfdpxtFpDAUSaUTUig
XRP jar: (XRP deposit tag) 103997763 (XRP deposit address) rEb8TK3gBgk5auZkwc6sHnwrGVJH8DuaLh
PS: Do you need a customization or do you need a dev who implements your strategy? send me a private message ;-)

RYNO
Welcome to RYNO! One of the best all-around indicators that you will find. RYNO is capable of being used on any chart. From the 1m, 3m, 5m time frames all the way up to the D chart. Heikin Ashi candles are preferred for the most accurate signals.
BUY/SELL signals represent your move... it's up to you to pull the trigger. Set your alerts and automate this indicator.
Back tester is also available by request.

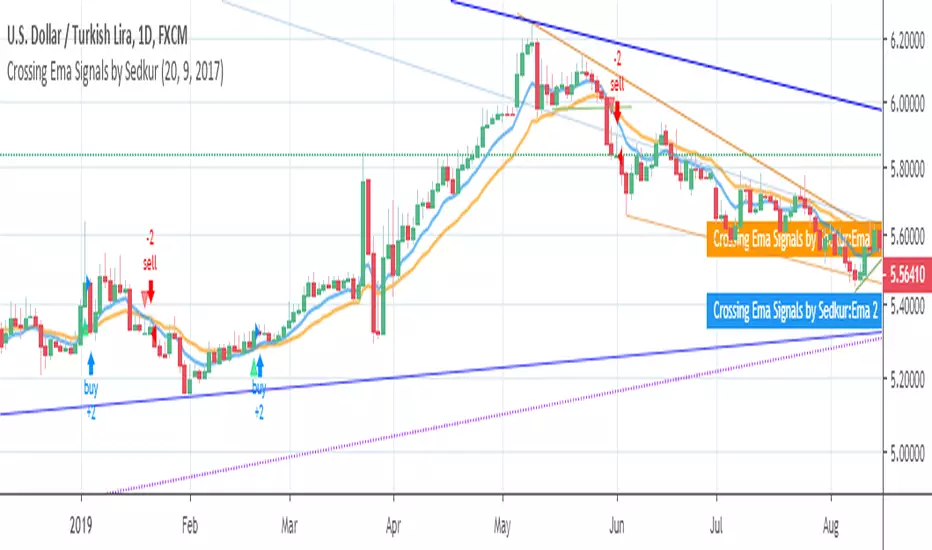
Crossing Ema Signals by SedkurGives an signals when 2 Ema's cross.
You can
- change EMA values
- change the signal start year