Bitcoin Binance Sentiment IndexThe divergence of the price between the futures and spot markets for perpetual contracts could be a gauge of sentiment on a traded cryptoasset.
Sentiment analysis could be used to improve the the predictive value of technical and fundamental analysis.
The price of the perpetual contract is divided by the spot price for Bitcoin on Binance and two simple moving averages of this ratio are plotted together. For graphical purposes, the ratio between the two prices has been multiplied by 100. The moving averages were chosen arbitrarily and can be changed. Values above 100 mean that the average price of the futures over the last x periods was above the spot price over the same period. Conversely, values below 100 mean that the mean price of the futures over the last x periods was below the spot price over the same period. The indicator has been created for a daily timeframe.
This indicator is clearly intended for educational purposes only and does not constitute investment advice.
If you are interested in updates on this indicator or interested on sentiment analysis, put a like, subscribe or contact me in pm.
BIO
BTCUSDT

GBTC Fomo Panic PremiumIt is rumored that GBTC price action leads the Bitcoin market. This indicator compares GBTC fomo/panic levels to the (Binance) BTC spot market. Fomo is measured as large percentage moves of the high price from the min over a look-back period. Panic is measured as large percentage moves of the low price from the max over a look-back period. A prime example of this indicator's usage would be as a sell signal confirmation during the 2020 pre-Thanksgiving panic exhibited on the 1-hour chart while the 20 EMA was still above the 99 SMA.
You can customize the leading and lagging markets and the length of the lookback period. I would love to hear what parameters, markets and timeframes work for you. Maybe there is a way to leave comments, or hit me up on Twitter: @thirdreplicator
May you profit and enjoy.

BITCOIN Miners Revenue VS Price Correlation OscillatorUse 3D(3-day candle) as timeframe for best reading.
------
original template for Correlation indicator was created by obaranova. credit goes to her.

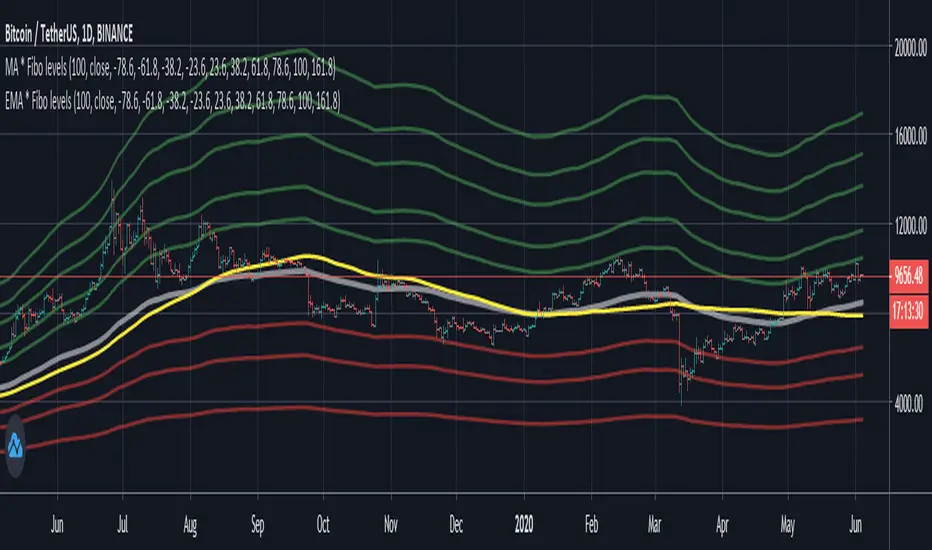
[2020 Updated]Bitcoin Logarithmic Growth CurvesCredit goes to the original writer of the script, Quantadelic, who generously allowed anyone to copy/edit. I adjusted the value of the bottom/top intercept and slope to better fit the March 2020 coronavirus dip.
Use Bitstamp BTCUSD for better reading.


MA * Fibo levels (canal)Some updates to the scrypt "MA * Fibo levels (auto)"
In the previous scrypt we drew lines using either highs or lows of the candles due to the positiveness or negativeness of given percentages.
But, after some research it seems easier to use CANALS to buy or sell rather than LINES. So these canals are the intervals between SMA(highs) and SMA(lows) multiplied by FIBO coefficients. However, lines can be also used as stop-losses if the price goes out of the canal, and wait until the price reaches the other canal.
Good luck in trading!
If the scrypt was useful let me know!
Any feedbacks and ideas are welcomed!

Stoploss indicatorGood for setting trailing stops and stoplosses when your taking a scalp etc, most recommended for manual trailing stops
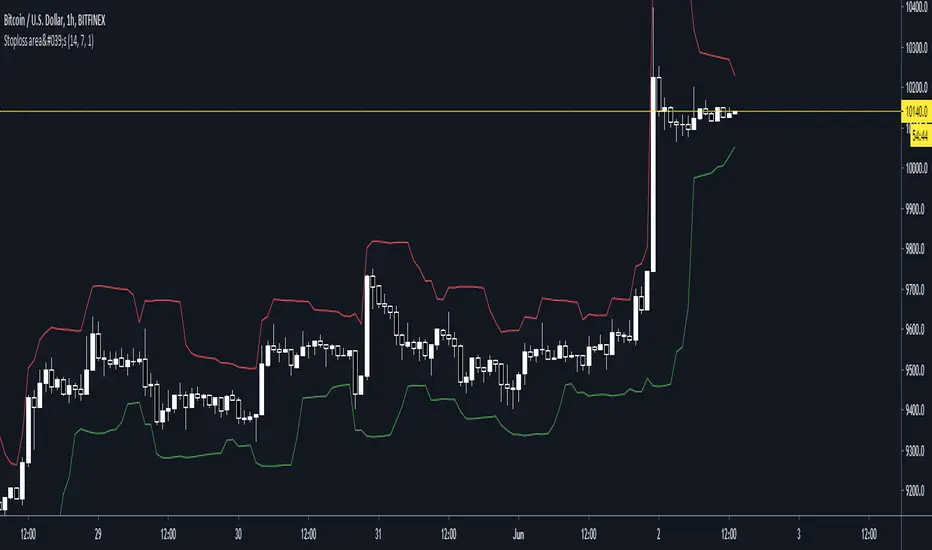
Simple EMA trend indicatorSimple EMA trend indicator , pretty straightforward green equates to bullish and usually a retest/wick is often seen , same for the flipside viceversa


MA * Fibo levels (auto)A few updates to the previous post.
In order to catch more exact points of TP and SL, the scrypt takes "high" as the source of SMA if the percentage is greater than 0 ( > 0), and "low" as the source when the given percentage is less than 0 ( < 0).
So there are two basic SMA line ( one with "high", the other one with "low"), and the other lines would be results of multiplying either the higher base or the lower one.
Good luck in trading!
If the scrypt was useful let me know!
Any feedbacks and ideas are welcomed!

Ichimoku Clouds Strong Bullish/Bearish signals and alertsIchimoku Clouds Strong Bullish/Bearish signals with allerts
The Ichimoku cloud was developed by Goichi Hosoda, a Japanese journalist, and published in the late 1960s. It provides more data points than the standard candlestick chart. While it seems complicated at first glance, those familiar with how to read the charts often find it easy to understand with well-defined trading signals.
We provide you easy-to-use script which helps to decrypt meaning of lines in the indicator. The script takes Ichimoku clouds indicator formulas to calculate Tenkan, Kijun, SenkouA, SenkouB values and examines them in order to produce buy ( Bullish ) and sell ( Bearish ) signals which are displayed at the chart
The most appropriate time frame is 30m
Custom alerts are added to send you a notice with a webhook when bullish or bearish signal arrives.
You can easily add weak and neutral signals alerts by removing "//" in a specified place
Feel free to copy and use this script for your ideas and trading. You can modify the script by adding Parabolic SAR in order to increase accuracy of positions closure

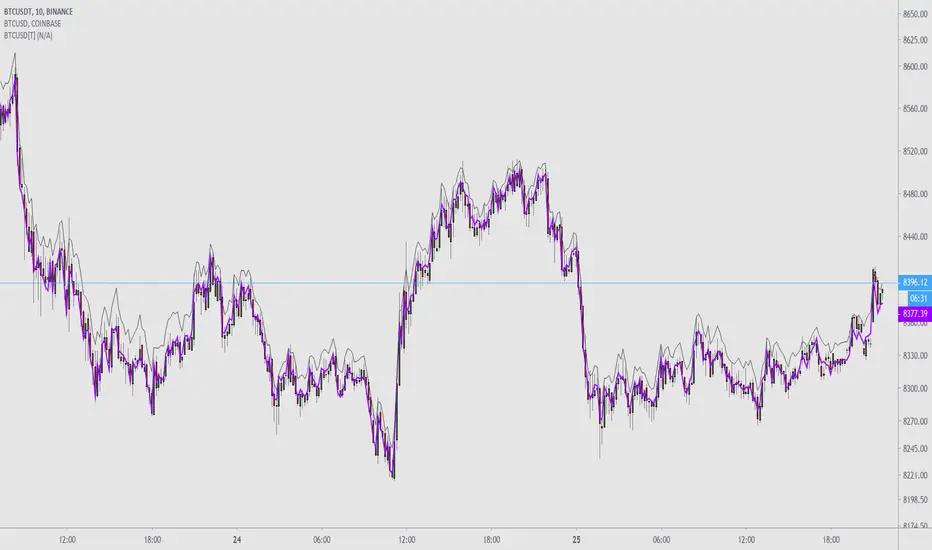
Binance BTCUSDT Tether AdjustedThis provides a Binance BTCUSDT ticker that is more aligned with spot exchange price.
There is an invisible line added to so it is possible to add indicators like MAs to it. It must be turned on in options to be used.
Possible usecases:
Add it to a Binance chart as a price source but keep real volume
To feel like you have an edge
For an more accurate and liquid representation of spot price
BEST Mayer MultipleHello traders
I'm not a HODLer by any means. I know when to sell (or I think I know....) when an asset starts going against me too much.
Even if it's a "long-term" investment.
My mentor used to telling me this: "If a short-term trade becomes a long-term investment, then you're in for a hell of a ride".
I have no clue if Bitcoin/BTC will go back up or not - I don't even care because I'm an intraday trader.
What if BTC was actually a way to accumulate more fiat? Satoshi fooled us
I coded this Mayer Multiple according to the specifications below. By the way, I'm a big fan of Willy Woo. I've been monitoring all his work since I learned about crypto (10 minutes ago.... it's a joke come on)
charts.woobull.com
Scaling
To respect the Mayer's multiple model, I recommend to select the Logarithmic scaling as shown below
imgur.com
What Mayer's model says
Using the reference below, the model says we're in the oversold zone. But, we can be in that zone for months/years...
When a model says an asset could bounce in a 1000-7000 USD range... well... I don't know how I would be able to perform optimally with that insight. This is very subjective and not a recommendation.
Mayer's Multiple model reference
All the BEST
Dave

QuantNomad - Significant Pivot Reversal Strategy AlertsAlerts for "Significant Pivot Reversal Strategy":
As one of the ways to filter out insignificant levels I decided to check that pivot point is not above/below neighbors, but check that it's above/below at least by a certain amount.
I use ATR, so in params, you can set length of ATR and also ATR multiplier. The new level will be calculated only if PP will be above/below neighbors by atr * atr_mult.
It seems this approach might help in some cases.

Welles Wilder MAHow to trade:
Recommended for longer timeframes at least 4H.
Buy when the green dot appears.
Sell when the yellow dot appears.
Welles Wilder moving average by XOOOOOO

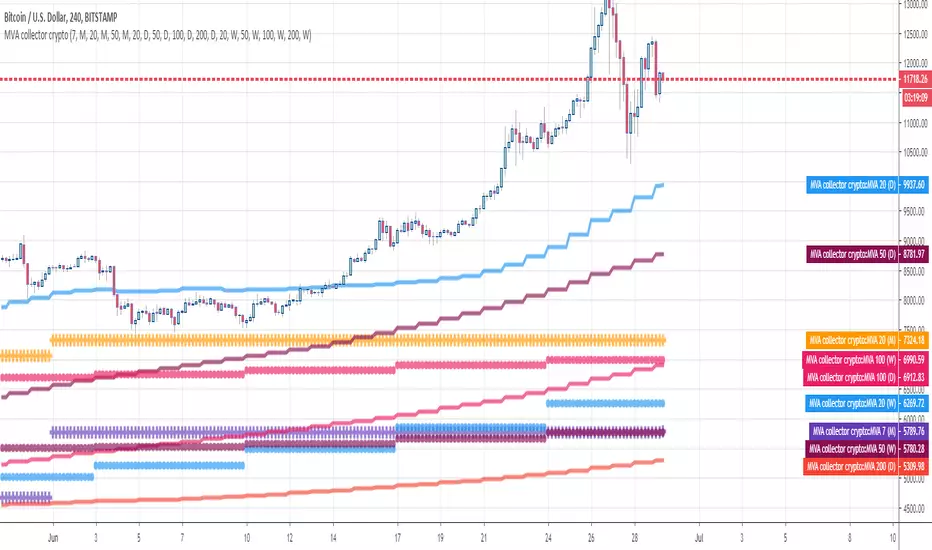
MVA collector cryptoHello Traders
This indicator draw multiple Simple Moving Averages multi-timeframes at once
I use it to define take profit zones for my crypto trading
Hope you'll like it
Enjoy
Dave
Bitcoin Fat Volume IndicatorBitcoin Fat Volume Indicator
The script displays aggregate sums of Bitcoin dollar and Tether market volumes separately as follows:
USD markets (blue): gemini, coinbase, okcoin, kraken, bitfinex, bitstamp, btce, mtgox
Tether markets (orange): huobi, binance, bittrex, poloniex, hitbtc
The indicator should work on all time frames on any chart so long as volume data exists. Obviously for full history use Bitcoin Liquid Index.
The indicator is slow that's why I'm not including other stable coins or fiat markets at present.
Use settings to turn off Tether or USD bars as desired.

Aggregated Volume BTCAggregates the Bitcoin volume from multiple exchanges into a single indicator.
# Exchanges and Pairs
Included are only exchanges supported by TradingView:
* Binance
* Bitstamp
* Bittrex
* Coinbase
* Gemini
* itBit
* Bitfinex
* Kraken
* Poloniex
* HitBTC
* OKCoin
* BitMEX
Excluded low volume exchanges (not in CMC Top):
* CEX.IO
* Coinfloor
Excluded low volume pairs (not in CMC Top):
* KRAKEN:XBTCAD, COINBASE:BTCUSDC, ITBIT:BTCEUR, ITBIT:BTCSGD, BITFINEX:BTCJPY, BITFINEX:BTCGBP, POLONIEX:BTCUSDC, OKCOIN:BTCUSD, OKCOIN:BTCCNY
Many other top exchanges are not included, because they are not supported by TradingView.
# Inputs
By default the spot exchanges are selected. You can select also the other margin trading and derivatives exchanges.
# Contribute
Feel free to share any ideas and issues you have.
# Open Source
The code is open source @ github.com and uses the commonpine library github.com

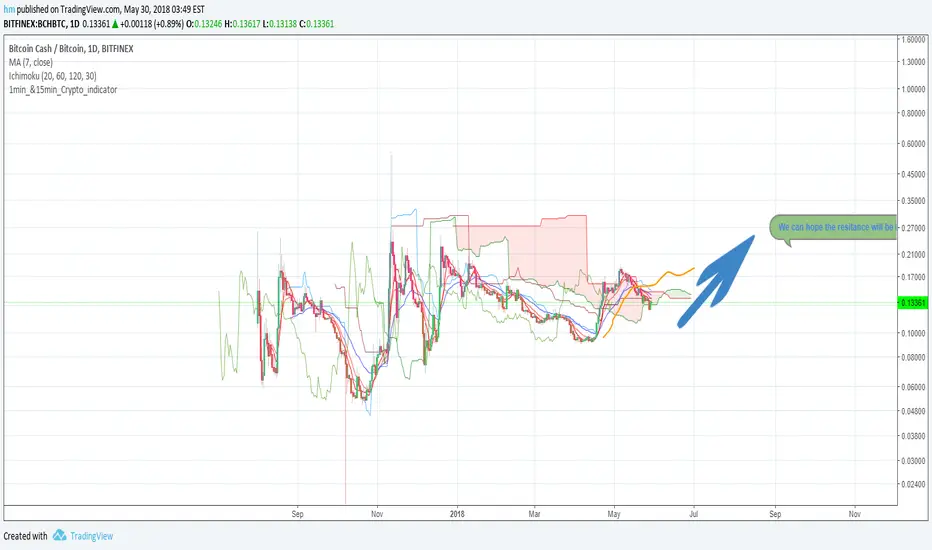
1min_&15min_Crypto_indicatorDear Crypto Community,
on
I set for my thesis a crypto indicator for 15 minutes mostly. It's work at 87 % on BTCUSD & BCH
easy to use:
Green to Short
Purpule to Buy
DepthHouse - Moving Average ChannelsThe indicator Moving Average Channels was created for experimental purposes due to the parabolic moves BTC has made in the recent past.
How it works:
The basis, or center line, is a standard moving average that is set by the user.
The bands are then a customizable percentage of the basis.
Which based on the settings, could serve as possible support and resistance.
DepthHouse – Moving Average Channels has been published for you all to see and try for yourselves.
Maybe this indicator has uses elsewhere? If you find something feel free to post it in the comments below!
If you like this indicator, please drop a like or comment!
They are very much appreciated!
Be sure to go to my profile and check out my other indicators!
