mujahid 786zxhdswidhslkjhibfq jshdsn khdjsn kljsdiyOLFMSLH M JDFHDJFHKFKHALSA KJHDDJFSASHFHASHASHF SFHIGFCJCBUOGFUDAS KJSHDGSC ASDHSIDS I IUSIGSKKDAIHDSIIGSFASKLADHFIHDCKDA SDHIDIHD DHDSUHSIHS OAISDOUADSUIJCDS ISGHFSHCXOCGSDCUAJOSDVApuh8UDHCOIhckxc'dgcugcvcoiuhsddfsk'chsgcou]cuxgcosc
ihcvuhdbkhvuodcbjhgcusoGUYTDUJCBXJNB JGCUGDIsdgcffodsdhfcSIUCH
브레드쓰 인디케이터
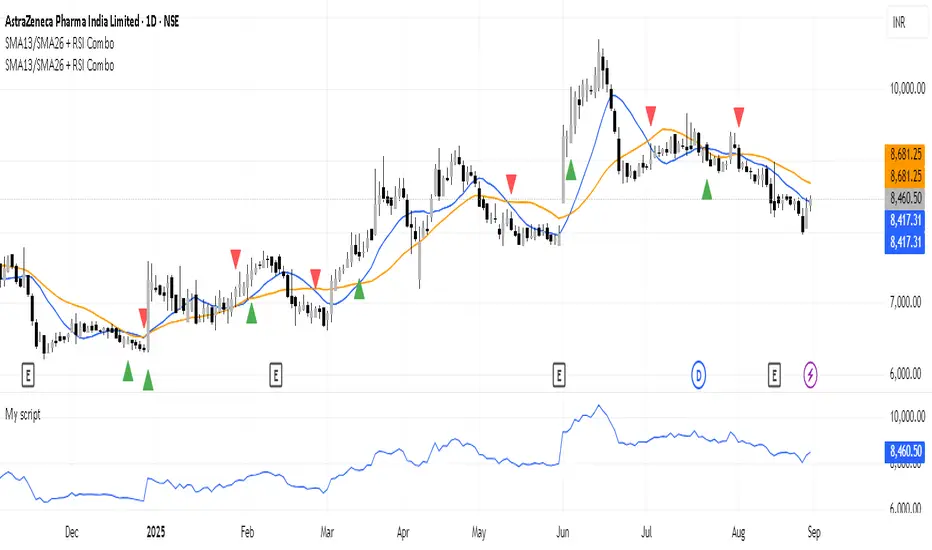
Pullback Confirma**📈 Pullback Strategy with Candle Confirmation**
**🎯 Objective:**
Identify ideal entry points during pullbacks in trends, using the simultaneous crossover of two moving averages with candle confirmation.
**📊 Indicators Used:**
- **Hull Moving Average (HMA):** Period 27 - fast and smoothed average that reduces lag
- **Simple Moving Average (SMA):** Period 11 - short-term average for additional confirmation
**⚡ Strategy Logic:**
**🔹 Conditions for BUY SIGNAL:**
1. **Double Crossover:** Price crosses above both HMA 27 and SMA 11 simultaneously
2. **Pullback:** Price must be near or touching HMA 27 (return-to-average condition)
3. **Confirmation:** On the next candle, it must be a BULLISH candle closing above both averages
**🔸 Conditions for SELL SIGNAL:**
1. **Double Crossover:** Price crosses below both HMA 27 and SMA 11 simultaneously
2. **Pullback:** Price must be near or touching HMA 27
3. **Confirmation:** On the next candle, it must be a BEARISH candle closing below both averages
**🎨 Chart Visualization:**
- **● Blue Circle:** Upward crossover detected (awaiting confirmation)
- **● Orange Circle:** Downward crossover detected (awaiting confirmation)
- **▲ Green Arrow:** Confirmed buy (after confirmation candle)
- **▼ Red Arrow:** Confirmed sell (after confirmation candle)
- **Colored Lines:** HMA (blue) and SMA (orange) plotted on the chart
**⚙️ Customization:**
- Adjustable average periods
- Customizable arrow colors
- Configurable alerts for each confirmed signal
**✅ Advantages:**
- **Double Filter:** Two different averages for confirmation
- **Candle Confirmation:** Eliminates premature signals
- **Intuitive Visual:** Only shows arrows after valid confirmation
- **Controlled Pullback:** Operates only on return-to-average movements
**⏰ Recommended Timeframe:**
Works on multiple timeframes, but particularly effective on M15, H1, and H4 to capture more significant movements.
This strategy is ideal for traders looking for precise entries in consolidated trends, minimizing false signals through candle confirmation! 🚀

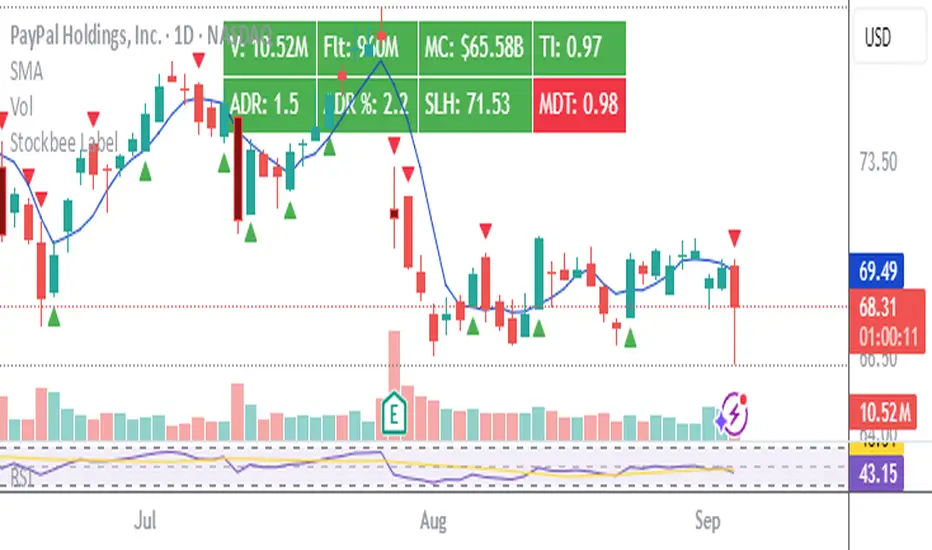
Stockbee LabelUnlock the full potential of your TradingView charts with this powerful indicator designed specifically for Stockbee methods. Instantly gain key market insights at a glance with a sleek, easy-to-read label displayed on your chart. This dynamic label provides critical data including Volume, Total Float, Market Capitalization, Trend Intensity, Average Daily Range (ADR), Half-Day Stop Loss level, and Modified Double Trouble (MDT) .
Elevate your trading strategy with real-time, essential metrics all in one place—streamlining your decision-making and boosting your confidence in the market.
Disclaimer: This indicator is inspired by and built upon the original concepts of Stockbee and EG.
Eureka & Phoenix Thrust — NYSE (90% Breadth Days)🚀Eureka & Phoenix Thrust Indicator (NYSE Breadth)
Overview
This free indicator highlights rare but powerful breadth thrust days on the NYSE that can mark important turning points in the market.
It automatically detects both:
📈 Eureka Thrust (90% Up Day)
– At least 90% of NYSE issues advance and at least 90% of NYSE volume is advancing.
– Often signals broad-based institutional buying and strong market demand.
📉 Phoenix Thrust (90% Down Day)
– At least 90% of NYSE issues decline and at least 90% of NYSE volume is declining.
– Reflects broad institutional selling or panic, sometimes marking capitulation lows.
Both signal types were popularized by Lowry’s Research and O’Neil/IBD market models.
Notes
Eureka Thrusts are bullish confirmation signals, especially when clustered.
Phoenix Thrusts often mark panic selling — bearish in the short term, but can precede market bottoms if followed by Eurekas.
These events are rare. You may need to scroll back in history (e.g., March 2020, 2008, 1987) to see them in action.
Disclaimer
This tool is for educational and informational purposes only.
It is not financial advice. Always do your own research and risk management before making trading or investment decisions.

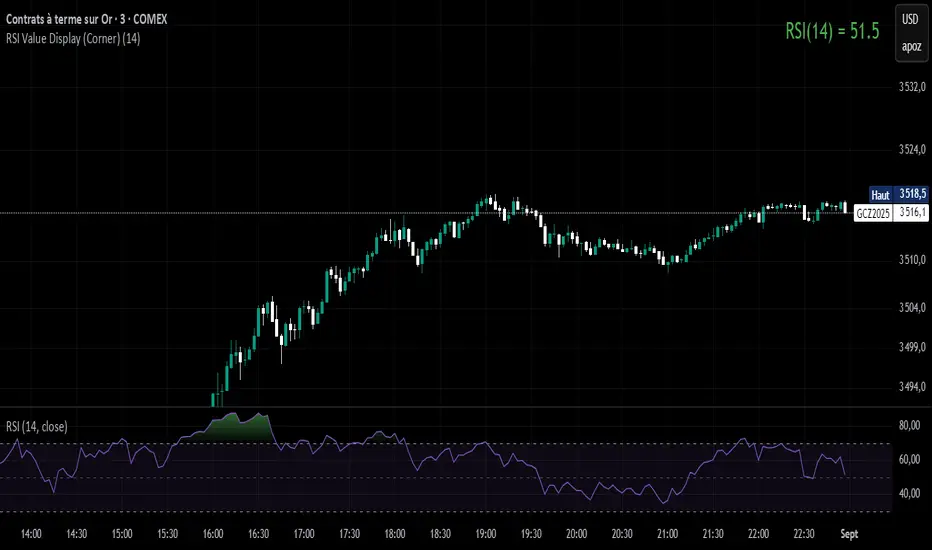
RSI Value Display (Corner)RSI in the right corner (red when is above 70 and below 30 - Green for the rest)
Emre AOI Zonen Daily & Weekly (mit Alerts, max 60 Pips)This TradingView indicator automatically highlights Areas of Interest (AOI) for Forex or other markets on Daily and Weekly timeframes. It identifies zones based on the high and low of the previous period, but only includes zones with a width of 60 pips or less.
Features:
Daily AOI Zones in blue, Weekly AOI Zones in yellow with 20% opacity, so candlesticks remain visible.
Persistent zones: AOI boxes stay on the chart until the price breaks the zone.
Multiple zones: Supports storing multiple Daily and Weekly AOIs simultaneously.
Break Alerts: Sends alerts whenever a Daily or Weekly AOI is broken, helping traders spot key levels in real-time.
Fully automated: No manual drawing needed; zones are updated and extended automatically.
Use Case:
Ideal for traders using a top-down approach, combining Weekly trend analysis with Daily entry signals. Helps identify support/resistance, supply/demand zones, and critical price levels efficiently.

EMAs 20/50/200 with Trend ColoringIt calculates EMA 20, 50, and 200.
For each EMA, it compares the current value with the previous bar (ema > ema ).
If rising → green, if falling → red.
All three EMAs are plotted with different colors dynamically changing by slope.

Futures Rotation Strategy - Overlay (Tables & Signals)This strategy focuses on the laggards and leaders of the market indices and does some weird stuff and determines which to long or short.

Momentum Signals – Real-time (Repainting)This indicator generates real-time BUY/SELL signals using a confluence of VWMA trend, 3-bar momentum, and volume, then filters them by a strength score.
⚠️ **WARNING:** This version **repaints**; signals can appear and disappear before the bar closes.

JL - Market HeatmapThis indicator plots a static table on your chart that displays any tickers you want and their % change on the day so far.
It updates in real time, changes color as it updates, and has several custom functions available for you:
1. Plot up to 12 tickers of your choice
2. Choose a layout with 1-4 rows
3. Display % Change or Not
4. Choose your font size (Tiny, Small, Normal, Large)
5. Up/Down Cell Colors (% change dependent)
6. Up/Down Text Colors (high contrast to your color choices)
The purpose of the indicator is to quickly measure a broad basket of market instruments to paint a more context-rich perspective of the chart you are looking at.
I hope this indicator can help you (and me) accomplish this task in a simple, clean, and seamless manner.
Thanks and enjoy - Jack

NYSE Advancing Issues & Volume RatiosOverview
This comprehensive market breadth indicator tracks two essential NYSE ratios that provide deep insights into market sentiment and internal strength:
NYSE Advancing Issues Ratio
NYSE Advancing Volume Ratio
Dual Ratio Analysis
Issues Ratio: Measures the percentage of NYSE stocks advancing vs. total issues
Volume Ratio: Measures the percentage of NYSE volume flowing into advancing stocks
Both ratios displayed as easy-to-read percentages (0-100%)
Customizable Display Options
Toggle each ratio on/off independently
Choose from multiple moving average types (SMA, EMA, WMA)
Adjustable moving average periods
Custom color schemes for better visualization
Reference Levels
50% Line: Market neutral point (gray dashed)
10% Line: Extremely bearish breadth (red dotted)
90% Line: Extremely bullish breadth (green dotted)
Optional background highlighting for extreme readings
Smart Alerts
Cross above/below 50% (neutral) for both ratios
Extreme readings: Above 90% (strong bullish) and below 10% (strong bearish)
Real-time notifications for key market breadth shifts
📈 How to Interpret
Bullish Signals
Above 50%: More stocks/volume advancing than declining
Above 90%: Extremely strong market breadth (rare occurrence)
Divergence: Price making new highs while breadth weakens (potential warning)
Market Timing
Extreme readings (10%/90%) often coincide with market turning points
Breadth thrusts from extreme levels can signal powerful moves
Use with other technical indicators for enhanced timing

Market BreadthMarket breadth is a technical analysis technique that gauges the strength or weakness of moves in a major index.
Supported index ETF: SPY, NDX, DIA, IWM, OEF, MDY, IWB, IWV.
Supported sector index ETF: XLK, XLC, XLY, XLP, XLV, XLU, XLF, XLRE, XLE, XLB, XLI.

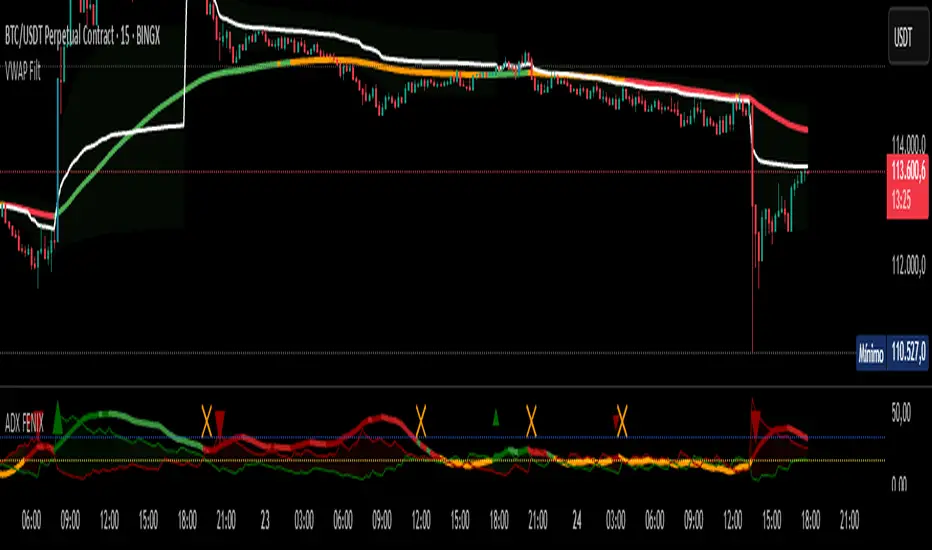
VWAP Filtrado con TendenciaThis indicator combines the classic VWAP with a trend EMA filtered by the TDFI oscillator to confirm market direction.
- VWAP is displayed in white as the fair value reference.
- The trend EMA dynamically changes color according to market condition: green (uptrend), red (downtrend), orange (range).
- Candles highlight in blue when a bullish VWAP crossover is confirmed, and in fuchsia when a bearish crossover is confirmed.
- Includes adjustable thresholds and a cooldown filter to reduce noise and improve reliability.
This approach allows traders to identify not only the relative position to VWAP but also the strength and clarity of the trend, enhancing decision-making across all timeframes.
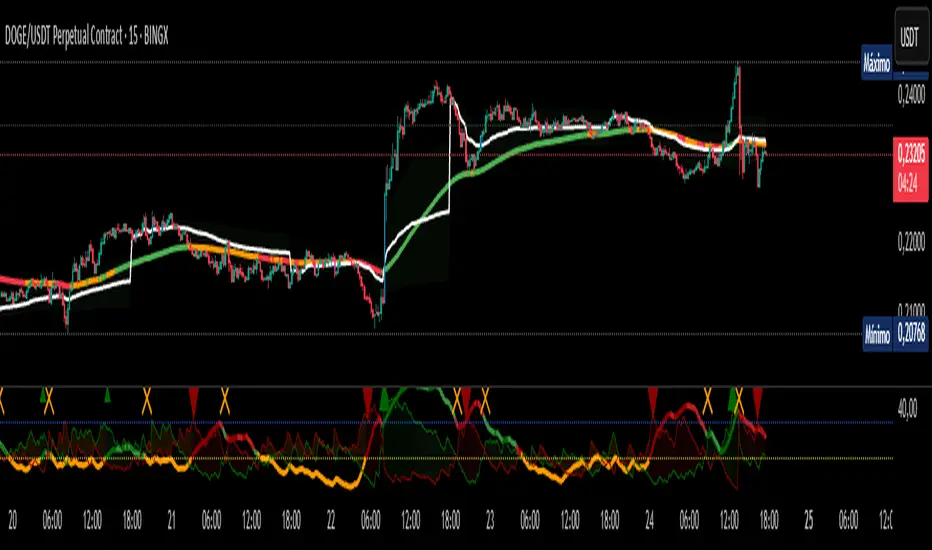
VWAP Filtered with TrendThis indicator combines the classic **VWAP** with a trend EMA filtered by the TDFI oscillator to confirm market direction.
- VWAP is displayed in white as the fair value reference.
- The trend EMA dynamically changes color according to market condition: green (uptrend), red (downtrend), orange (range).
- Candles highlight in blue when a bullish VWAP crossover is confirmed, and in fuchsia when a bearish crossover is confirmed.
- Includes adjustable thresholds and a cooldown filter to reduce noise and improve reliability.
This approach allows traders to identify not only the relative position to VWAP but also the strength and clarity of the trend, enhancing decision-making across all timeframes.
(LES/SES) Compliment Net Volume(LES/SES) Compliment Net Volume
(LES/SES) Compliment Net Volume is a volume-based confirmation tool designed to show whether buyers or sellers are truly in control behind the candles. It acts as a compliment to the Long Elite Squeeze (LES) and Short Elite Squeeze (SES) frameworks, giving traders a clearer view of momentum strength.
Note! {Short Elite Squeeze (SES) Will be released in the Future}
-Designed to take shorts opposite of the long trades from LES
🔹 Core Logic
Net Volume Calculation – Positive volume when price closes higher, negative when price closes lower.
Cumulative Smoothing – Uses a rolling SMA of cumulative differences to remove noise.
Color Coding –
Green → Buyer dominance
Red → Seller dominance
Gray → Neutral pressure
🔹 How to Use
Above zero (green) → Buyers dominate → supports long setups (LES).
Below zero (red) → Sellers dominate → supports short setups (SES).
Flat/gray → No clear pressure → signals caution or chop.
This makes it easier to confirm when market participation aligns with a potential entry or exit.
🔹 Credit
The Compliment Net Volume was developed by Hunter Hammond (Elite x FineFir) as part of the LES/SES system.
The concept builds on classic Net Volume and cumulative volume analysis principles shared by the TradingView community, but has been uniquely adapted into the LES/SES framework.
⚠️ Disclaimer: This is a framework tool, not financial advice. Use with proper risk management.

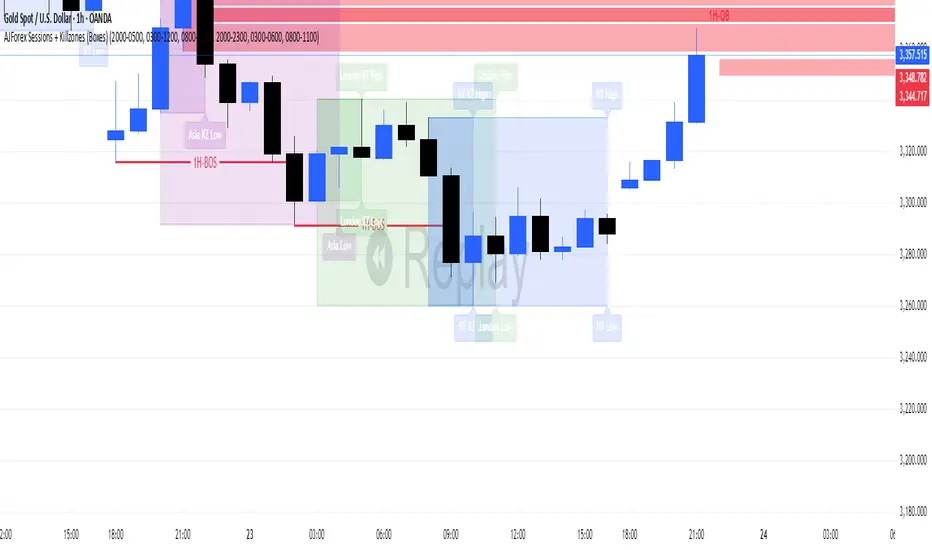
AJForex Sessions + Killzones (Boxes)use timeline UTC -4 AJForex Sessions + Killzones (Boxes)AJForex Sessions + Killzones (Boxes)AJForex Sessions + Killzones (Boxes)AJForex Sessions + Killzones (Boxes)AJForex Sessions + Killzones (Boxes)AJForex Sessions + Killzones (Boxes)AJForex Sessions + Killzones (Boxes)AJForex Sessions + Killzones (Boxes)AJForex Sessions + Killzones (Boxes)
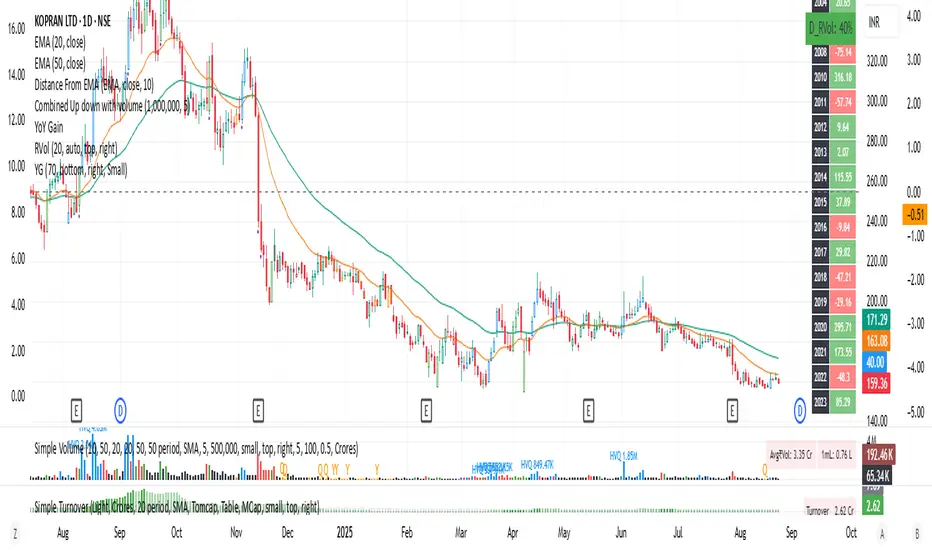
YoY Gain till current yearYoy gains that helps you build your data base. You can see all the gains from the past 20 years and thus helps you analyze the stock movement and expected gain over the period of time, com bine this information with market cap of the stock and you can know its future potential combined with current and past earnings analysis.
Donchian Squeeze Oscillator# Donchian Squeeze Oscillator (DSO) - User Guide
## Overview
The Donchian Squeeze Oscillator is a technical indicator designed to identify periods of low volatility (squeeze) and high volatility (expansion) in financial markets by measuring the distance between Donchian Channel bands. The indicator normalizes this measurement to a 0-100 scale, making it easy to interpret across different timeframes and instruments.
## How It Works
The DSO calculates the width of Donchian Channels as a percentage of the middle line, smooths this data, and then normalizes it using historical highs and lows over a specified lookback period. The result is inverted so that:
- **High values (80+)** = Narrow channels = Low volatility = Squeeze
- **Low values (20-)** = Wide channels = High volatility = Expansion
## Key Parameters
### Core Settings
- **Donchian Channel Period (20)**: The number of bars used to calculate the highest high and lowest low for the Donchian Channels
- **Smoothing Period (5)**: Applies moving average smoothing to reduce noise in the oscillator
- **Normalization Lookback (200)**: Historical period used to normalize the oscillator between 0-100
### Threshold Levels
- **Over Squeeze (80)**: Values above this level indicate strong squeeze conditions
- **Over Expansion (20)**: Values below this level indicate strong expansion conditions
## Reading the Indicator
### Color Coding
- **Red Line**: Squeeze condition (above 80 threshold) - Markets are consolidating
- **Orange Line**: Neutral/trending condition with upward momentum
- **Green Line**: Expansion condition or downward momentum
### Visual Elements
- **Red Dashed Line (80)**: Squeeze threshold - potential breakout zone
- **Gray Dotted Line (50)**: Middle line - neutral zone
- **Green Dashed Line (20)**: Expansion threshold - high volatility zone
- **Red Background**: Highlights active squeeze periods
## Trading Applications
### 1. Breakout Trading
- **Setup**: Wait for DSO to reach 80+ (squeeze zone)
- **Entry**: Look for breakouts when DSO starts declining from squeeze levels
- **Logic**: Prolonged low volatility often precedes significant price movements
### 2. Volatility Cycle Trading
- **Squeeze Phase**: DSO > 80 - Prepare for potential breakout
- **Breakout Phase**: DSO declining from 80 - Trade the direction of breakout
- **Expansion Phase**: DSO < 20 - Expect trend continuation or reversal
### 3. Trend Confirmation
- **Orange Color**: Suggests bullish momentum during expansion
- **Green Color**: Suggests bearish momentum or consolidation
- Use in conjunction with price action for trend confirmation
## Best Practices
### Timeframe Selection
- **Higher Timeframes (Daily, 4H)**: More reliable signals, fewer false breakouts
- **Lower Timeframes (1H, 15M)**: More frequent signals but higher noise
- **Multi-timeframe Analysis**: Confirm squeeze on higher TF, enter on lower TF
### Parameter Optimization
- **Volatile Markets**: Increase Donchian period (25-30) and smoothing (7-10)
- **Range-bound Markets**: Decrease Donchian period (15-20) for more sensitivity
- **Trending Markets**: Use longer normalization lookback (300-400)
### Signal Confirmation
Always combine DSO signals with:
- **Price Action**: Support/resistance levels, chart patterns
- **Volume**: Confirm breakouts with increasing volume
- **Other Indicators**: RSI, MACD, or momentum oscillators
## Alert System
The indicator includes built-in alerts for:
- **Squeeze Started**: When DSO crosses above the squeeze threshold
- **Expansion Started**: When DSO crosses below the expansion threshold
## Common Pitfalls to Avoid
1. **False Breakouts**: Don't trade every squeeze - wait for confirmation
2. **Parameter Over-optimization**: Stick to default settings initially
3. **Ignoring Market Context**: Consider overall market conditions and news
4. **Single Indicator Reliance**: Always use additional confirmation tools
## Advanced Tips
- Monitor squeeze duration - longer squeezes often lead to bigger moves
- Look for squeeze patterns at key support/resistance levels
- Use DSO divergences with price for potential reversal signals
- Combine with Bollinger Band squeezes for enhanced accuracy
## Conclusion
The Donchian Squeeze Oscillator is a powerful tool for identifying volatility cycles and potential breakout opportunities. Like all technical indicators, it should be used as part of a comprehensive trading strategy rather than as a standalone signal generator. Practice with the indicator on historical data before implementing it in live trading to understand its behavior in different market conditions.


ICT Silver Bullet Zones (All Sessions)This Pine Script v6 indicator highlights the ICT Silver Bullet windows (10:00–11:00 local time) for all major forex/trading sessions: London, New York AM, New York PM, and Asia.
✅ Features:
Clearly visualizes Silver Bullet zones for each session.
Labels are centered inside each zone for easy identification.
Fully compatible with Pine Script v6 and TradingView.
Adjustable opacity and label size for better chart visibility.
Works on any timeframe and keeps historical zones visible.
Use Case:
Perfect for ICT strategy traders who want to identify high-probability trading windows during major market sessions. Helps in planning entries and understanding liquidity timing without cluttering the chart.
Instructions:
Add the script to your TradingView chart.
Adjust opacity and label size to suit your chart style.
Observe the SB zones for all sessions and plan trades according to ICT methodology.

EMA 20–55 + SMMA50 (20↔55 Band, Alerts, Color Controls)This script plots a customizable EMA ribbon and a smoothed moving average (SMMA).
Key features:
EMA 20 (blue) and EMA 55 (yellow) highlighted with a green/red background ribbon depending on trend.
Optional middle EMAs (25, 30, 35, 40, 45, 50) can be shown or hidden.
SMMA (50) plotted in white as a trend smoother.
Customizable line colors, band colors, and transparency.
Alerts for EMA20/EMA55 bullish or bearish crossovers.
Optional candle bar coloring based on trend.
This is useful for quickly spotting medium-term trend shifts when EMA20 crosses EMA55, while still tracking the broader EMA ribbon context.

Pivot Matrix & Multi-Timeframe Support-Resistance Analytics________________________________________
📘 Study Material for Pivot Matrix & Multi Timeframe Support-Resistance Analytics
(By aiTrendview — Educational Use Only)
________________________________________
🎯 Introduction
The Pivot Matrix & Multi Timeframe Support-Resistance Analytics indicator is designed to help traders visualize pivot points, support/resistance levels, VWAP, and volume flow analytics all in one place. Rather than giving explicit buy/sell calls, the dashboard provides reference insights so a learner may understand how different technical levels interact in real time.
This document explains its functionality step by step with formulas and usage guides.
________________________________________
1️⃣ Pivot System Logic
Pivot points are classic tools for mapping market support and resistance levels.
✦ How Calculated?
Using the Traditional Method:
• Pivot Point (PP):
PP=Highprev+Lowprev+Closeprev3PP = \frac{High_{prev} + Low_{prev} + Close_{prev}}{3}PP=3Highprev+Lowprev+Closeprev
• First Support/Resistance:
R1=2×PP−Lowprev,S1=2×PP−HighprevR1 = 2 \times PP - Low_{prev}, \quad S1 = 2 \times PP - High_{prev}R1=2×PP−Lowprev,S1=2×PP−Highprev
• Second Support/Resistance:
R2=PP+(Highprev−Lowprev),S2=PP−(Highprev−Lowprev)R2 = PP + (High_{prev} - Low_{prev}), \quad S2 = PP - (High_{prev} - Low_{prev})R2=PP+(Highprev−Lowprev),S2=PP−(Highprev−Lowprev)
• Third Levels:
R3=Highprev+2×(PP−Lowprev),S3=Lowprev−2×(Highprev−PP)R3 = High_{prev} + 2 \times (PP - Low_{prev}), \quad S3 = Low_{prev} - 2 \times (High_{prev} - PP)R3=Highprev+2×(PP−Lowprev),S3=Lowprev−2×(Highprev−PP)
• Similarly, R4/R5 and S4/S5 are extrapolated from extended range multipliers.
✦ How Used?
• Price above PP → bullish control bias.
• Price below PP → bearish control bias.
• R1–R5 levels act as resistances; S1–S5 act as supports.
Learners should watch how candles behave when approaching R/S zones to spot breakout vs. rejection conditions.
________________________________________
2️⃣ Multi Timeframe Logic
The indicator allows using daily-based pivot values (via request.security). This ensures alignment with institutional daily levels, not just intraday recalculations.
✦ Teaching Value
Understanding MTF pivots shows how markets respect higher timeframe levels (daily > intraday, weekly > daily). This helps learners grasp nested support-resistance structures.
________________________________________
3️⃣ VWAP (Volume Weighted Average Price)
Formula:
VWAPt=∑(Pricei×Volumei)∑(Volumei),Pricei=High+Low+Close3VWAP_t = \frac{\sum (Price_i \times Volume_i)}{\sum (Volume_i)}, \quad Price_i = \frac{High + Low + Close}{3}VWAPt=∑(Volumei)∑(Pricei×Volumei),Pricei=3High+Low+Close
Usage:
• VWAP is used as an institutional benchmark of fair value.
• Above VWAP = bullish flow.
• Below VWAP = bearish flow.
Learners should check whether price respects VWAP as a magnet or uses it as support/resistance.
________________________________________
4️⃣ Volume Flow Analysis
The script classifies buy volume, sell volume, and neutral volume.
• Buy Volume = if close > open.
• Sell Volume = if close < open.
• Neutral Volume = if close = open.
For daily tracking:
Buy%=DayBuyVolDayTotalVol×100,Sell%=DaySellVolDayTotalVol×100Buy\% = \frac{DayBuyVol}{DayTotalVol} \times 100, \quad Sell\% = \frac{DaySellVol}{DayTotalVol} \times 100Buy%=DayTotalVolDayBuyVol×100,Sell%=DayTotalVolDaySellVol×100
Usage for Learners:
• Dominant Buy% → accumulation/ bullish pressure.
• Dominant Sell% → distribution/ bearish pressure.
• Balanced → sideways liquidity building.
This teaches observation of order flow bias rather than relying only on price.
________________________________________
5️⃣ Dashboard Progress Bars & Colors
The script uses visual progress bars and dynamic colors for clarity. For example:
• VWAP Backgrounds: Green shades when price strongly above VWAP, Red when below.
• Volume Bars: More green blocks mean buying dominance, red means selling pressure.
This visual design turns concepts into easy-to-digest cues, useful for training.
________________________________________
6️⃣ Market Status Summary
Finally, the dashboard synthesizes all data points:
• Price vs Pivot (above or below).
• Price vs VWAP (above or below).
• Volume Pressure (buy side vs sell side).
Status Rule:
• If all three align bullish → Status box turns green.
• If mixed → Neutral grey.
• If bearish dominance → weaker tone.
Why Important?
This teaches learners that market conditions should align in confluence across indicators before confidence arises.
________________________________________
⚠️ Strict Disclaimer (aiTrendview)
The Pivot Matrix & Multi Timeframe Support-Resistance Analytics tool is developed by aiTrendview for strictly educational and research purposes.
❌ It does NOT provide buy/sell recommendations.
❌ It does NOT guarantee profits.
❌ Unauthorized use, copying, or redistribution of this code is prohibited.
⚠️ Trading Risk Warning:
• Trading involves high risk of financial loss.
• You may lose more than your capital.
• Past levels and indicators do not predict future outcomes.
This tool must be viewed as a visual education aid to practice technical analysis skills, not as trading advice.
________________________________________
✅ Now you have a step by step study guide:
• Pivot calculations explained
• VWAP with logic
• Volume breakdown
• Visual analytics
• Status confluence logic
• Disclaimer for compliance
________________________________________
⚠️ Warning:
• Trading financial markets involves substantial risk.
• You can lose more money than you invest.
• Past performance of indicators does not guarantee future results.
• This script must not be copied, resold, or republished without authorization from aiTrendview.
By using this material or the code, you agree to take full responsibility for your trading decisions and acknowledge that this is not financial advice.
________________________________________
⚠️ Disclaimer and Warning (From aiTrendview)
This Dynamic Trading Dashboard is created strictly for educational and research purposes on the TradingView platform. It does not provide financial advice, buy/sell recommendations, or guaranteed returns. Any use of this tool in live trading is completely at the user’s own risk. Markets are inherently risky; losses can exceed initial investment.
The intellectual property of this script and its methodology belongs to aiTrendview. Unauthorized reproduction, modification, or redistribution of this code is strictly prohibited. By using this study material or the script, you acknowledge personal responsibility for any trading outcomes. Always consult professional financial advisors before making investment decisions.
