볼린저 밴드 (BB)

Trig's Law 2.0This script uses a combination of candlestick patterns and indicators to produce signals that indicate potential trade opportunities for binary options traders.
These signals are meant to serve as additional confirmation.
Best suited for EURNZD pair on the 5min and 3min timeframes.
In the settings menu, you will see a list of pattern-based signals you can choose to have displayed on the chart.
ideally should wait for the signal candle to close before entering any trade.

Variable Index Dynamic Average (VIDYA) BandsThis adds volatility bands to the Variable Index Dynamic Average (VIDYA). The bands are calculated using the exponential moving average of the standard deviation of the VIDYA.
Thanks to everget for programming the VIDYA for tradingview.

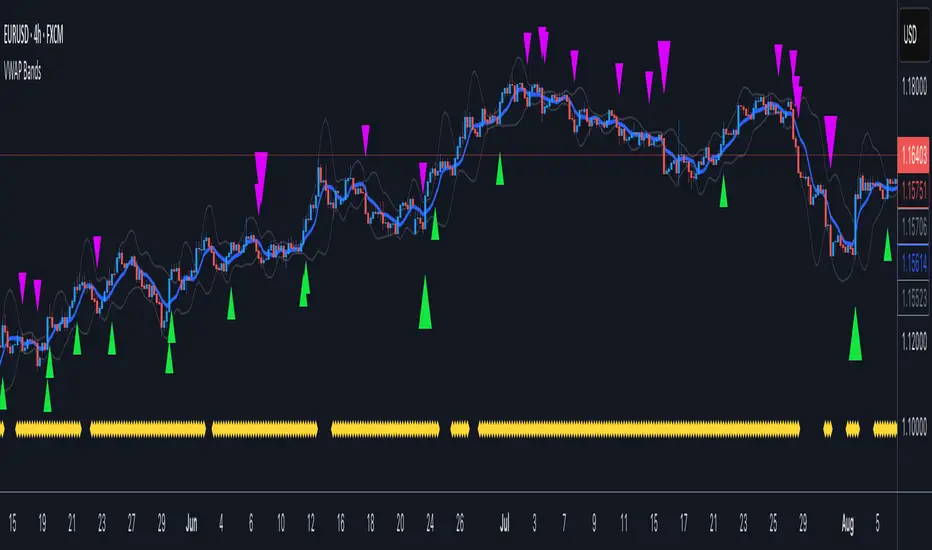
VWAP BandsOrginal VWAP script is from neolao, so big thanks to him.
Took the VWAP, added the Bollinger and Keltner channel squeeze. Also there is a criteria of Bands width.
Great tool to predict fast large moves within short periods of time.
Tried to keep the charts as clean as possible and easy to read.
If there are any questions Ill be happy to help or answer them.
VW %BB +Volume weighted %BB Based on Closing price (green line)
%BB of 50 period ema of the 20 period volume weighted moving average at each point (blue)
difference of %BB green - %bb Blue shading around mid-band (ie width between two in band terms)
added an additional line which is the sum of the absolute distance from mid-band of the ema + top half of bandwidth difference
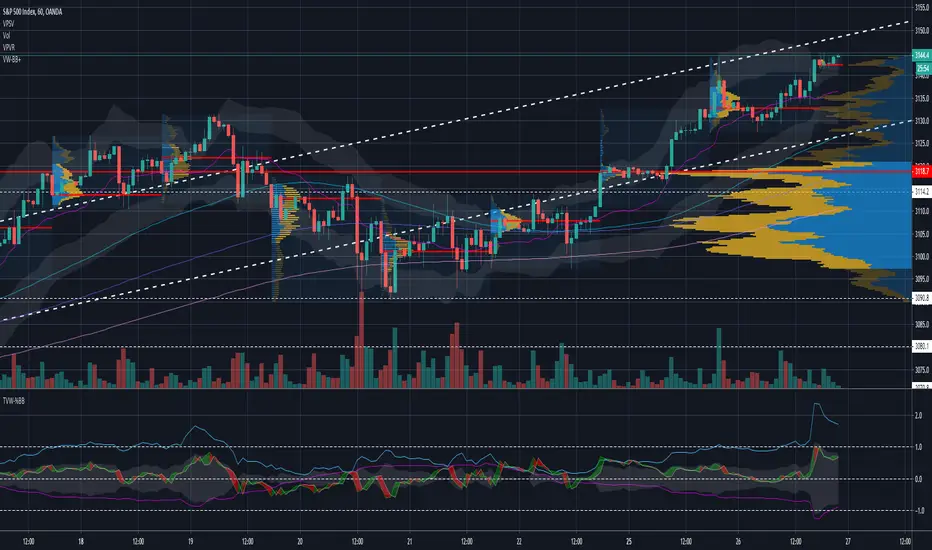

Better Bollinger bandsBollinger bands with volume-weighted statistics (volume weighted moving averages & variance/standard deviation) to give better results during high-volume events, and also aims to provide additional information without adding clutter by coloring the bands. Intended as the first basic indicator to be thrown on a chart.
Will never annoy you by rescaling log charts due to negative lower bands (much like my previous geometric bollinger bands) , and will almost always give more realistic bounds on price movement than standard bollinger bands, particularly during high-volume events such as broken supports, earnings reports, or squeezes.
The centerline is colored green or red by a volume-weighted momentum oscillator. The bands themselves let you select color schemes such as detected market type (confirmed bull market, confirmed bear market, or volatility-dominated), volatility change (to clearly show when bands are expanding or contracting), or the same color as the centerline oscillator.

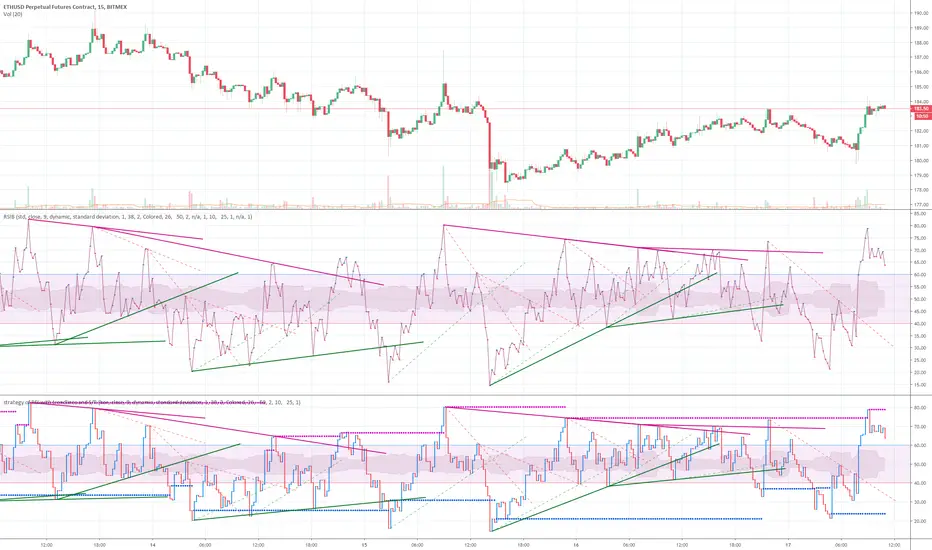
strategy of RSI with trendlines and S/RBefore I go through this chart I want to acknowledge the great programmers who spent much of their time and effort to assist many TV users and traders.
Thank you to LunaOwl for the RSI American lines her script made me realize the need to have trendlines, supports, and resistance on RSI charts.
Also, a copy of Lij_MC code from was taken which had been credited to Duyck. Thank you Duyck.
The BB was copied from morpheus747
As I researched different strategies one strategy seemed to assist the trader for entry and exits. It was the combination of Support and resistance on the RSI. In addition, diagonal lines (Recently introduced in pine script V4) assists in the direction and reversals that may occur. What is supplied is only a graphical representation and no trade entry or exit points are selected.
On the chart you can use;
• RSI line or bar;
• Bollinger High / Low support line;
• Diagonal trend lines. A primary and a secondary group of trendlines; and
• Trendline candle highlighter.
I am hoping people with great skills could assist to develop this to the next level.
I hope this graphical strategy may help until further development. Enjoy.
Geometric Bollinger BandsAnalogous to Bollinger bands but performs all computations on the logarithms of the values.
Unlike the regular bollinger bands (or most other variations of them available on tradingview), these won't annoy you by rescaling the chart when you try to look at the Bitcoin weekly chart or any other chart with strongly exponential behaviour, and the moving average is perfectly centered between the two bands on your log chart. The lower band is guarenteed to be positive for positive inputs.

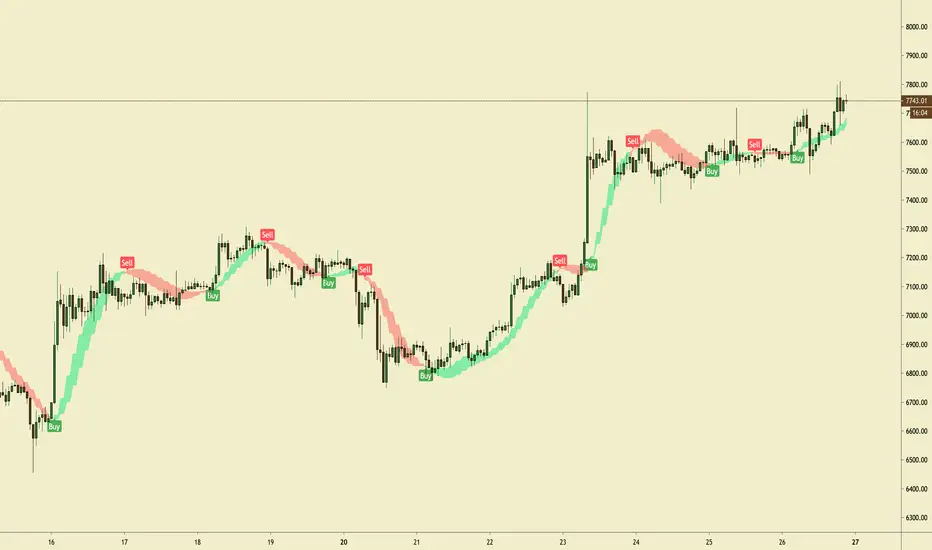
Easy Loot BandsEasy Loot Bollinger Bands:
This indicator is a bollinger band that also auto-generates a trendline, giving you the best opportunities to buy & sell. That's it.
You can use this on any time-frame, any stock, and any cryptocurrency.
Dr_All indicators V1.0Free users have many restrictions on their use in TradingView.
I put together a lot of indicators I use often.
5 moving average
1 parabolic SAR
1 bollinger band
1 ichimoku cloud
(but it's only cloud)
as always
It's open source.
enjoy!

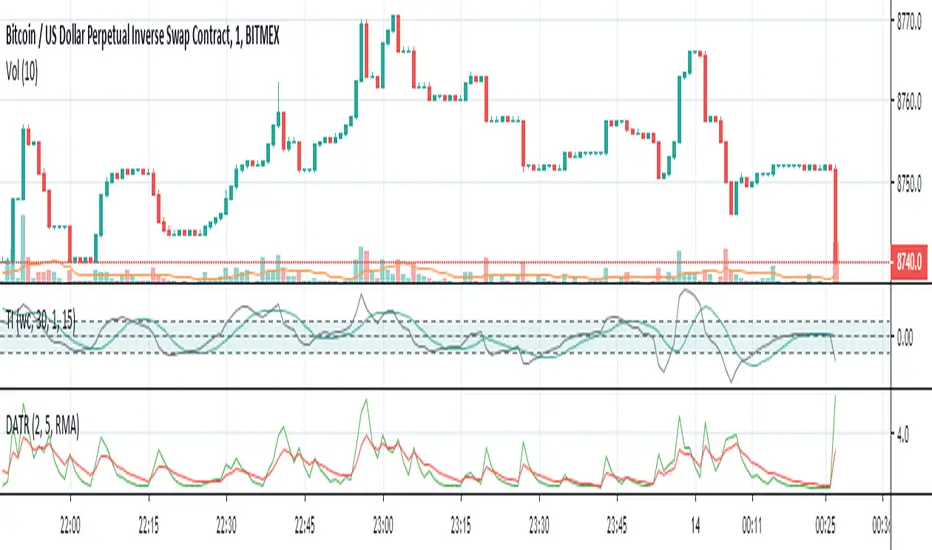
Turtle IndexThis Indicator is a combination of Super Smoother Filter and Bollinger Bands %B.
This Indicator is used in Trend-Momentum gauging. Use this indicator with Turtle Oscillator.
Bundle of various indicators, All-in-oneThis scripts compiles many indicators into one. It comes from many sources and i added all sources i used. If i forgot one, don't hesitate to message me.
This is useful if you need to setup your chart layout fast. The menu makes it easy to configure it.
You can configure and display:
- Various types of moving averages: RMA, SMA , EMA , WMA , VWMA , SMMA , HullMA, LSMA , DEMA , TEMA
- Stochastic RSI crosses from multi-timeframes directly on candle's close (1h, 4h, D, W)
- Bollinger bands with primary and secondary deviation
- SAR
- Color background using difference between Stochastic RSI K and D
- Support and resistance
- Open high low close from higher timeframes (D, W, M)
- Auto fibonacci levels (still a work in progress, i will add logarithmic fibonacci levels too later)
- "Alt season" for crypto users: if BTC dominance cross his SMA , display a pictogram on every chart
Stil working on:
- Auto fibonacci levels: i will add logarithmic fibonacci levels
- Stochastic crosses
- Alt season: use others types of moving averages
If you have any suggestions / improvements, feel free to message me or write it in the comments below.

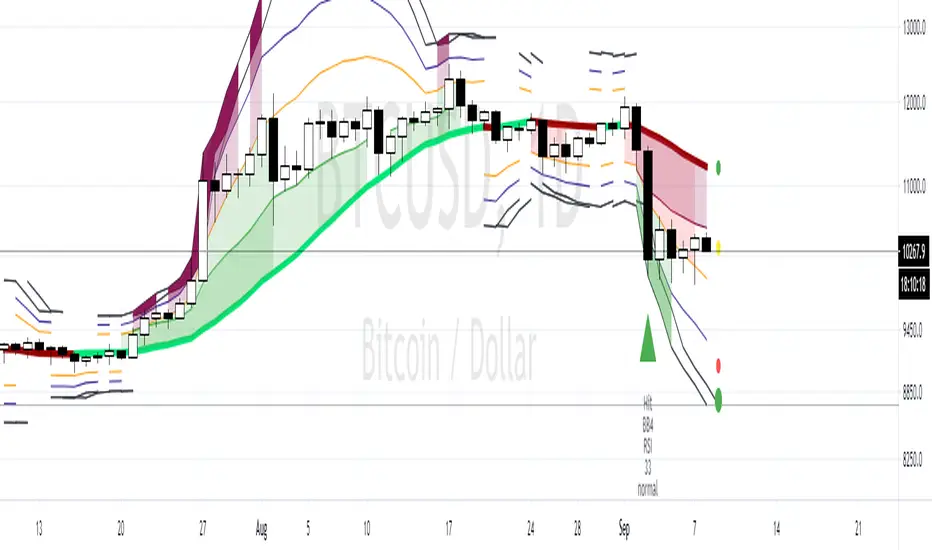
VBF Trader PRO for BTC and altcoins with LONG and SHORT alertsThis script allows you to catch trend moves between BB critical levels (red and green zones on the chart) and very good for daily scalping ether for bitcoin or any altcoins to USDT or BTC trading pairs. Probability is very HIGH.

MACDTraderPro for BTC with LONG & SHORT AlertsMostly based on MACD analysis this trend indicator accurately shows you when main trend changes.
It has LONG and SHORT labels and you can use it with tradingview alerts to be in touch and for automated trading bots.
You can use it both with margin(bitmex, bitfinex, etc) and main exchanges (binance and more) with bitcoin for now and soon for alts also.


BBPivotIt can helps you to see BB pivots . It's based on bollinger bands .
Best Settings: (20,3) - (50,2)
Cheers :)

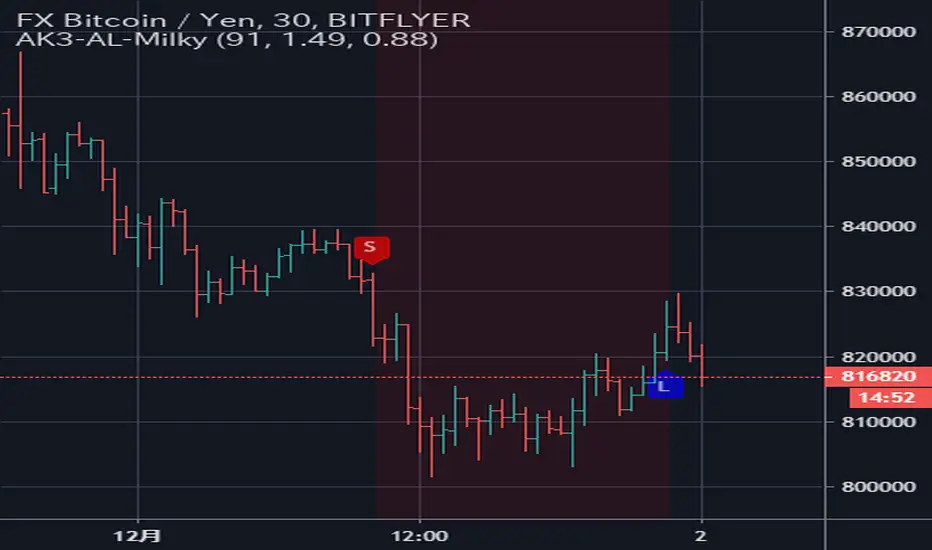
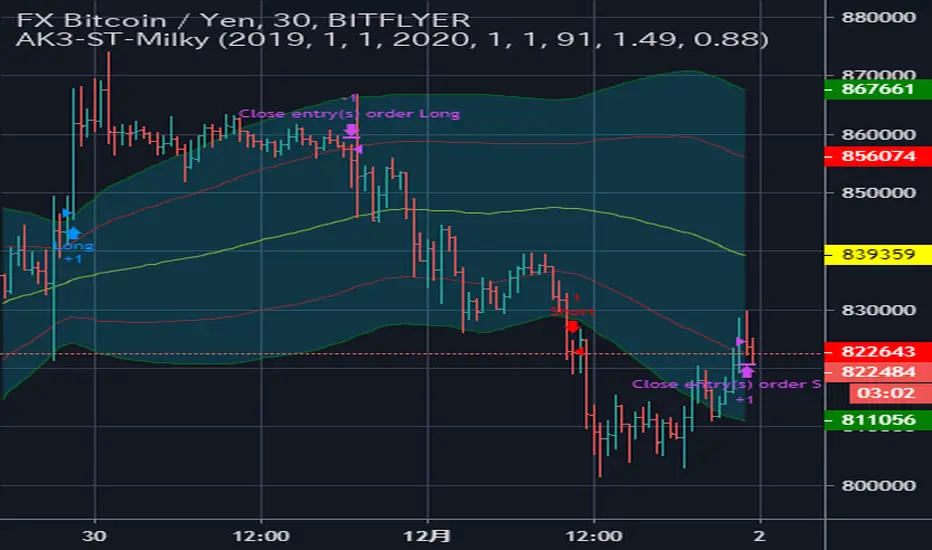
Bollinger Bands JuanSeNL Strategy Bitmex 15min
It is a conservative strategy that works in bitmex in a 15-minute time frame, identifies an oversold market and sells on the rebound
It has a modifiable takeprofit and stoploss but works fine as it is set by default
Only Longs

Bollinger Bands 3 to 5 Pull-back Detektor Test versionWe use a mix Bollinger and Keltner.
The price always want to stay inside the Bollinger.
A lot of times we have big candels with great pullbacks.
If u are long and the Indicator show a red BB Area there is a god chance for a pullback.
We have rsi label and Rsi extreme label
If the rsi is High or extreme High u see it in the chart an u can look for a divergence that may end the trend.
I want to use it for scalping together with Pivot Point standart. It is not testet. Please use Papertrading first.
A small Video (german)
If u try it plase leave a commend.
Have fun