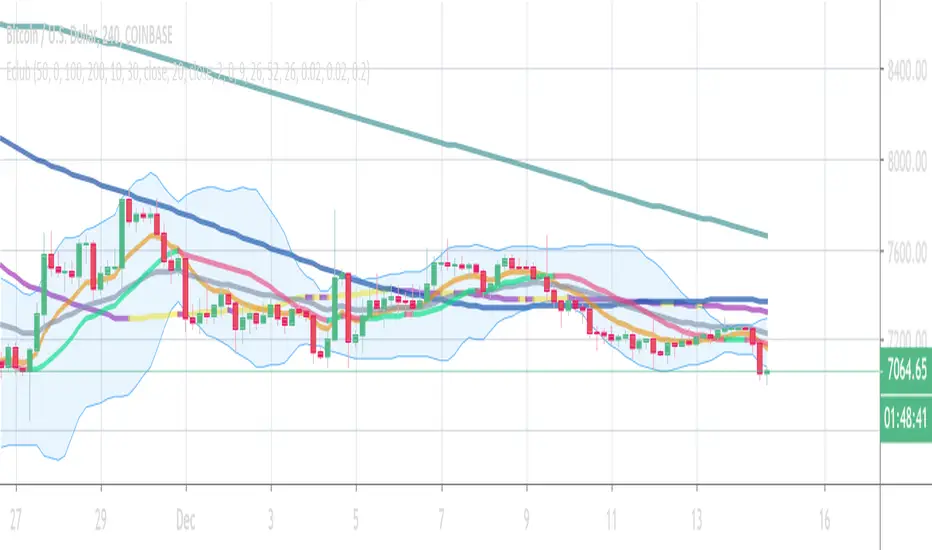
Ehlers Fractal Adaptive Moving Average with Bands [Bitcoinduke]FRAMA – What is it?
Fractal Adaptive Moving Average Technical Indicator ( FRAMA ) was developed by John Ehlers, code was implemented by TradingView user Shizaru. I've updated it to Pine Script 4 and added Bands Extension.
This indicator is constructed based on the algorithm of the Exponential Moving Average , in which the smoothing factor is calculated based on the current fractal dimension of the price series.
Advantages:
possibility to follow strong trend movements
determine moments of price consolidation ( FRAMA sufficiently slow down at these moments)
FRAMA + Bands
The FRAMA serves as a base for the Upper and Lower Bands which are used as a way to measure volatility by observing the relationship between the Bands and price. Typically the Upper and Lower Bands are set to two standard deviations away from the FRAMA ; however it should be adjusted depending on the task.
볼린저 밴드 (BB)

ZoneBand (@Mido_yuiya)Bollinger band is converted to EMA , and support and resistance bands are made into regions

Better Bollinger Bands (now open source)General purpose Bollinger band indicator with a number of configuration options and some additional color-coded information. The main advantages of it over standard Bollinger bands are:
1) Better statistics:
* Uses volume weighted moving averages, variance, and standard deviation by default. The volume dependence can be disabled with a checkbox option, but generally makes it more responsive improves its ability to distinguish true outlier events from random variation.
* Lets you pick between different time windows (simple, sawtooth (WMA), exponential) in addition to the volume weighting, with appropriate Bessel corrections to make the estimators unbiased and to get consistent result for different weights.
* Has a checkbox option to use a linear regression in the band calculation if you don't want average momentum to be counted in the volatility. This turns the centerline into a last squares moving average, and the band width at each time step is given by the variance away from the regression line instead of from a moving average. Weights in the least squares regression are changed according to the other options. For tickers with a strong long-term trend this makes the bands track the price action more closely.
2) Geometric
* This does all calculations on log(price) instead of the prices themselves.
* Makes almost no difference in most cases, but gives better results on charts with strongly exponential behaviour that range between several orders of magnitude.
* Properly centered around price action on log plots.
* Will never annoy you by rescaling a log plot due to a negative lower band. The lower band is always positive for positive prices.
3) Some built in oscillators.
* This aims to reduce clutter by building in some other indicators into the band color scheme. You can pick between various momentum & RSI operators to color the center line and the bands, or leave the bands plain.
I've been using these bands myself for a few months & have been gradually adding functionality & polish. Feel free to comment, or to refer to me if you borrow any ideas.

Eclub Multi IndicatorThis multi Indicator includes:
3 Moving Averages
2 Exponential Moving Averages
Bollinger Band
Ichimoku
Parabolic SAR
You can change the colors if you want. Go to setting to enable Ichimoku or SAR or disable others.
The color tolerance is by default zero which results in a very sensitive color change. You can change it to decrease the sensitivity. The value should be the last decimal of the price or the last two decimals of price etc.
If you like this indicator donate some BTC to the following address:
BTC address:
18NSD2xdJyYWoC4CSr4xg1hMk2q5cBbr8T
CBMA Bollinger Bands Strategy directed [ChuckBanger]I just did a Bollinger Bands script with my newly CB moving average
While I'm generally against posting strategies because it's very easy to fake performance numbers... This is just to share a cool strategy snippet. My settings are 10 contracts/order with pyramiding set to 10. You can make the profitability a lot higher if you set the order size higher. But that dosent help you getting more out of this script when u make a bot of this script. I set the order size to 10 contracts to get your attention not to showcase the performance.
When the price is going down and outside of the lower side of the band. And when the price comes back into the channel the strategy buys. Usually that means the price is going up. And when the price is going up and outside of the upper band. The strategy sells when it crosses back in to the channel.
It is a very simple strategy but it is effective. I guess you need a proper stop-loss for this script to bee really profitable in a bot environment.

Bollinger Bands Trend Model-BuschiEnglish
In general, Bollinger Bands are used as an indicator to visualize the "reversion to the mean". However, in this model, by using smaller variable values (default: 10 time intervals instead of 20, 1 standard deviation instead of 2), they are used as an trend following indicator. Two consecutive closes above the upper band form a buy signal (symbol 'B' above bar) which is reversed by two consecutive closes below the lower band (symbol 'S' under bar) and vice versa. The corresponding buying (green) and selling (red) zones are coloured between the bands.
Deutsch
Im Allgemeinen werden Bollinger-Bänder als ein Indikator verwendet, um die "Rückkehr zum Mittelwert" zu visualisieren. In diesem Modell werden sie durch kleine Variablen-Werte (Standardwert: 10 Zeitintervalle anstatt 20, 1 Standardabweichung anstatt 2) jedoch als Trendfolge-Indikator verwendet. Zwei aufeinanderfolgende Schlusskurse über dem oberen Band (Symbol 'B' über dem Balken) bilden ein Kaufsignal, das durch zwei aufeinanderfolgende Schlusskurse unter dem unteren Band (Symbol 'S' unter Balken) umgekehrt wird. Gleiches gilt umgekehrt. Die entsprechenden Kauf-Zonen (grün) und Verkauf-Zonen (rot) werden zwischen den Bändern eingefärbt.

Combo Backtest 123 Reversal & DAPD This is combo strategies for get a cumulative signal.
First strategy
This System was created from the Book "How I Tripled My Money In The
Futures Market" by Ulf Jensen, Page 183. This is reverse type of strategies.
The strategy buys at market, if close price is higher than the previous close
during 2 days and the meaning of 9-days Stochastic Slow Oscillator is lower than 50.
The strategy sells at market, if close price is lower than the previous close price
during 2 days and the meaning of 9-days Stochastic Fast Oscillator is higher than 50.
Second strategy
This indicator is similar to Bollinger Bands. It based on DAPD - Daily
Average Price Delta. DAPD is based upon a summation for each of the
highs (hod) for the 21 days prior to today minus the summation for
each of the lows (lod) for the last 21 days prior to today. The result
of this calculation would then be divided by 21.
It will be buy when high above previos DAPD high and sell if low below previos DAPD low
WARNING:
- For purpose educate only
- This script to change bars colors.

Combo Strategy 123 Reversal & DAPD This is combo strategies for get a cumulative signal.
First strategy
This System was created from the Book "How I Tripled My Money In The
Futures Market" by Ulf Jensen, Page 183. This is reverse type of strategies.
The strategy buys at market, if close price is higher than the previous close
during 2 days and the meaning of 9-days Stochastic Slow Oscillator is lower than 50.
The strategy sells at market, if close price is lower than the previous close price
during 2 days and the meaning of 9-days Stochastic Fast Oscillator is higher than 50.
Second strategy
This indicator is similar to Bollinger Bands. It based on DAPD - Daily
Average Price Delta. DAPD is based upon a summation for each of the
highs (hod) for the 21 days prior to today minus the summation for
each of the lows (lod) for the last 21 days prior to today. The result
of this calculation would then be divided by 21.
It will be buy when high above previos DAPD high and sell if low below previos DAPD low
WARNING:
- For purpose educate only
- This script to change bars colors.

Bollinger Bands on MacdOnly longs when Macd line is above Bollinger Band and shorts when Macd line is above Bollinger Band, this will avoid many problems.
thumbs up!!!

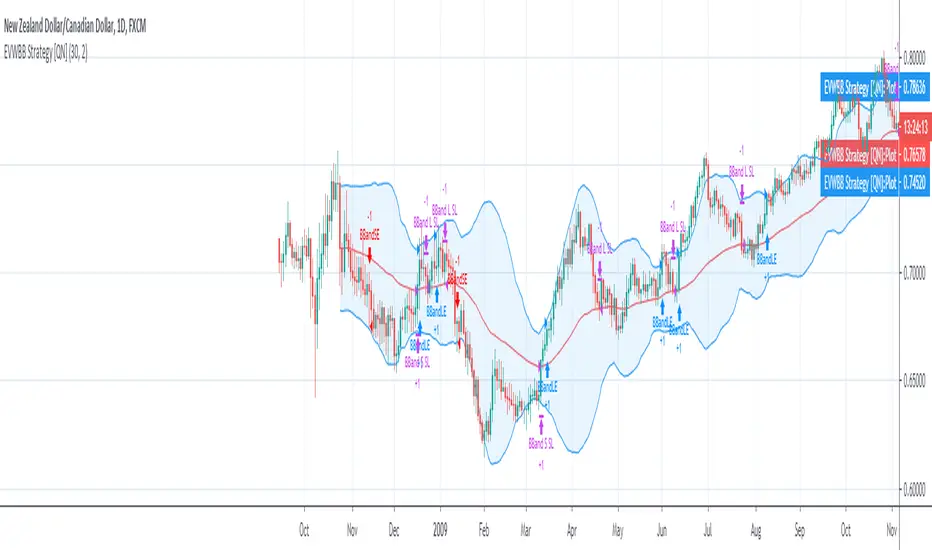
EVWBB Strategy [QuantNomad]It's my new strategy using EVWMA (Elastic Volume Weighted Moving Average).
Now I created a Bollinger Bands strategy where basis level is EVWMA.
It looks pretty interesting but you have to be careful with the entries/exits on the same bar, I'm using stop orders, so on big moves it happens pretty often.
In the next version, I will try to eliminate these issues.
Entry for this strategy happens when price crossover upper for long and lower for short. I exit both short and long on basis level.
RW Simple Pairs TradeA Simple Implementation of a Pairs Trading Strategy
It uses a simple moving average of specified length (default = 20) and enters at cutoffs set by Entry ZScore. Trades are exited at the moving average.
It is intended to be run on pairs of stocks. To Spread KO and PEP, for example, use the ticker KO / PEP * 1000
To visualise the trade better add Bollinger bands to your charts, corresponding to the SMA length and Entry ZScore criteria you specified.

Least Squares Bollinger BandsSimilar to Bollinger Bands but adjusted for momentum. Instead of having the centerline be a simply moving average and the bands showing the rolling variance, this does a linear regression, and shows the LSMA at the center, while the band width is the average deviation from the regression line instead of from the SMA.
This means that unlike for normal Bollinger bands, momentum does not make the bands wider, and that the bands tend to be much better centered around the price action with band walks being more reliable indicators of undersold/oversold conditions. They also give a much narrower estimate of current volatility/price range.
Variable Index Dynamic Average (VIDYA) BandsThis adds volatility bands to the Variable Index Dynamic Average (VIDYA). The bands are calculated using the exponential moving average of the standard deviation of the VIDYA.
Thanks to everget for programming the VIDYA for tradingview.

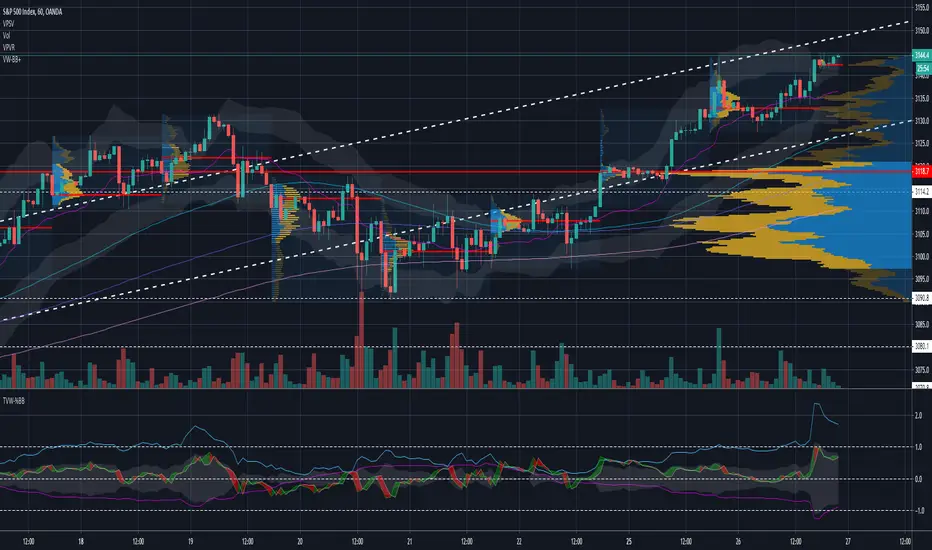
VW %BB +Volume weighted %BB Based on Closing price (green line)
%BB of 50 period ema of the 20 period volume weighted moving average at each point (blue)
difference of %BB green - %bb Blue shading around mid-band (ie width between two in band terms)
added an additional line which is the sum of the absolute distance from mid-band of the ema + top half of bandwidth difference
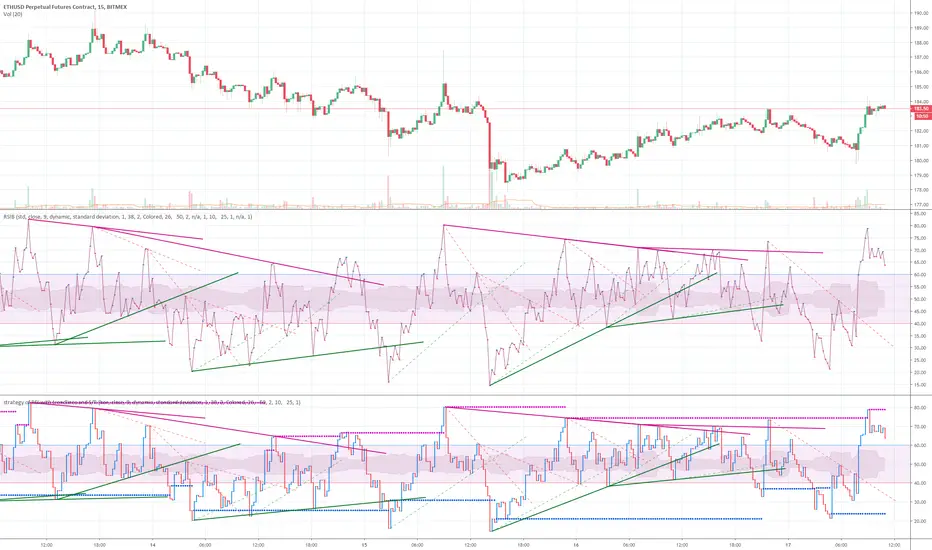
strategy of RSI with trendlines and S/RBefore I go through this chart I want to acknowledge the great programmers who spent much of their time and effort to assist many TV users and traders.
Thank you to LunaOwl for the RSI American lines her script made me realize the need to have trendlines, supports, and resistance on RSI charts.
Also, a copy of Lij_MC code from was taken which had been credited to Duyck. Thank you Duyck.
The BB was copied from morpheus747
As I researched different strategies one strategy seemed to assist the trader for entry and exits. It was the combination of Support and resistance on the RSI. In addition, diagonal lines (Recently introduced in pine script V4) assists in the direction and reversals that may occur. What is supplied is only a graphical representation and no trade entry or exit points are selected.
On the chart you can use;
• RSI line or bar;
• Bollinger High / Low support line;
• Diagonal trend lines. A primary and a secondary group of trendlines; and
• Trendline candle highlighter.
I am hoping people with great skills could assist to develop this to the next level.
I hope this graphical strategy may help until further development. Enjoy.
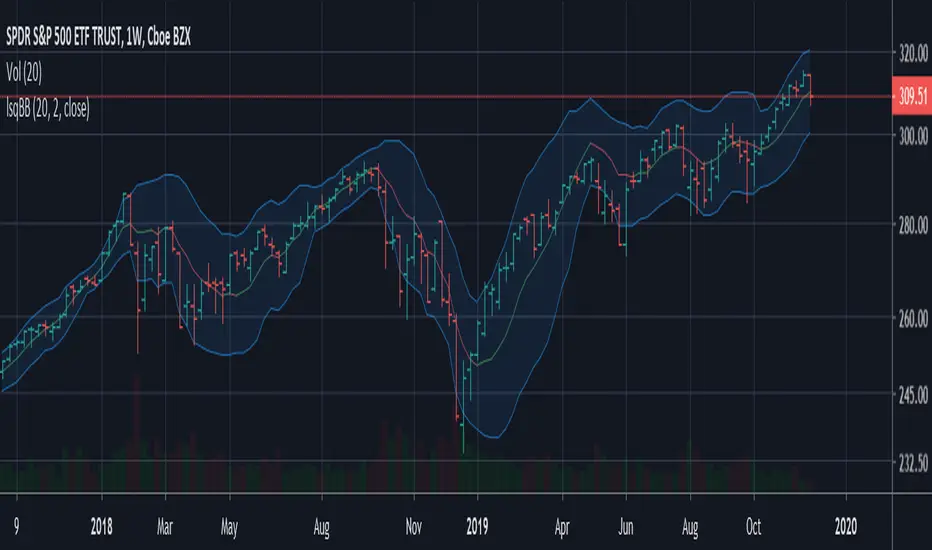
Geometric Bollinger BandsAnalogous to Bollinger bands but performs all computations on the logarithms of the values.
Unlike the regular bollinger bands (or most other variations of them available on tradingview), these won't annoy you by rescaling the chart when you try to look at the Bitcoin weekly chart or any other chart with strongly exponential behaviour, and the moving average is perfectly centered between the two bands on your log chart. The lower band is guarenteed to be positive for positive inputs.

Dr_All indicators V1.0Free users have many restrictions on their use in TradingView.
I put together a lot of indicators I use often.
5 moving average
1 parabolic SAR
1 bollinger band
1 ichimoku cloud
(but it's only cloud)
as always
It's open source.
enjoy!

Bundle of various indicators, All-in-oneThis scripts compiles many indicators into one. It comes from many sources and i added all sources i used. If i forgot one, don't hesitate to message me.
This is useful if you need to setup your chart layout fast. The menu makes it easy to configure it.
You can configure and display:
- Various types of moving averages: RMA, SMA , EMA , WMA , VWMA , SMMA , HullMA, LSMA , DEMA , TEMA
- Stochastic RSI crosses from multi-timeframes directly on candle's close (1h, 4h, D, W)
- Bollinger bands with primary and secondary deviation
- SAR
- Color background using difference between Stochastic RSI K and D
- Support and resistance
- Open high low close from higher timeframes (D, W, M)
- Auto fibonacci levels (still a work in progress, i will add logarithmic fibonacci levels too later)
- "Alt season" for crypto users: if BTC dominance cross his SMA , display a pictogram on every chart
Stil working on:
- Auto fibonacci levels: i will add logarithmic fibonacci levels
- Stochastic crosses
- Alt season: use others types of moving averages
If you have any suggestions / improvements, feel free to message me or write it in the comments below.


BBPivotIt can helps you to see BB pivots . It's based on bollinger bands .
Best Settings: (20,3) - (50,2)
Cheers :)

HLC Bollinger BandsThis is just a Bollinger band indicator that uses the highs & lows in addition to the close in the calculation of volatility / deviations from average. These bands will be slightly wider than regular Bollingers as a result.
I've found it useful with very short lookback lengths (3 to 5) for identifying periods when the bands are contracted... usually leads to an expansion of volatilty, so good for scalps.
Enjoy.

R100 Volatility Combo Bands v1 (*v*)The Volatility Combo Bands are made from 4 separate volatility bands- two Bollinger Bands (10 and 20 period) and two Price Headley Acceleration Bands (10 and 20 period). The Volatility Combo Bands plot the innermost upper and lower points from these bands and then plots a mid-line. By default, only the standard 20 period Bollinger Bands and Combo Bands with mid-line are displayed, but can be configured however you want.
Try it out- see squeezes earlier, ride the bands earlier in trending markets, trade pullbacks to the Combo Bands and mid-line, trade the range of the band or use them to help identify potential support and resistance levels. Hopefully they can add another dimension to identifying volatility contraction patterns or whatever you currently use these things for!
I hope you get some value out of it. Only conditions of use are that if you improve it, let me know and if you publish something that uses it, don't hide the code! Enjoy!
Code for the Price Headley Acceleration Bands pinched and modified from LazyBear - thankyou.

